Click here for the BAT GCN circular template
Image
Pre-slew 15.0-350.0 keV image (Event data)

#   RAcent    DECcent   POSerr    Theta     Phi              Peak Cts       SNR   Name
  147.6056     9.3677   0.0064    23.5169   108.6988         8.2639196     30.181 TRIG_00675361

Foreground time interval of the image:
 -6.000 182.040 (delta_t = 188.040 [sec])
Background time interval of the image:
-271.051 -251.860 (delta_t =  19.192 [sec])
-239.152  -6.000 (delta_t = 233.152 [sec])
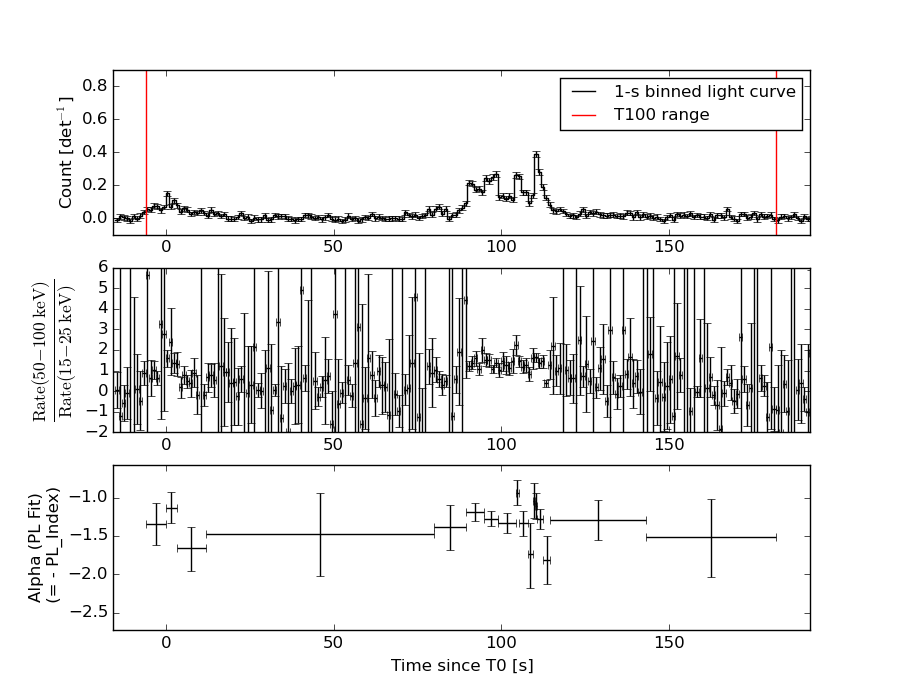
Lightcurves
Notes:
- 1) The mask-weighted light curves are using the flight position.
- 2) Multiple plots of different time binning/intervals are shown to cover all scenarios of short/long GRBs, rate/image triggers, and real/false positives.
- 3) For all the mask-weighted lightcurves, the y-axis units are counts/sec/det where a det is 0.4 x 0.4 = 0.16 sq cm.
- 4) The verticle lines correspond to following: green dotted lines are T50 interval, black dotted lines are T90 interval, blue solid line(s) is a spacecraft slew start time, and orange solid line(s) is a spacecraft slew end time.
- 5) Time of each bin is in the middle of the bin.
1 s binning
From T0-310 s to T0+310 s

From T100_start - 20 s to T100_end + 30 s
Full time interval
64 ms binning
Full time interval

From T100_start to T100_end

From T0-5 sec to T0+5 sec

16 ms binning
From T100_start-5 s to T100_start+5 s

Blue+Cyan dotted lines: Time interval of the scaled map
From 0.000000 to 4.096000
8 ms binning
From T100_start-3 s to T100_start+3 s
Blue+Cyan dotted lines: Time interval of the scaled map
From 0.000000 to 4.096000
2 ms binning
From T100_start-1 s to T100_start+1 s
Blue+Cyan dotted lines: Time interval of the scaled map
From 0.000000 to 4.096000
SN=5 or 10 sec. binning (whichever binning is satisfied first)
SN=5 or 10 sec. binning (T < 200 sec)
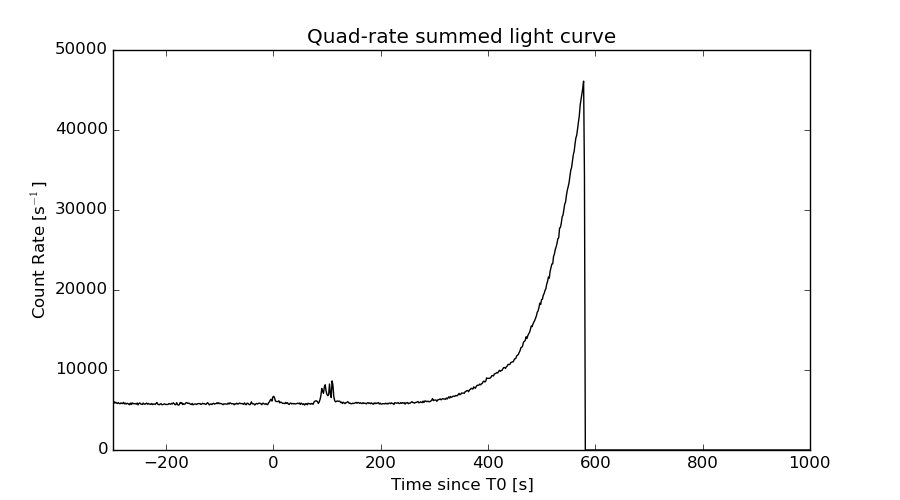
Quad-rate summed light curves (from T0-300s to T0+1000s)
Spectral Evolution
Spectra
Notes:
- 1) The fitting includes the systematic errors.
- 2) When the burst includes telescope slew time periods, the fitting uses an average response file made from multiple 5-s response files through out the slew time plus single time preiod for the non-slew times, and weighted by the total counts in the corresponding time period using addrmf. An average response file is needed becuase a spectral fit using the pre-slew DRM will introduce some errors in both a spectral shape and a normalization if the PHA file contains a lot of the slew/post-slew time interval.
- 3) For fits to more complicated models (e.g. a power-law over a cutoff power-law), the BAT team has decided to require a chi-square improvement of more than 6 for each extra dof.
Time averaged spectrum fit using the average DRM
Power-law model
Time interval is from   -6.000 sec. to  182.040 sec.

Spectral model in power-law:
------------------------------------------------------------
Parameters  : value       lower 90%   higher 90%
Photon index: 1.35449     ( -0.0729432   0.072692 )
Norm@50keV  : 2.85939E-03    ( -0.000115399   0.000115391 )
------------------------------------------------------------
#Fit statistic : Chi-Squared =          57.56 using 59 PHA bins.
# Reduced chi-squared =          1.010 for     57 degrees of freedom
# Null hypothesis probability =   4.542259e-01

Photon flux (15-150 keV)    in 188 sec: 0.344798 ( -0.014661  0.014689 ) ph/cm2/s
Energy fluence (15-150 keV)             : 5.24563e-06 ( -2.30552e-07  2.31306e-07 ) ergs/cm2
Cutoff power-law model
Time interval is from   -6.000 sec. to  182.040 sec.
Spectral model in the cutoff power-law:
------------------------------------------------------------
Parameters  : value       lower 90%   higher 90%
Photon index: 0.957906     ( -0.309207   0.2884 )
Epeak [keV] : 139.844      ( -39.1668 207.937 )
Norm@50keV  : 4.41148E-03    ( -0.00116567   0.00171362 )
------------------------------------------------------------
#Fit statistic : Chi-Squared =          51.91 using 59 PHA bins.
# Reduced chi-squared =         0.9269 for     56 degrees of freedom
# Null hypothesis probability =   6.304206e-01

Photon flux (15-150 keV)    in 188 sec: 0.337159 ( -0.015625  0.015636 ) ph/cm2/s
Energy fluence (15-150 keV)             : 5.0988e-06 ( -2.55766e-07  2.54943e-07 ) ergs/cm2
Band function
Time interval is from   -6.000 sec. to  182.040 sec.

Spectral model in the Band function:
------------------------------------------------------------
Parameters  : value       lower 90%   higher 90%
alpha       : -7.58889E-02   ( -1.00857   0.155961 )
beta        : -1.48036    ( 1.48067   0.120756 )
Epeak [keV] : 53.9768      ( -26.4605 161.735 )
Norm@50keV   : 1.69684E-02    ( -0.0175707   61.4705 )
------------------------------------------------------------
#Fit statistic : Chi-Squared =          51.25 using 59 PHA bins.
# Reduced chi-squared =         0.9319 for     55 degrees of freedom
# Null hypothesis probability =   6.185252e-01

Photon flux (15-150 keV)    in 188 sec:  (    ) ph/cm2/s
Energy fluence (15-150 keV)             : 0 ( 0  0 ) ergs/cm2
Single BB
Spectral model blackbody:
------------------------------------------------------------
Parameters  : value    Lower 90%  Upper 90%
kT [keV]    : 17.2793  (  )
R^2/D10^2   : 2.44470E-02  (   )
(R is the radius in km and D10 is the distance to the source in units of 10 kpc)
------------------------------------------------------------
#Fit statistic : Chi-Squared =         154.44 using 59 PHA bins.
# Reduced chi-squared =         2.7094 for     57 degrees of freedom
# Null hypothesis probability =   6.382224e-11

Energy  Fluence     90% Error
[keV]   [erg/cm2]   [erg/cm2]
15- 25  2.782e-07   2.228e-08
25- 50  1.247e-06   7.351e-08
50-150  2.672e-06   2.059e-07
15-150  4.197e-06   1.861e-07
Thermal bremsstrahlung (OTTB)
Spectral model: thermal bremsstrahlung
------------------------------------------------------------
Parameters  : value         Lower 90%    Upper 90%
kT [keV]    : 200.000       (-9.22744      -200)
Norm        : 1.43859       (-0.0583229     0.0583229)
------------------------------------------------------------
#Fit statistic : Chi-Squared =          74.61 using 59 PHA bins.
# Reduced chi-squared =          1.309 for     57 degrees of freedom
# Null hypothesis probability =   5.870299e-02

Energy  Fluence     90% Error
[keV]   [erg/cm2]   [erg/cm2]
15- 25  6.736e-07   3.130e-08
25- 50  1.296e-06   5.762e-08
50-150  2.842e-06   1.194e-07
15-150  4.811e-06   2.143e-07
Double BB
Spectral model: bbodyrad<1> + bbodyrad<2>
------------------------------------------------------------
Parameters  : value         Lower 90%    Upper 90%
kT1 [keV]   : 7.81336        (-1.21021      1.36793)
R1^2/D10^2  : 0.212392        (-0.082052      0.153636)
kT2 [keV]   : 28.2851        (-3.80435      6.01272)
R2^2/D10^2  : 3.70453E-03    (-0.00181024   0.00256648)
------------------------------------------------------------
#Fit statistic : Chi-Squared =          51.05 using 59 PHA bins.
# Reduced chi-squared =         0.9282 for     55 degrees of freedom
# Null hypothesis probability =   6.262921e-01

Energy  Fluence     90% Error
[keV]   [erg/cm2]   [erg/cm2]
15- 25  5.232e-07   8.573e-08
25- 50  1.270e-06   1.432e-07
50-150  3.311e-06   5.320e-07
15-150  5.105e-06   7.501e-07
Peak spectrum fit
Power-law model

Time interval is from  109.948 sec. to  110.948 sec.

Spectral model in power-law:
------------------------------------------------------------
Parameters  : value       lower 90%   higher 90%
Photon index: 1.17113     ( -0.132572   0.131866 )
Norm@50keV  : 2.66357E-02    ( -0.00207207   0.00207127 )
------------------------------------------------------------
#Fit statistic : Chi-Squared =          54.36 using 59 PHA bins.
# Reduced chi-squared =         0.9537 for     57 degrees of freedom
# Null hypothesis probability =   5.746667e-01

Photon flux (15-150 keV)    in 1 sec: 3.11439 ( -0.24521  0.24534 ) ph/cm2/s
Energy fluence (15-150 keV)             : 2.72515e-07 ( -2.40187e-08  2.41935e-08 ) ergs/cm2
Cutoff power-law model
Time interval is from  109.948 sec. to  110.948 sec.
Spectral model in the cutoff power-law:
------------------------------------------------------------
Parameters  : value       lower 90%   higher 90%
Photon index: 0.860491     ( -0.561646   0.374452 )
Epeak [keV] : 195.401      ( -195.403 -195.403 )
Norm@50keV  : 3.76609E-02    ( -0.0125082   0.0313741 )
------------------------------------------------------------
#Fit statistic : Chi-Squared =          53.27 using 59 PHA bins.
# Reduced chi-squared =         0.9513 for     56 degrees of freedom
# Null hypothesis probability =   5.787432e-01

Photon flux (15-150 keV)    in 1 sec: 3.08280 ( -0.25105  0.25073 ) ph/cm2/s
Energy fluence (15-150 keV)             : 2.67424e-07 ( -2.59335e-08  2.56856e-08 ) ergs/cm2
Band function
Time interval is from  109.948 sec. to  110.948 sec.

Spectral model in the Band function:
------------------------------------------------------------
Parameters  : value       lower 90%   higher 90%
alpha       : -3.21720E-02   ( 0.149955   0.149955 )
beta        : -1.32627    ( 1.32365   0.219772 )
Epeak [keV] : 64.8603      ( -63.5417 174.099 )
Norm@50keV   : 0.126547    ( -0.13685   779.418 )
------------------------------------------------------------
#Fit statistic : Chi-Squared =          52.21 using 59 PHA bins.
# Reduced chi-squared =         0.9493 for     55 degrees of freedom
# Null hypothesis probability =   5.818461e-01

Photon flux (15-150 keV)    in 1 sec:  (    ) ph/cm2/s
Energy fluence (15-150 keV)             : 0 ( 0  0 ) ergs/cm2
Single BB
Spectral model blackbody:
------------------------------------------------------------
Parameters  : value    Lower 90%  Upper 90%
kT [keV]    : 18.4553  (-1.90635  2.18422)
R^2/D10^2   : 0.189533  (-0.0578574   0.081419)
(R is the radius in km and D10 is the distance to the source in units of 10 kpc)
------------------------------------------------------------
#Fit statistic : Chi-Squared =          83.76 using 59 PHA bins.
# Reduced chi-squared =          1.469 for     57 degrees of freedom
# Null hypothesis probability =   1.203727e-02

Energy  Fluence     90% Error
[keV]   [erg/cm2]   [erg/cm2]
15- 25  1.282e-08   1.950e-09
25- 50  6.039e-08   6.255e-09
50-150  1.502e-07   2.215e-08
15-150  2.234e-07   2.180e-08
Thermal bremsstrahlung (OTTB)
Spectral model: thermal bremsstrahlung
------------------------------------------------------------
Parameters  : value         Lower 90%    Upper 90%
kT [keV]    : 200.000       (-17.3069      -200)
Norm        : 12.6498       (-1.00578     1.00578)
------------------------------------------------------------
#Fit statistic : Chi-Squared =          74.69 using 59 PHA bins.
# Reduced chi-squared =          1.310 for     57 degrees of freedom
# Null hypothesis probability =   5.797726e-02

Energy  Fluence     90% Error
[keV]   [erg/cm2]   [erg/cm2]
15- 25  3.149e-08   3.900e-09
25- 50  6.058e-08   7.945e-09
50-150  1.329e-07   6.729e-08
15-150  2.249e-07   7.070e-08
Double BB
Spectral model: bbodyrad<1> + bbodyrad<2>
------------------------------------------------------------
Parameters  : value         Lower 90%    Upper 90%
kT1 [keV]   : 8.88168        (-2.30186      2.83681)
R1^2/D10^2  : 1.23748        (-0.648647      1.76453)
kT2 [keV]   : 34.5228        (-8.93907      32.0468)
R2^2/D10^2  : 1.97679E-02    (-0.0166019   0.0351037)
------------------------------------------------------------
#Fit statistic : Chi-Squared =          52.44 using 59 PHA bins.
# Reduced chi-squared =         0.9534 for     55 degrees of freedom
# Null hypothesis probability =   5.731651e-01

Energy  Fluence     90% Error
[keV]   [erg/cm2]   [erg/cm2]
15- 25  2.224e-08   8.960e-09
25- 50  6.120e-08   2.269e-08
50-150  1.867e-07   8.874e-08
15-150  2.701e-07   1.123e-07
Pre-slew spectrum (Pre-slew PHA with pre-slew DRM)
Power-law model

Spectral model in power-law:
------------------------------------------------------------
Parameters  : value       lower 90%   higher 90%
Photon index: 1.35449     ( -0.0729432   0.072692 )
Norm@50keV  : 2.85939E-03    ( -0.000115399   0.000115391 )
------------------------------------------------------------
#Fit statistic : Chi-Squared =          57.56 using 59 PHA bins.
# Reduced chi-squared =          1.010 for     57 degrees of freedom
# Null hypothesis probability =   4.542259e-01

Photon flux (15-150 keV)    in 188 sec: 0.344793 ( -0.0146603  0.0146876 ) ph/cm2/s
Energy fluence (15-150 keV)             : 5.24501e-06 ( -2.30623e-07  2.31342e-07 ) ergs/cm2
Cutoff power-law model

Spectral model in the cutoff power-law:
------------------------------------------------------------
Parameters  : value       lower 90%   higher 90%
Photon index: 0.957908     ( -0.309209   0.288398 )
Epeak [keV] : 139.844      ( -39.1672 207.936 )
Norm@50keV  : 4.41147E-03    ( -0.00116566   0.00171363 )
------------------------------------------------------------
#Fit statistic : Chi-Squared =          51.91 using 59 PHA bins.
# Reduced chi-squared =         0.9269 for     56 degrees of freedom
# Null hypothesis probability =   6.304206e-01

Photon flux (15-150 keV)    in 188 sec: 0.337129 ( -0.01562  0.015632 ) ph/cm2/s
Energy fluence (15-150 keV)             : 5.10087e-06 ( -2.563e-07  2.55116e-07 ) ergs/cm2
Band function

Spectral model in the Band function:
------------------------------------------------------------
Parameters  : value       lower 90%   higher 90%
alpha       : -7.52756E-02   ( -1.02315   0.155195 )
beta        : -1.48037    ( 1.48063   0.120686 )
Epeak [keV] : 53.9640      ( -26.4561 161.743 )
Norm@50keV   : 1.69844E-02    ( -0.0175829   61.4723 )
------------------------------------------------------------
#Fit statistic : Chi-Squared =          51.25 using 59 PHA bins.
# Reduced chi-squared =         0.9319 for     55 degrees of freedom
# Null hypothesis probability =   6.185304e-01

Photon flux (15-150 keV)    in 188 sec:  (    ) ph/cm2/s
Energy fluence (15-150 keV)             : 0 ( 0  0 ) ergs/cm2
S(25-50 keV) vs. S(50-100 keV) plot

S(25-50 keV)  = 1.20e-06
S(50-100 keV) = 1.88e-06
T90 vs. Hardness ratio plot
T90                                   = 134.863999962807 sec.
Hardness ratio (energy fluence ratio) = 1.56667
Color vs. Color plot

Count Ratio  (25-50 keV) / (15-25 keV) = 1.56494
Count Ratio (50-100 keV) / (15-25 keV) = 1.32373
Mask shadow pattern

IMX = -1.395107656193708E-01, IMY = -4.121941653993130E-01
TIME vs. PHA plot around the trigger time
Blue+Cyan dotted lines: Time interval of the scaled map
From 0.000000 to 4.096000
TIME vs. DetID plot around the trigger time
Blue+Cyan dotted lines: Time interval of the scaled map
From 0.000000 to 4.096000
100 us light curve (15-350 keV)
Blue+Cyan dotted lines: Time interval of the scaled map
From 0.000000 to 4.096000
Spacecraft aspect plot

Bright source in the pre-burst/pre-slew/post-slew images
Pre-burst image of 15-350 keV band
Time interval of the image:
-271.051400 -251.859800
-239.152000 -6.000000

# RAcent  DECcent POSerr Theta    Phi  PeakCts   SNR AngSep     Name
#  [deg]    [deg]    ['] [deg]  [deg]                   [']
 83.6361  22.0261    0.4  41.2  -41.3  10.1608  28.7    0.7	Crab
135.5385 -40.5546    2.9  49.6 -167.6   2.0244   4.0    0.5	Vela X-1
134.9240 -43.6213    2.3  52.5 -166.0   2.7954   5.0 ------	UNKNOWN
 68.8843  31.4010    2.6  56.2  -33.2   5.4925   4.5 ------	UNKNOWN
 71.9876  23.5415    2.8  52.0  -42.1   4.4863   4.1 ------	UNKNOWN
 88.8673 -14.3101    4.9  41.2  -98.4   2.2025   2.4 ------	UNKNOWN
 98.9275 -33.1175    2.1  47.4 -127.2   4.8369   5.5 ------	UNKNOWN
Pre-slew background subtracted image of 15-350 keV band
Time interval of the image:
-6.000000 182.040000

# RAcent  DECcent POSerr Theta    Phi  PeakCts   SNR AngSep     Name
#  [deg]    [deg]    ['] [deg]  [deg]                   [']
 83.7548  22.0805   89.5  41.1  -41.1  -0.0419  -0.1    7.8	Crab
135.4518 -40.4234    4.6  49.5 -167.5   1.0703   2.5    8.6	Vela X-1
163.8269  10.3743    2.3  39.5  107.3   3.8455   5.1 ------	UNKNOWN
147.6057   9.3678    0.4  23.5  108.7   8.2643  30.2 ------	UNKNOWN
 75.9864  31.9345    2.2  50.5  -30.6   2.5834   5.1 ------	UNKNOWN
112.6985 -37.0544    2.6  46.1 -143.5   1.8314   4.4 ------	UNKNOWN
104.0304 -39.1178    2.7  50.5 -135.9   3.7870   4.3 ------	UNKNOWN
Post-slew image of 15-350 keV band
Time interval of the image:
449.948600 603.048000

# RAcent  DECcent POSerr Theta    Phi  PeakCts   SNR AngSep     Name
#  [deg]    [deg]    ['] [deg]  [deg]                   [']
170.2221 -60.4832    5.1  25.0  123.0   3.6827   2.2    8.8	Cen X-3
186.5583 -62.9390  104.3  25.6  142.0   0.1664   0.1   10.5	GX 301-2
264.8108 -44.3360   10.4  54.5 -156.0   4.5211   1.1    7.4	4U 1735-44
198.3702 -41.0084    2.7  48.6  142.4  21.1924   4.2 ------	UNKNOWN
231.2515 -63.4745    2.7  32.1 -178.6   5.5104   4.3 ------	UNKNOWN
 61.3118 -57.0677    2.8  28.1  -18.5   4.8233   4.2 ------	UNKNOWN
 55.1414 -30.5829    3.1  54.8  -15.5  13.1691   3.7 ------	UNKNOWN
 45.5648 -34.4086    3.3  52.7  -26.2   9.0648   3.5 ------	UNKNOWN
295.8953 -52.0557    2.5  48.0 -129.0  19.6431   4.6 ------	UNKNOWN
Plot creation:
Fri Mar 18 11:35:15 EDT 2016