Special notes of this burst
Image
Pre-slew 15.0-350.0 keV image (Event data)
#   RAcent    DECcent   POSerr    Theta     Phi              Peak Cts       SNR   Name
  164.2173    53.6605   0.0162    41.5659    19.9838         2.8644119     11.877 TRIG_00675998

Foreground time interval of the image:
-30.376  18.376 (delta_t =  48.752 [sec])
 19.680 109.581 (delta_t =  89.901 [sec])
Background time interval of the image:
-239.320 -30.376 (delta_t = 208.944 [sec])
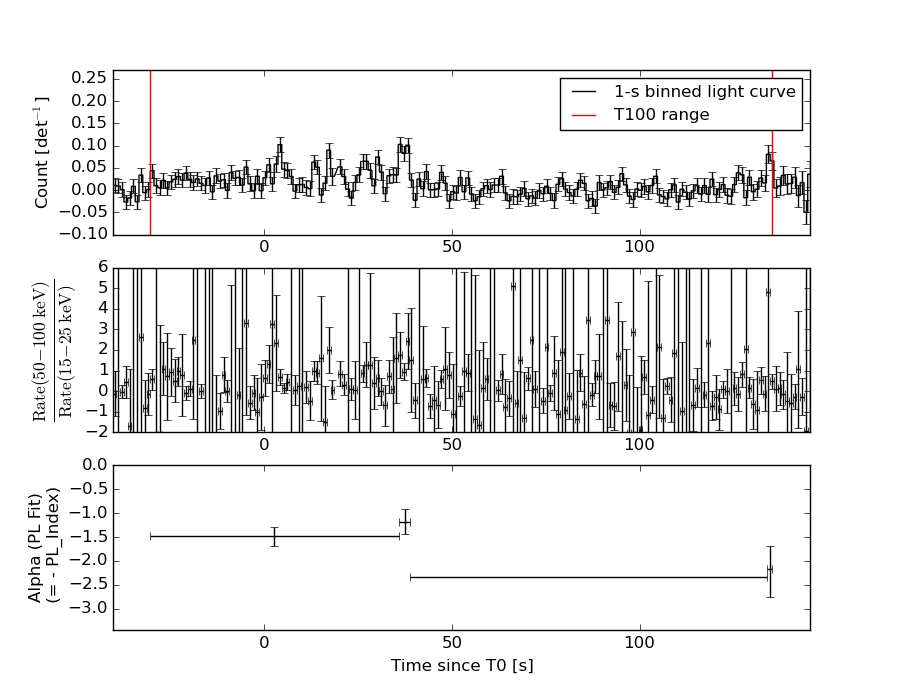
Lightcurves
Notes:
- 1) The mask-weighted light curves are using the flight position.
- 2) Multiple plots of different time binning/intervals are shown to cover all scenarios of short/long GRBs, rate/image triggers, and real/false positives.
- 3) For all the mask-weighted lightcurves, the y-axis units are counts/sec/det where a det is 0.4 x 0.4 = 0.16 sq cm.
- 4) The verticle lines correspond to following: green dotted lines are T50 interval, black dotted lines are T90 interval, blue solid line(s) is a spacecraft slew start time, and orange solid line(s) is a spacecraft slew end time.
- 5) Time of each bin is in the middle of the bin.
1 s binning
From T0-310 s to T0+310 s

From T100_start - 20 s to T100_end + 30 s

Full time interval

64 ms binning
Full time interval

From T100_start to T100_end

From T0-5 sec to T0+5 sec

16 ms binning
From T100_start-5 s to T100_start+5 s

8 ms binning
From T100_start-3 s to T100_start+3 s

2 ms binning
From T100_start-1 s to T100_start+1 s
SN=5 or 10 sec. binning (whichever binning is satisfied first)

SN=5 or 10 sec. binning (T < 200 sec)

Quad-rate summed light curves (from T0-300s to T0+1000s)

Spectral Evolution
Spectra
Notes:
- 1) The fitting includes the systematic errors.
- 2) When the burst includes telescope slew time periods, the fitting uses an average response file made from multiple 5-s response files through out the slew time plus single time preiod for the non-slew times, and weighted by the total counts in the corresponding time period using addrmf. An average response file is needed becuase a spectral fit using the pre-slew DRM will introduce some errors in both a spectral shape and a normalization if the PHA file contains a lot of the slew/post-slew time interval.
- 3) For fits to more complicated models (e.g. a power-law over a cutoff power-law), the BAT team has decided to require a chi-square improvement of more than 6 for each extra dof.
Time averaged spectrum fit using the average DRM
Power-law model
Multiple GTIs in the spectrum
tstart tstop
-30.376000 18.375600
19.680000 135.288000

Spectral model in power-law:
------------------------------------------------------------
Parameters  : value       lower 90%   higher 90%
Photon index: 1.56788     ( -0.237517   0.240599 )
Norm@50keV  : 1.02244E-03    ( -0.000145223   0.000144264 )
------------------------------------------------------------
#Fit statistic : Chi-Squared =          56.93 using 59 PHA bins.
# Reduced chi-squared =         0.9988 for     57 degrees of freedom
# Null hypothesis probability =   4.776447e-01

Photon flux (15-150 keV)    in 164.4 sec: 0.130119 ( -0.018636  0.018691 ) ph/cm2/s
Energy fluence (15-150 keV)             : 1.57871e-06 ( -2.38347e-07  2.40371e-07 ) ergs/cm2
Cutoff power-law model

Multiple GTIs in the spectrum
tstart tstop
-30.376000 18.375600
19.680000 135.288000
Spectral model in the cutoff power-law:
------------------------------------------------------------
Parameters  : value       lower 90%   higher 90%
Photon index: 1.16496     ( -1.21356   0.619884 )
Epeak [keV] : 104.125      ( -77.4542 -104.134 )
Norm@50keV  : 1.63586E-03    ( -0.00163572   0.00486251 )
------------------------------------------------------------
#Fit statistic : Chi-Squared =          56.46 using 59 PHA bins.
# Reduced chi-squared =          1.008 for     56 degrees of freedom
# Null hypothesis probability =   4.576963e-01

Photon flux (15-150 keV)    in 164.4 sec: 0.128029 ( -0.019489  0.019381 ) ph/cm2/s
Energy fluence (15-150 keV)             : 1.53848e-06 ( -2.618e-07  2.59321e-07 ) ergs/cm2
Band function

Multiple GTIs in the spectrum
tstart tstop
-30.376000 18.375600
19.680000 135.288000

Spectral model in the Band function:
------------------------------------------------------------
Parameters  : value       lower 90%   higher 90%
alpha       : -0.947250   ( 0.946293   5.56559 )
beta        : -1.87675    ( 1.87435   0.510798 )
Epeak [keV] : 78.6012      ( -78.6864 -78.6864 )
Norm@50keV   : 2.17642E-03    ( -0.00122103   145363 )
------------------------------------------------------------
#Fit statistic : Chi-Squared =          56.24 using 59 PHA bins.
# Reduced chi-squared =          1.022 for     55 degrees of freedom
# Null hypothesis probability =   4.283853e-01

Photon flux (15-150 keV)    in 164.4 sec:  (    ) ph/cm2/s
Energy fluence (15-150 keV)             : 0 ( 0  0 ) ergs/cm2
Single BB
Spectral model blackbody:
------------------------------------------------------------
Parameters  : value    Lower 90%  Upper 90%
kT [keV]    : 14.7276  (-2.1981  2.68078)
R^2/D10^2   : 1.57236E-02  (-0.00715779   0.012459)
(R is the radius in km and D10 is the distance to the source in units of 10 kpc)
------------------------------------------------------------
#Fit statistic : Chi-Squared =          65.66 using 59 PHA bins.
# Reduced chi-squared =          1.152 for     57 degrees of freedom
# Null hypothesis probability =   2.018955e-01

Energy  Fluence     90% Error
[keV]   [erg/cm2]   [erg/cm2]
15- 25  1.177e-07   2.787e-08
25- 50  4.598e-07   9.560e-08
50-150  6.732e-07   1.994e-07
15-150  1.251e-06   2.584e-07
Thermal bremsstrahlung (OTTB)
Spectral model: thermal bremsstrahlung
------------------------------------------------------------
Parameters  : value         Lower 90%    Upper 90%
kT [keV]    : 198.717       (-96.8886      -198.666)
Norm        : 0.530424       (-0.0732895     0.091256)
------------------------------------------------------------
#Fit statistic : Chi-Squared =          56.48 using 59 PHA bins.
# Reduced chi-squared =         0.9908 for     57 degrees of freedom
# Null hypothesis probability =   4.946078e-01

Energy  Fluence     90% Error
[keV]   [erg/cm2]   [erg/cm2]
15- 25  2.172e-07   1.229e-07
25- 50  4.177e-07   2.345e-07
50-150  9.151e-07   5.046e-07
15-150  1.550e-06   8.467e-07
Double BB
Spectral model: bbodyrad<1> + bbodyrad<2>
------------------------------------------------------------
Parameters  : value         Lower 90%    Upper 90%
kT1 [keV]   : 4.46238        (-2.04415      8.91189)
R1^2/D10^2  : 0.623688        (-0.60305      13.6164)
kT2 [keV]   : 18.6091        (-3.87481      -18.6122)
R2^2/D10^2  : 6.02354E-03    (-0.00513212   0.00864453)
------------------------------------------------------------
#Fit statistic : Chi-Squared =          57.27 using 59 PHA bins.
# Reduced chi-squared =          1.041 for     55 degrees of freedom
# Null hypothesis probability =   3.909699e-01

Energy  Fluence     90% Error
[keV]   [erg/cm2]   [erg/cm2]
15- 25  2.225e-07   1.184e-07
25- 50  3.973e-07   1.798e-07
50-150  8.172e-07   3.870e-07
15-150  1.437e-06   6.389e-07
Peak spectrum fit
Power-law model

Time interval is from   37.132 sec. to   38.132 sec.

Spectral model in power-law:
------------------------------------------------------------
Parameters  : value       lower 90%   higher 90%
Photon index: 1.16745     ( -0.453251   0.413042 )
Norm@50keV  : 8.65383E-03    ( -0.00201546   0.00195418 )
------------------------------------------------------------
#Fit statistic : Chi-Squared =          45.69 using 59 PHA bins.
# Reduced chi-squared =         0.8016 for     57 degrees of freedom
# Null hypothesis probability =   8.587638e-01

Photon flux (15-150 keV)    in 1 sec: 1.01137 ( -0.24901  0.25139 ) ph/cm2/s
Energy fluence (15-150 keV)             : 8.86339e-08 ( -2.00898e-08  2.00912e-08 ) ergs/cm2
Cutoff power-law model

Time interval is from   37.132 sec. to   38.132 sec.
Spectral model in the cutoff power-law:
------------------------------------------------------------
Parameters  : value       lower 90%   higher 90%
Photon index: 2.60014     ( -2.49959   -2.60037 )
Epeak [keV] : 190.706      (   )
Norm@50keV  : 1.37670E-03    (     )
------------------------------------------------------------
#Fit statistic : Chi-Squared =          45.60 using 59 PHA bins.
# Reduced chi-squared =         0.8143 for     56 degrees of freedom
# Null hypothesis probability =   8.382258e-01

Photon flux (15-150 keV)    in 1 sec: 1.01629 (    ) ph/cm2/s
Energy fluence (15-150 keV)             : 2.45697e-08 ( 0  0 ) ergs/cm2
Band function

Time interval is from   37.132 sec. to   38.132 sec.

Spectral model in the Band function:
------------------------------------------------------------
Parameters  : value       lower 90%   higher 90%
alpha       : -0.937726   ( 0.937724   0.937724 )
beta        : -1.16743    ( 1.16742   0.453249 )
Epeak [keV] : 48.3880      ( -48.3864 -48.3864 )
Norm@50keV   : 1.55958E-02    ( -0.00883968   0 )
------------------------------------------------------------
#Fit statistic : Chi-Squared =          45.69 using 59 PHA bins.
# Reduced chi-squared =         0.8308 for     55 degrees of freedom
# Null hypothesis probability =   8.101412e-01

Photon flux (15-150 keV)    in 1 sec:  (    ) ph/cm2/s
Energy fluence (15-150 keV)             : 0 ( 0  0 ) ergs/cm2
Single BB

Spectral model blackbody:
------------------------------------------------------------
Parameters  : value    Lower 90%  Upper 90%
kT [keV]    : 25.1431  (-7.08358  12.673)
R^2/D10^2   : 2.16638E-02  (-0.0152663   0.042173)
(R is the radius in km and D10 is the distance to the source in units of 10 kpc)
------------------------------------------------------------
#Fit statistic : Chi-Squared =          52.43 using 59 PHA bins.
# Reduced chi-squared =         0.9198 for     57 degrees of freedom
# Null hypothesis probability =   6.470190e-01

Energy  Fluence     90% Error
[keV]   [erg/cm2]   [erg/cm2]
15- 25  2.372e-09   1.320e-09
25- 50  1.350e-08   6.719e-09
50-150  6.321e-08   3.344e-08
15-150  7.908e-08   3.821e-08
Thermal bremsstrahlung (OTTB)

Spectral model: thermal bremsstrahlung
------------------------------------------------------------
Parameters  : value         Lower 90%    Upper 90%
kT [keV]    : 200.000       (-73.3905      -200)
Norm        : 4.36298       (-0.986262     0.986262)
------------------------------------------------------------
#Fit statistic : Chi-Squared =          49.24 using 59 PHA bins.
# Reduced chi-squared =         0.8639 for     57 degrees of freedom
# Null hypothesis probability =   7.577306e-01

Energy  Fluence     90% Error
[keV]   [erg/cm2]   [erg/cm2]
15- 25  1.087e-08   6.550e-09
25- 50  2.091e-08   1.218e-08
50-150  4.587e-08   2.630e-08
15-150  7.766e-08   4.539e-08
Double BB
Spectral model: bbodyrad<1> + bbodyrad<2>
------------------------------------------------------------
Parameters  : value         Lower 90%    Upper 90%
kT1 [keV]   : 4.24239        (-1.76213      4.12891)
R1^2/D10^2  : 8.42601        (-7.95184      80.1385)
kT2 [keV]   : 32.6959        (-10.3515      28.5539)
R2^2/D10^2  : 9.00944E-03    (-0.00729612   0.0124656)
------------------------------------------------------------
#Fit statistic : Chi-Squared =          43.84 using 59 PHA bins.
# Reduced chi-squared =         0.7971 for     55 degrees of freedom
# Null hypothesis probability =   8.601834e-01

Energy  Fluence     90% Error
[keV]   [erg/cm2]   [erg/cm2]
15- 25  1.155e-08   6.572e-09
25- 50  1.341e-08   7.220e-09
50-150  6.622e-08   3.906e-08
15-150  9.117e-08   5.005e-08
Pre-slew spectrum (Pre-slew PHA with pre-slew DRM)
Power-law model

Spectral model in power-law:
------------------------------------------------------------
Parameters  : value       lower 90%   higher 90%
Photon index: 1.48872     ( -0.24174   0.242076 )
Norm@50keV  : 1.07971E-03    ( -0.000154955   0.00015454 )
------------------------------------------------------------
#Fit statistic : Chi-Squared =          62.05 using 59 PHA bins.
# Reduced chi-squared =          1.089 for     57 degrees of freedom
# Null hypothesis probability =   3.008265e-01

Photon flux (15-150 keV)    in 138.7 sec: 0.134385 ( -0.0199055  0.0199804 ) ph/cm2/s
Energy fluence (15-150 keV)             : 1.42331e-06 ( -2.18314e-07  2.20031e-07 ) ergs/cm2
Cutoff power-law model

Spectral model in the cutoff power-law:
------------------------------------------------------------
Parameters  : value       lower 90%   higher 90%
Photon index: 0.918968     ( -1.27275   0.756868 )
Epeak [keV] : 97.5970      ( -37.7078 -97.5964 )
Norm@50keV  : 2.06757E-03    ( -0.00111085   0.0062858 )
------------------------------------------------------------
#Fit statistic : Chi-Squared =          61.15 using 59 PHA bins.
# Reduced chi-squared =          1.092 for     56 degrees of freedom
# Null hypothesis probability =   2.963589e-01

Photon flux (15-150 keV)    in 138.7 sec: 0.131292 ( -0.020861  0.020752 ) ph/cm2/s
Energy fluence (15-150 keV)             : 1.37675e-06 ( -2.373e-07  2.36481e-07 ) ergs/cm2
Band function
Spectral model in the Band function:
------------------------------------------------------------
Parameters  : value       lower 90%   higher 90%
alpha       : -0.755113   ( 0.75347   5.72969 )
beta        : -1.92550    ( 1.92824   0.626488 )
Epeak [keV] : 82.6313      ( -82.6044 447.031 )
Norm@50keV   : 2.55689E-03    ( -0.00130095   24.824 )
------------------------------------------------------------
#Fit statistic : Chi-Squared =          60.98 using 59 PHA bins.
# Reduced chi-squared =          1.109 for     55 degrees of freedom
# Null hypothesis probability =   2.697438e-01

Photon flux (15-150 keV)    in 138.7 sec:  (    ) ph/cm2/s
Energy fluence (15-150 keV)             : 0 ( 0  0 ) ergs/cm2
S(25-50 keV) vs. S(50-100 keV) plot

S(25-50 keV)  = 4.03e-07
S(50-100 keV) = 5.44e-07
T90 vs. Hardness ratio plot

T90                                   = 157.456000030041 sec.
Hardness ratio (energy fluence ratio) = 1.34988
Color vs. Color plot
Count Ratio  (25-50 keV) / (15-25 keV) = 1.1199
Count Ratio (50-100 keV) / (15-25 keV) = 0.98971
Mask shadow pattern

IMX = 8.333837529970634E-01, IMY = -3.030601412418512E-01
TIME vs. PHA plot around the trigger time

TIME vs. DetID plot around the trigger time
100 us light curve (15-350 keV)
Spacecraft aspect plot
Bright source in the pre-burst/pre-slew/post-slew images
Pre-burst image of 15-350 keV band
Time interval of the image:
-239.320000 -30.376000

# RAcent  DECcent POSerr Theta    Phi  PeakCts   SNR AngSep     Name
#  [deg]    [deg]    ['] [deg]  [deg]                   [']
 83.6310  22.0196    0.3  27.4 -133.1   8.2756  39.2    0.3	Crab
155.8018  21.5593    3.3  40.5   70.8   2.4552   3.5 ------	UNKNOWN
201.9164  77.1989    2.8  57.2   -9.8   3.0541   4.0 ------	UNKNOWN
Pre-slew background subtracted image of 15-350 keV band
Time interval of the image:
-30.376000 18.375600
19.680000 109.580600

# RAcent  DECcent POSerr Theta    Phi  PeakCts   SNR AngSep     Name
#  [deg]    [deg]    ['] [deg]  [deg]                   [']
 83.6479  22.1255    6.3  27.3 -132.9   0.3148   1.8    6.7	Crab
164.2172  53.6606    1.0  41.6   20.0   2.8650  11.9 ------	UNKNOWN
158.9161  84.9356    2.7  52.9  -20.4   1.6212   4.4 ------	UNKNOWN
 69.3703  76.7328    2.1  47.0  -37.3   1.8605   5.5 ------	UNKNOWN
 70.4840   0.0809    2.7  51.3 -147.3   1.8948   4.3 ------	UNKNOWN
Post-slew image of 15-350 keV band
Time interval of the image:
262.380600 589.080600

# RAcent  DECcent POSerr Theta    Phi  PeakCts   SNR AngSep     Name
#  [deg]    [deg]    ['] [deg]  [deg]                   [']
135.5711 -40.5752    1.4  24.8   45.1   2.1490   8.1    2.3	Vela X-1
170.3694 -60.4619    4.5   4.8 -160.4   0.5474   2.6    9.8	Cen X-3
186.6240 -62.7580    2.7  12.6 -148.9   0.9658   4.3    1.2	GX 301-2
159.0653 -34.7702    2.5  24.9   92.4   1.3237   4.6 ------	UNKNOWN
162.2556 -43.0857    3.2  16.6   99.4   0.8057   3.6 ------	UNKNOWN
224.0643 -26.2464    2.7  54.1  177.1   3.9521   4.4 ------	UNKNOWN
 67.9782 -45.9225    2.0  53.0  -23.5   3.5485   5.7 ------	UNKNOWN
263.2729 -57.4277    2.3  48.0 -129.0   5.2337   4.9 ------	UNKNOWN
297.1695 -76.3783    4.9  41.1  -98.3   3.0613   2.4 ------	UNKNOWN
Plot creation:
Fri Mar 18 11:33:17 EDT 2016