Special notes of this burst
Image
Pre-slew 15.0-350.0 keV image (Event data)
#   RAcent    DECcent   POSerr    Theta     Phi              Peak Cts       SNR   Name
  168.7143    22.7082   0.0172    22.5514  -171.1635         0.2339239     11.219 TRIG_00677495

Foreground time interval of the image:
 -0.088   5.320 (delta_t =   5.408 [sec])
Background time interval of the image:
-244.083  -0.088 (delta_t = 243.995 [sec])
Lightcurves
Notes:
- 1) The mask-weighted light curves are using the flight position.
- 2) Multiple plots of different time binning/intervals are shown to cover all scenarios of short/long GRBs, rate/image triggers, and real/false positives.
- 3) For all the mask-weighted lightcurves, the y-axis units are counts/sec/det where a det is 0.4 x 0.4 = 0.16 sq cm.
- 4) The verticle lines correspond to following: green dotted lines are T50 interval, black dotted lines are T90 interval, blue solid line(s) is a spacecraft slew start time, and orange solid line(s) is a spacecraft slew end time.
- 5) Time of each bin is in the middle of the bin.
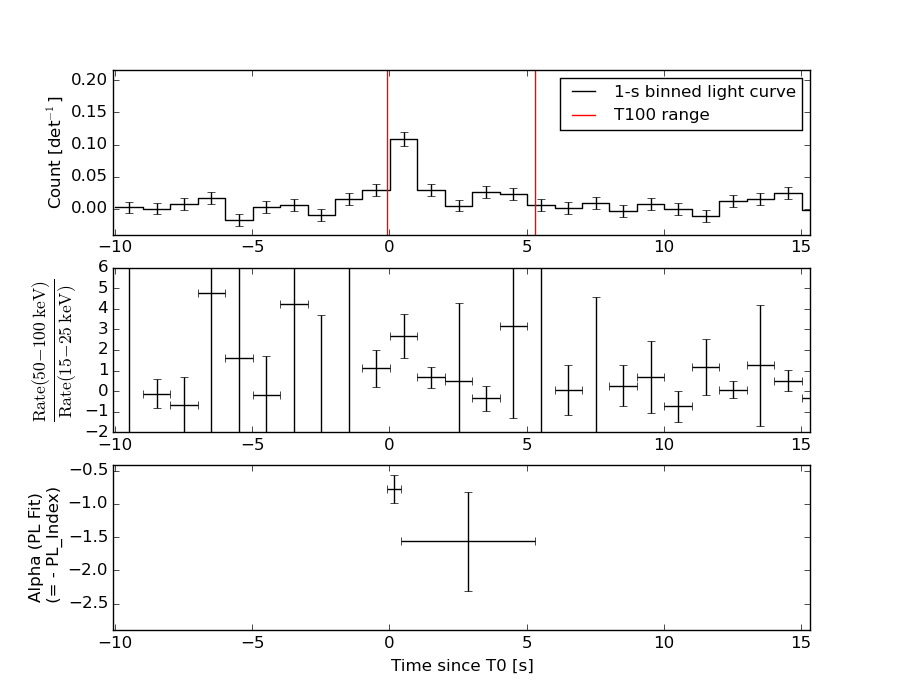
1 s binning
From T0-310 s to T0+310 s
From T100_start - 20 s to T100_end + 30 s
Full time interval
64 ms binning
Full time interval

From T100_start to T100_end
From T0-5 sec to T0+5 sec

16 ms binning
From T100_start-5 s to T100_start+5 s
Blue+Cyan dotted lines: Time interval of the scaled map
From 0.000000 to 0.256000
8 ms binning
From T100_start-3 s to T100_start+3 s

Blue+Cyan dotted lines: Time interval of the scaled map
From 0.000000 to 0.256000
2 ms binning
From T100_start-1 s to T100_start+1 s
Blue+Cyan dotted lines: Time interval of the scaled map
From 0.000000 to 0.256000
SN=5 or 10 sec. binning (whichever binning is satisfied first)

SN=5 or 10 sec. binning (T < 200 sec)
Quad-rate summed light curves (from T0-300s to T0+1000s)

Spectral Evolution
Spectra
Notes:
- 1) The fitting includes the systematic errors.
- 2) When the burst includes telescope slew time periods, the fitting uses an average response file made from multiple 5-s response files through out the slew time plus single time preiod for the non-slew times, and weighted by the total counts in the corresponding time period using addrmf. An average response file is needed becuase a spectral fit using the pre-slew DRM will introduce some errors in both a spectral shape and a normalization if the PHA file contains a lot of the slew/post-slew time interval.
- 3) For fits to more complicated models (e.g. a power-law over a cutoff power-law), the BAT team has decided to require a chi-square improvement of more than 6 for each extra dof.
Time averaged spectrum fit using the average DRM
Power-law model
Time interval is from   -0.088 sec. to    5.320 sec.

Spectral model in power-law:
------------------------------------------------------------
Parameters  : value       lower 90%   higher 90%
Photon index: 1.05160     ( -0.346065   0.32183 )
Norm@50keV  : 2.57135E-03    ( -0.000438346   0.000434243 )
------------------------------------------------------------
#Fit statistic : Chi-Squared =          54.49 using 59 PHA bins.
# Reduced chi-squared =         0.9559 for     57 degrees of freedom
# Null hypothesis probability =   5.699589e-01

Photon flux (15-150 keV)    in 5.408 sec: 0.297016 ( -0.05209  0.05226 ) ph/cm2/s
Energy fluence (15-150 keV)             : 1.47729e-07 ( -2.70489e-08  2.72783e-08 ) ergs/cm2
Cutoff power-law model

Time interval is from   -0.088 sec. to    5.320 sec.
Spectral model in the cutoff power-law:
------------------------------------------------------------
Parameters  : value       lower 90%   higher 90%
Photon index: 1.06521     ( -0.381496   0.306888 )
Epeak [keV] : 9999.36      ( -9999.36 -9999.36 )
Norm@50keV  : 2.58949E-03    ( -0.000434014   0.00191444 )
------------------------------------------------------------
#Fit statistic : Chi-Squared =          54.52 using 59 PHA bins.
# Reduced chi-squared =         0.9736 for     56 degrees of freedom
# Null hypothesis probability =   5.310604e-01

Photon flux (15-150 keV)    in 5.408 sec: 0.301659 ( -0.056793  0.04755 ) ph/cm2/s
Energy fluence (15-150 keV)             : 1.48111e-07 ( -2.75079e-08  2.67801e-08 ) ergs/cm2
Band function

Time interval is from   -0.088 sec. to    5.320 sec.

Spectral model in the Band function:
------------------------------------------------------------
Parameters  : value       lower 90%   higher 90%
alpha       : -0.898362   ( 0.898319   0.898319 )
beta        : -1.05163    ( -0.321347   0.346184 )
Epeak [keV] : 38.5504      ( -38.5546 -38.5546 )
Norm@50keV   : 4.22007E-03    ( -0.00207826   0 )
------------------------------------------------------------
#Fit statistic : Chi-Squared =          54.49 using 59 PHA bins.
# Reduced chi-squared =         0.9907 for     55 degrees of freedom
# Null hypothesis probability =   4.942053e-01

Photon flux (15-150 keV)    in 5.408 sec:  (    ) ph/cm2/s
Energy fluence (15-150 keV)             : 0 ( 0  0 ) ergs/cm2
Single BB

Spectral model blackbody:
------------------------------------------------------------
Parameters  : value    Lower 90%  Upper 90%
kT [keV]    : 21.0665  (-5.5066  9.96167)
R^2/D10^2   : 1.13498E-02  (-0.0111742   0.0189269)
(R is the radius in km and D10 is the distance to the source in units of 10 kpc)
------------------------------------------------------------
#Fit statistic : Chi-Squared =          67.98 using 59 PHA bins.
# Reduced chi-squared =          1.193 for     57 degrees of freedom
# Null hypothesis probability =   1.514558e-01

Energy  Fluence     90% Error
[keV]   [erg/cm2]   [erg/cm2]
15- 25  5.139e-09   2.059e-09
25- 50  2.647e-08   9.521e-09
50-150  8.758e-08   3.047e-08
15-150  1.192e-07   3.805e-08
Thermal bremsstrahlung (OTTB)
Spectral model: thermal bremsstrahlung
------------------------------------------------------------
Parameters  : value         Lower 90%    Upper 90%
kT [keV]    : 200.000       (-52.1159      -200)
Norm        : 1.22962       (-0.213331     0.213331)
------------------------------------------------------------
#Fit statistic : Chi-Squared =          62.19 using 59 PHA bins.
# Reduced chi-squared =          1.091 for     57 degrees of freedom
# Null hypothesis probability =   2.965486e-01

Energy  Fluence     90% Error
[keV]   [erg/cm2]   [erg/cm2]
15- 25  1.656e-08   9.721e-09
25- 50  3.185e-08   1.837e-08
50-150  6.986e-08   3.986e-08
15-150  1.183e-07   6.738e-08
Double BB
#Fit statistic : Chi-Squared =          51.25 using 59 PHA bins.
# Reduced chi-squared =         0.9445 for     55 degrees of freedom
# Reduced chi-squared =         0.9440 for     55 degrees of freedom
# Reduced chi-squared =         0.9353 for     55 degrees of freedom
# Reduced chi-squared =         0.9332 for     55 degrees of freedom
# Reduced chi-squared =         0.9326 for     55 degrees of freedom
# Reduced chi-squared =         0.9319 for     55 degrees of freedom
# Null hypothesis probability =   5.920434e-01
# Null hypothesis probability =   5.929714e-01
# Null hypothesis probability =   6.114280e-01
# Null hypothesis probability =   6.156888e-01
# Null hypothesis probability =   6.170206e-01
# Null hypothesis probability =   6.185874e-01

Energy  Fluence     90% Error
[keV]   [erg/cm2]   [erg/cm2]
15- 25  1.112e-08   6.452e-09
25- 50  3.118e-08   1.779e-08
50-150  1.139e-07   8.823e-08
15-150  1.562e-07   1.088e-07
Peak spectrum fit
Power-law model

Time interval is from   -0.088 sec. to    0.912 sec.

Spectral model in power-law:
------------------------------------------------------------
Parameters  : value       lower 90%   higher 90%
Photon index: 0.803042     ( -0.253919   0.237819 )
Norm@50keV  : 8.25025E-03    ( -0.00116714   0.00114651 )
------------------------------------------------------------
#Fit statistic : Chi-Squared =          43.86 using 59 PHA bins.
# Reduced chi-squared =         0.7695 for     57 degrees of freedom
# Null hypothesis probability =   8.991643e-01

Photon flux (15-150 keV)    in 1 sec: 0.948107 ( -0.129706  0.130353 ) ph/cm2/s
Energy fluence (15-150 keV)             : 9.62986e-08 ( -1.34701e-08  1.35539e-08 ) ergs/cm2
Cutoff power-law model
Time interval is from   -0.088 sec. to    0.912 sec.
Spectral model in the cutoff power-law:
------------------------------------------------------------
Parameters  : value       lower 90%   higher 90%
Photon index: 0.505937     ( -1.16264   0.507626 )
Epeak [keV] : 299.331      ( -299.168 -299.168 )
Norm@50keV  : 1.10493E-02    (     )
------------------------------------------------------------
#Fit statistic : Chi-Squared =          43.58 using 59 PHA bins.
# Reduced chi-squared =         0.7782 for     56 degrees of freedom
# Null hypothesis probability =   8.867404e-01

Photon flux (15-150 keV)    in 1 sec: 0.936113 ( -0.13572  0.133227 ) ph/cm2/s
Energy fluence (15-150 keV)             : 9.48943e-08 ( -1.46914e-08  1.28092e-08 ) ergs/cm2
Band function
Time interval is from   -0.088 sec. to    0.912 sec.

Spectral model in the Band function:
------------------------------------------------------------
Parameters  : value       lower 90%   higher 90%
alpha       : 5.00000   ( -5   -5 )
beta        : -0.699713    ( -0.240553   0.255961 )
Epeak [keV] : 9989.05      ( -35.3167 -9989.06 )
Norm@50keV   : 7.91060E-08    ( -7.90976e-08   0.00010171 )
------------------------------------------------------------
#Fit statistic : Chi-Squared =          43.74 using 59 PHA bins.
# Reduced chi-squared =         0.7953 for     55 degrees of freedom
# Null hypothesis probability =   8.625835e-01

Photon flux (15-150 keV)    in 1 sec:  (    ) ph/cm2/s
Energy fluence (15-150 keV)             : 0 ( 0  0 ) ergs/cm2
Single BB
Spectral model blackbody:
------------------------------------------------------------
Parameters  : value    Lower 90%  Upper 90%
kT [keV]    : 24.8842  (-4.40466  6.15512)
R^2/D10^2   : 2.40644E-02  (-0.0115091   0.019705)
(R is the radius in km and D10 is the distance to the source in units of 10 kpc)
------------------------------------------------------------
#Fit statistic : Chi-Squared =          49.58 using 59 PHA bins.
# Reduced chi-squared =         0.8698 for     57 degrees of freedom
# Null hypothesis probability =   7.467594e-01

Energy  Fluence     90% Error
[keV]   [erg/cm2]   [erg/cm2]
15- 25  2.595e-09   6.890e-10
25- 50  1.469e-08   3.564e-09
50-150  6.748e-08   1.510e-08
15-150  8.476e-08   2.051e-08
Thermal bremsstrahlung (OTTB)
Spectral model: thermal bremsstrahlung
------------------------------------------------------------
Parameters  : value         Lower 90%    Upper 90%
kT [keV]    : 200.000       (-27.0493      -200)
Norm        : 3.80177       (-0.543018     0.543018)
------------------------------------------------------------
#Fit statistic : Chi-Squared =          69.96 using 59 PHA bins.
# Reduced chi-squared =          1.227 for     57 degrees of freedom
# Null hypothesis probability =   1.162689e-01

Energy  Fluence     90% Error
[keV]   [erg/cm2]   [erg/cm2]
15- 25  9.469e-09   5.480e-09
25- 50  1.822e-08   1.014e-08
50-150  3.995e-08   2.212e-08
15-150  6.763e-08   3.798e-08
Double BB

R1^2/D10^2  : 8.87719E-02        (-0.0585729      0.402748)
kT2 [keV]   : 90.2894        (-74.9366      -81.8595)
R2^2/D10^2  : 6.62801E-04    (-0.000365106   0.0130615)
------------------------------------------------------------
#Fit statistic : Chi-Squared =          43.57 using 59 PHA bins.
#Fit statistic : Chi-Squared =          42.70 using 59 PHA bins.
#Fit statistic : Chi-Squared =          42.68 using 59 PHA bins.
# Reduced chi-squared =         0.7922 for     55 degrees of freedom
# Reduced chi-squared =         0.7764 for     55 degrees of freedom
# Reduced chi-squared =         0.7760 for     55 degrees of freedom
# Null hypothesis probability =   8.667661e-01
# Null hypothesis probability =   8.866407e-01
# Null hypothesis probability =   8.870317e-01

Energy  Fluence     90% Error
[keV]   [erg/cm2]   [erg/cm2]
15- 25  4.339e-09   2.628e-09
25- 50  1.640e-08   9.280e-09
50-150  6.957e-08   3.961e-08
15-150  9.031e-08   4.796e-08
Pre-slew spectrum (Pre-slew PHA with pre-slew DRM)
Power-law model

Spectral model in power-law:
------------------------------------------------------------
Parameters  : value       lower 90%   higher 90%
Photon index: 1.05160     ( -0.346065   0.32183 )
Norm@50keV  : 2.57135E-03    ( -0.000438346   0.000434243 )
------------------------------------------------------------
#Fit statistic : Chi-Squared =          54.49 using 59 PHA bins.
# Reduced chi-squared =         0.9559 for     57 degrees of freedom
# Null hypothesis probability =   5.699589e-01

Photon flux (15-150 keV)    in 5.408 sec: 0.297014 ( -0.0520868  0.0522588 ) ph/cm2/s
Energy fluence (15-150 keV)             : 1.47716e-07 ( -2.70461e-08  2.72857e-08 ) ergs/cm2
Cutoff power-law model

Spectral model in the cutoff power-law:
------------------------------------------------------------
Parameters  : value       lower 90%   higher 90%
Photon index: 1.06458     ( -0.381423   0.307443 )
Epeak [keV] : 9999.36      ( -9999.36 -9999.36 )
Norm@50keV  : 2.58936E-03    ( -0.000433958   0.00191433 )
------------------------------------------------------------
#Fit statistic : Chi-Squared =          54.52 using 59 PHA bins.
# Reduced chi-squared =         0.9736 for     56 degrees of freedom
# Null hypothesis probability =   5.310822e-01

Photon flux (15-150 keV)    in 5.408 sec: 0.298545 ( -0.05398  0.050784 ) ph/cm2/s
Energy fluence (15-150 keV)             : 1.48171e-07 ( -2.72682e-08  2.55858e-08 ) ergs/cm2
Band function

Spectral model in the Band function:
------------------------------------------------------------
Parameters  : value       lower 90%   higher 90%
alpha       : -0.898362   ( 0.898319   0.898319 )
beta        : -1.05163    ( -0.321347   0.346184 )
Epeak [keV] : 38.5504      ( -38.5546 -38.5546 )
Norm@50keV   : 4.22007E-03    ( -0.00207828   0 )
------------------------------------------------------------
#Fit statistic : Chi-Squared =          54.49 using 59 PHA bins.
# Reduced chi-squared =         0.9907 for     55 degrees of freedom
# Null hypothesis probability =   4.942053e-01

Photon flux (15-150 keV)    in 5.408 sec:  (    ) ph/cm2/s
Energy fluence (15-150 keV)             : 0 ( 0  0 ) ergs/cm2
S(25-50 keV) vs. S(50-100 keV) plot
S(25-50 keV)  = 2.83e-08
S(50-100 keV) = 5.46e-08
T90 vs. Hardness ratio plot
T90                                   = 4.97599995136261 sec.
Hardness ratio (energy fluence ratio) = 1.92933
Color vs. Color plot

Count Ratio  (25-50 keV) / (15-25 keV) = 1.78594
Count Ratio (50-100 keV) / (15-25 keV) = 1.44097
Mask shadow pattern
IMX = -4.103354961843101E-01, IMY = 6.379121452094097E-02
TIME vs. PHA plot around the trigger time
Blue+Cyan dotted lines: Time interval of the scaled map
From 0.000000 to 0.256000
TIME vs. DetID plot around the trigger time

Blue+Cyan dotted lines: Time interval of the scaled map
From 0.000000 to 0.256000
100 us light curve (15-350 keV)

Blue+Cyan dotted lines: Time interval of the scaled map
From 0.000000 to 0.256000
Spacecraft aspect plot
Bright source in the pre-burst/pre-slew/post-slew images
Pre-burst image of 15-350 keV band
Time interval of the image:
-244.083380 -0.088000

# RAcent  DECcent POSerr Theta    Phi  PeakCts   SNR AngSep     Name
#  [deg]    [deg]    ['] [deg]  [deg]                   [']
157.6604   9.3596    3.3  18.0  139.8   0.6779   3.4 ------	UNKNOWN
197.9386  48.5221    3.6  52.3 -139.4   3.5602   3.2 ------	UNKNOWN
Pre-slew background subtracted image of 15-350 keV band
Time interval of the image:
-0.088000 5.320000

# RAcent  DECcent POSerr Theta    Phi  PeakCts   SNR AngSep     Name
#  [deg]    [deg]    ['] [deg]  [deg]                   [']
168.7143  22.7082    1.0  22.6 -171.2   0.2339  11.2 ------	UNKNOWN
Post-slew image of 15-350 keV band
Time interval of the image:
86.316600 962.096000

# RAcent  DECcent POSerr Theta    Phi  PeakCts   SNR AngSep     Name
#  [deg]    [deg]    ['] [deg]  [deg]                   [']
124.7451  14.3207    2.9  42.4  162.4   0.8753   4.0 ------	UNKNOWN
102.0163  42.6873    4.2  58.0 -156.9   1.8783   2.7 ------	UNKNOWN
Plot creation:
Mon Mar 28 15:51:10 EDT 2016