Click here for the BAT GCN circular template
Image
Pre-slew 15.0-350.0 keV image (Event data)
#   RAcent    DECcent   POSerr    Theta     Phi              Peak Cts       SNR   Name
  183.8196    57.2799   0.0171    17.9582  -102.9766         0.9208755     11.272 TRIG_00678929

Foreground time interval of the image:
 -5.604  44.656 (delta_t =  50.260 [sec])
Background time interval of the image:
-239.275  -5.604 (delta_t = 233.671 [sec])
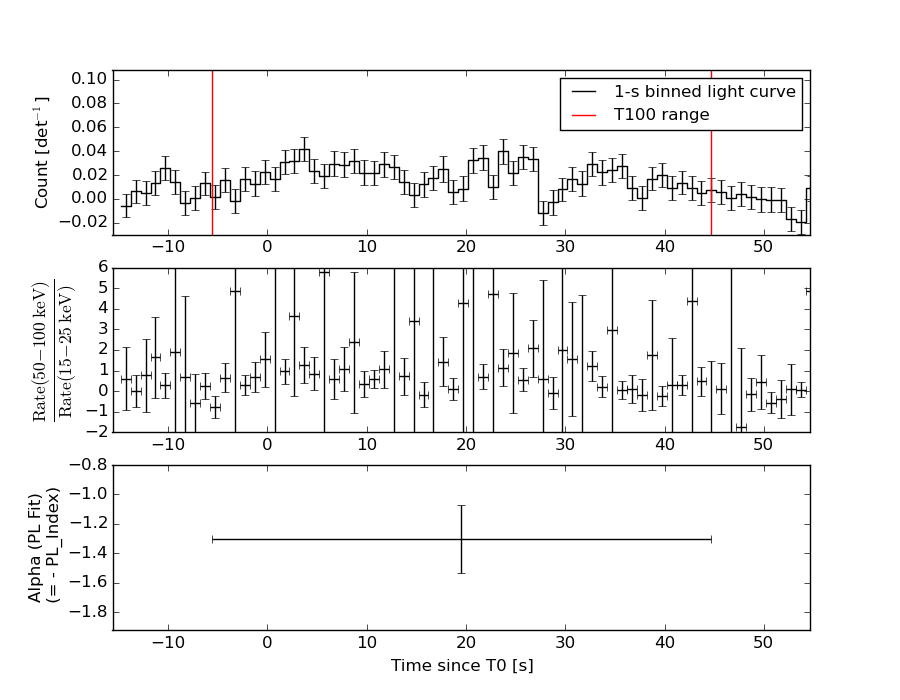
Lightcurves
Notes:
- 1) The mask-weighted light curves are using the flight position.
- 2) Multiple plots of different time binning/intervals are shown to cover all scenarios of short/long GRBs, rate/image triggers, and real/false positives.
- 3) For all the mask-weighted lightcurves, the y-axis units are counts/sec/det where a det is 0.4 x 0.4 = 0.16 sq cm.
- 4) The verticle lines correspond to following: green dotted lines are T50 interval, black dotted lines are T90 interval, blue solid line(s) is a spacecraft slew start time, and orange solid line(s) is a spacecraft slew end time.
- 5) Time of each bin is in the middle of the bin.
1 s binning
From T0-310 s to T0+310 s

From T100_start - 20 s to T100_end + 30 s

Full time interval

64 ms binning
Full time interval
From T100_start to T100_end
From T0-5 sec to T0+5 sec

16 ms binning
From T100_start-5 s to T100_start+5 s

8 ms binning
From T100_start-3 s to T100_start+3 s

2 ms binning
From T100_start-1 s to T100_start+1 s

SN=5 or 10 sec. binning (whichever binning is satisfied first)

SN=5 or 10 sec. binning (T < 200 sec)

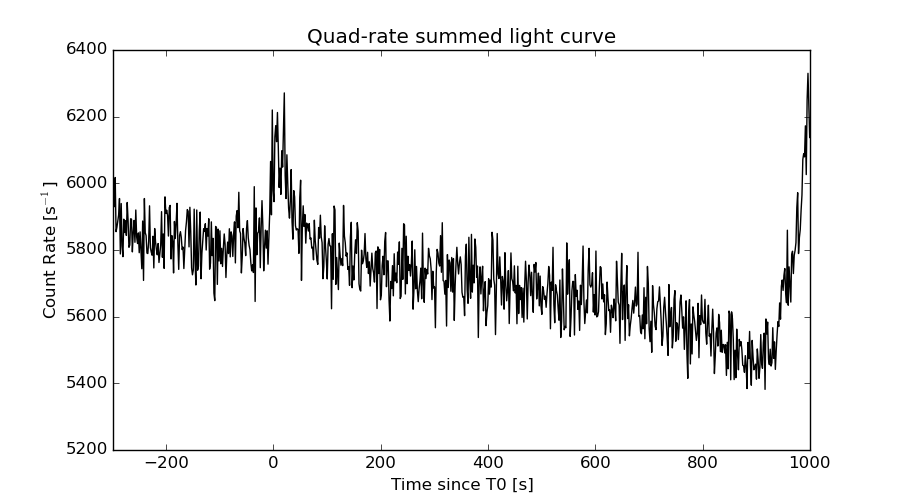
Quad-rate summed light curves (from T0-300s to T0+1000s)
Spectral Evolution
Spectra
Notes:
- 1) The fitting includes the systematic errors.
- 2) When the burst includes telescope slew time periods, the fitting uses an average response file made from multiple 5-s response files through out the slew time plus single time preiod for the non-slew times, and weighted by the total counts in the corresponding time period using addrmf. An average response file is needed becuase a spectral fit using the pre-slew DRM will introduce some errors in both a spectral shape and a normalization if the PHA file contains a lot of the slew/post-slew time interval.
- 3) For fits to more complicated models (e.g. a power-law over a cutoff power-law), the BAT team has decided to require a chi-square improvement of more than 6 for each extra dof.
Time averaged spectrum fit using the average DRM
Power-law model

Time interval is from   -5.604 sec. to   44.656 sec.

Spectral model in power-law:
------------------------------------------------------------
Parameters  : value       lower 90%   higher 90%
Photon index: 1.30371     ( -0.235242   0.233708 )
Norm@50keV  : 1.20329E-03    ( -0.000151628   0.000151411 )
------------------------------------------------------------
#Fit statistic : Chi-Squared =          75.62 using 59 PHA bins.
# Reduced chi-squared =          1.327 for     57 degrees of freedom
# Null hypothesis probability =   5.004063e-02

Photon flux (15-150 keV)    in 50.26 sec: 0.143656 ( -0.018527  0.018599 ) ph/cm2/s
Energy fluence (15-150 keV)             : 5.97149e-07 ( -8.46861e-08  8.5539e-08 ) ergs/cm2
Cutoff power-law model

Time interval is from   -5.604 sec. to   44.656 sec.
Spectral model in the cutoff power-law:
------------------------------------------------------------
Parameters  : value       lower 90%   higher 90%
Photon index: 1.30547     ( -0.63704   0.230038 )
Epeak [keV] : 9999.32      ( -9999.36 -9999.36 )
Norm@50keV  : 1.20549E-03    ( -0.00120792   0.00106483 )
------------------------------------------------------------
#Fit statistic : Chi-Squared =          75.63 using 59 PHA bins.
# Reduced chi-squared =          1.351 for     56 degrees of freedom
# Null hypothesis probability =   4.134737e-02

Photon flux (15-150 keV)    in 50.26 sec: 0.144593 (    ) ph/cm2/s
Energy fluence (15-150 keV)             : 6.00155e-07 ( -1.02724e-07  9.76959e-08 ) ergs/cm2
Band function

Time interval is from   -5.604 sec. to   44.656 sec.

Spectral model in the Band function:
------------------------------------------------------------
Parameters  : value       lower 90%   higher 90%
alpha       : -1.05560   ( 1.05555   1.05555 )
beta        : -1.30370    ( 1.3037   0.235211 )
Epeak [keV] : 39.3965      ( -39.4323 -39.4323 )
Norm@50keV   : 2.27946E-03    ( -0.00122647   305.634 )
------------------------------------------------------------
#Fit statistic : Chi-Squared =          75.62 using 59 PHA bins.
# Reduced chi-squared =          1.375 for     55 degrees of freedom
# Null hypothesis probability =   3.400949e-02

Photon flux (15-150 keV)    in 50.26 sec:  (    ) ph/cm2/s
Energy fluence (15-150 keV)             : 0 ( 0  0 ) ergs/cm2
Single BB

Spectral model blackbody:
------------------------------------------------------------
Parameters  : value    Lower 90%  Upper 90%
kT [keV]    : 19.4484  (-3.38154  4.26308)
R^2/D10^2   : 6.87041E-03  (-0.00326253   0.00608692)
(R is the radius in km and D10 is the distance to the source in units of 10 kpc)
------------------------------------------------------------
#Fit statistic : Chi-Squared =          95.53 using 59 PHA bins.
# Reduced chi-squared =          1.676 for     57 degrees of freedom
# Null hypothesis probability =   1.049800e-03

Energy  Fluence     90% Error
[keV]   [erg/cm2]   [erg/cm2]
15- 25  2.545e-08   7.378e-09
25- 50  1.244e-07   2.905e-08
50-150  3.474e-07   8.587e-08
15-150  4.972e-07   9.559e-08
Thermal bremsstrahlung (OTTB)

Spectral model: thermal bremsstrahlung
------------------------------------------------------------
Parameters  : value         Lower 90%    Upper 90%
kT [keV]    : 200.000       (-48.0066      -200)
Norm        : 0.592479       (-0.0752603     0.0752603)
------------------------------------------------------------
#Fit statistic : Chi-Squared =          80.00 using 59 PHA bins.
# Reduced chi-squared =          1.404 for     57 degrees of freedom
# Null hypothesis probability =   2.392327e-02

Energy  Fluence     90% Error
[keV]   [erg/cm2]   [erg/cm2]
15- 25  7.415e-08   4.199e-08
25- 50  1.426e-07   8.014e-08
50-150  3.128e-07   1.724e-07
15-150  5.296e-07   2.925e-07
Double BB

Spectral model: bbodyrad<1> + bbodyrad<2>
------------------------------------------------------------
Parameters  : value         Lower 90%    Upper 90%
kT1 [keV]   : 4.99326        (-1.76524      2.61278)
R1^2/D10^2  : 0.500716        (-0.402163      3.30126)
kT2 [keV]   : 27.6896        (-6.2426      12.155)
R2^2/D10^2  : 1.97344E-03    (-0.00133266   0.00252568)
------------------------------------------------------------
#Fit statistic : Chi-Squared =          74.04 using 59 PHA bins.
# Reduced chi-squared =          1.346 for     55 degrees of freedom
# Null hypothesis probability =   4.436902e-02

Energy  Fluence     90% Error
[keV]   [erg/cm2]   [erg/cm2]
15- 25  7.335e-08   3.728e-08
25- 50  1.140e-07   4.368e-08
50-150  4.154e-07   1.845e-07
15-150  6.028e-07   2.501e-07
Peak spectrum fit
Power-law model

Time interval is from   24.792 sec. to   25.792 sec.

Spectral model in power-law:
------------------------------------------------------------
Parameters  : value       lower 90%   higher 90%
Photon index: 1.69041     ( -0.703255   0.797865 )
Norm@50keV  : 2.68253E-03    ( -0.00122336   0.00111309 )
------------------------------------------------------------
#Fit statistic : Chi-Squared =          69.01 using 59 PHA bins.
# Reduced chi-squared =          1.211 for     57 degrees of freedom
# Null hypothesis probability =   1.323051e-01

Photon flux (15-150 keV)    in 1 sec: 0.355099 ( -0.131712  0.131752 ) ph/cm2/s
Energy fluence (15-150 keV)             : 2.48599e-08 ( -1.09546e-08  1.16382e-08 ) ergs/cm2
Cutoff power-law model

Time interval is from   24.792 sec. to   25.792 sec.
Spectral model in the cutoff power-law:
------------------------------------------------------------
Parameters  : value       lower 90%   higher 90%
Photon index: 1.69420     ( -1.04221   1.10829 )
Epeak [keV] : 9999.14      ( -9999.34 -9999.35 )
Norm@50keV  : 2.66864E-03    (     )
------------------------------------------------------------
#Fit statistic : Chi-Squared =          69.01 using 59 PHA bins.
# Reduced chi-squared =          1.232 for     56 degrees of freedom
# Null hypothesis probability =   1.137162e-01

Photon flux (15-150 keV)    in 1 sec: 0.355642 ( -0.132468  0.131373 ) ph/cm2/s
Energy fluence (15-150 keV)             : 2.50484e-08 ( -1.18306e-08  8.00529e-09 ) ergs/cm2
Band function

Time interval is from   24.792 sec. to   25.792 sec.

Spectral model in the Band function:
------------------------------------------------------------
Parameters  : value       lower 90%   higher 90%
alpha       : 4.99507   ( -4.99507   -4.99507 )
beta        : -1.75539    ( -1.0158   0.740425 )
Epeak [keV] : 20.6579      ( -20.6579 65.1291 )
Norm@50keV   : 1141.90    ( -420.811   4.47055e+06 )
------------------------------------------------------------
#Fit statistic : Chi-Squared =          68.83 using 59 PHA bins.
# Reduced chi-squared =          1.252 for     55 degrees of freedom
# Null hypothesis probability =   9.946536e-02

Photon flux (15-150 keV)    in 1 sec:  (    ) ph/cm2/s
Energy fluence (15-150 keV)             : 0 ( 0  0 ) ergs/cm2
Single BB

Spectral model blackbody:
------------------------------------------------------------
Parameters  : value    Lower 90%  Upper 90%
kT [keV]    : 12.7182  (-6.18603  10.3363)
R^2/D10^2   : 6.83220E-02  (-0.0665532   0.683784)
(R is the radius in km and D10 is the distance to the source in units of 10 kpc)
------------------------------------------------------------
#Fit statistic : Chi-Squared =          71.93 using 59 PHA bins.
# Reduced chi-squared =          1.262 for     57 degrees of freedom
# Null hypothesis probability =   8.792367e-02

Energy  Fluence     90% Error
[keV]   [erg/cm2]   [erg/cm2]
15- 25  2.344e-09   1.581e-09
25- 50  7.882e-09   5.005e-09
50-150  7.955e-09   5.905e-09
15-150  1.818e-08   1.260e-08
Thermal bremsstrahlung (OTTB)

Spectral model: thermal bremsstrahlung
------------------------------------------------------------
Parameters  : value         Lower 90%    Upper 90%
kT [keV]    : 155.376       (-119.221      -152.344)
Norm        : 1.45312       (-0.558423     1.14819)
------------------------------------------------------------
#Fit statistic : Chi-Squared =          69.22 using 59 PHA bins.
# Reduced chi-squared =          1.214 for     57 degrees of freedom
# Null hypothesis probability =   1.286505e-01

Energy  Fluence     90% Error
[keV]   [erg/cm2]   [erg/cm2]
15- 25  3.721e-09   2.244e-09
25- 50  6.931e-09   4.192e-09
50-150  1.388e-08   9.150e-09
15-150  2.453e-08   1.559e-08
Double BB

Spectral model: bbodyrad<1> + bbodyrad<2>
------------------------------------------------------------
Parameters  : value         Lower 90%    Upper 90%
kT1 [keV]   : 4.44787        (-2.08102      57.3627)
R1^2/D10^2  : 2.49541        (-2.43973      1608.48)
kT2 [keV]   : 21.0193        (-19.5626      -21.0198)
R2^2/D10^2  : 9.52632E-03    (-0.00951256   0.11874)
------------------------------------------------------------
#Fit statistic : Chi-Squared =          68.81 using 59 PHA bins.
# Reduced chi-squared =          1.251 for     55 degrees of freedom
# Null hypothesis probability =   9.985743e-02

Energy  Fluence     90% Error
[keV]   [erg/cm2]   [erg/cm2]
15- 25  4.504e-09   2.815e-09
25- 50  5.883e-09   3.211e-09
50-150  1.350e-08   9.390e-09
15-150  2.389e-08   1.315e-08
Pre-slew spectrum (Pre-slew PHA with pre-slew DRM)
Power-law model

Spectral model in power-law:
------------------------------------------------------------
Parameters  : value       lower 90%   higher 90%
Photon index: 1.30371     ( -0.235242   0.233708 )
Norm@50keV  : 1.20329E-03    ( -0.000151628   0.000151411 )
------------------------------------------------------------
#Fit statistic : Chi-Squared =          75.62 using 59 PHA bins.
# Reduced chi-squared =          1.327 for     57 degrees of freedom
# Null hypothesis probability =   5.004063e-02

Photon flux (15-150 keV)    in 50.26 sec: 0.143654 ( -0.0185262  0.0185979 ) ph/cm2/s
Energy fluence (15-150 keV)             : 5.97089e-07 ( -8.46851e-08  8.55355e-08 ) ergs/cm2
Cutoff power-law model

Spectral model in the cutoff power-law:
------------------------------------------------------------
Parameters  : value       lower 90%   higher 90%
Photon index: 1.30511     ( -0.636682   0.230361 )
Epeak [keV] : 9999.36      ( -9999.36 -9999.36 )
Norm@50keV  : 1.20556E-03    ( -0.00120794   0.00110413 )
------------------------------------------------------------
#Fit statistic : Chi-Squared =          75.63 using 59 PHA bins.
# Reduced chi-squared =          1.351 for     56 degrees of freedom
# Null hypothesis probability =   4.134882e-02

Photon flux (15-150 keV)    in 50.26 sec: 0.143834 ( -0.018775  0.018374 ) ph/cm2/s
Energy fluence (15-150 keV)             : 5.94792e-07 ( -8.25671e-08  8.69649e-08 ) ergs/cm2
Band function

Spectral model in the Band function:
------------------------------------------------------------
Parameters  : value       lower 90%   higher 90%
alpha       : -1.05560   ( 1.05555   1.05555 )
beta        : -1.30370    ( 1.3037   0.235211 )
Epeak [keV] : 39.3965      ( -39.4323 -39.4323 )
Norm@50keV   : 2.27946E-03    ( -0.00122647   19.1704 )
------------------------------------------------------------
#Fit statistic : Chi-Squared =          75.62 using 59 PHA bins.
# Reduced chi-squared =          1.375 for     55 degrees of freedom
# Null hypothesis probability =   3.400949e-02

Photon flux (15-150 keV)    in 50.26 sec:  (    ) ph/cm2/s
Energy fluence (15-150 keV)             : 0 ( 0  0 ) ergs/cm2
S(25-50 keV) vs. S(50-100 keV) plot

S(25-50 keV)  = 1.33e-07
S(50-100 keV) = 2.16e-07
T90 vs. Hardness ratio plot

T90                                   = 41.5359999537468 sec.
Hardness ratio (energy fluence ratio) = 1.62406
Color vs. Color plot
Count Ratio  (25-50 keV) / (15-25 keV) = 1.00249
Count Ratio (50-100 keV) / (15-25 keV) = 1.22493
Mask shadow pattern

IMX = -7.278023838885109E-02, IMY = 3.158355388760571E-01
TIME vs. PHA plot around the trigger time
TIME vs. DetID plot around the trigger time

100 us light curve (15-350 keV)

Spacecraft aspect plot

Bright source in the pre-burst/pre-slew/post-slew images
Pre-burst image of 15-350 keV band
Time interval of the image:
-239.275410 -5.604000

# RAcent  DECcent POSerr Theta    Phi  PeakCts   SNR AngSep     Name
#  [deg]    [deg]    ['] [deg]  [deg]                   [']
107.9321  34.7983    2.2  58.1 -173.9   5.5483   5.3 ------	UNKNOWN
218.1220  41.7978    3.3  26.8  -31.7   0.6596   3.5 ------	UNKNOWN
Pre-slew background subtracted image of 15-350 keV band
Time interval of the image:
-5.604000 44.656000

# RAcent  DECcent POSerr Theta    Phi  PeakCts   SNR AngSep     Name
#  [deg]    [deg]    ['] [deg]  [deg]                   [']
191.2205   3.7359    3.0  36.4   60.7   0.6349   3.9 ------	UNKNOWN
216.1134   3.2927    3.0  47.1   26.5   0.7863   3.9 ------	UNKNOWN
181.3940  41.9576    2.4   2.8 -125.5   0.3481   4.9 ------	UNKNOWN
183.8196  57.2799    1.0  18.0 -103.0   0.9207  11.3 ------	UNKNOWN
242.1888  22.0814    2.1  53.0  -14.4   1.0791   5.4 ------	UNKNOWN
Post-slew image of 15-350 keV band
Time interval of the image:
136.724600 921.924600

# RAcent  DECcent POSerr Theta    Phi  PeakCts   SNR AngSep     Name
#  [deg]    [deg]    ['] [deg]  [deg]                   [']
254.6005  35.2902    9.3  50.9  -18.7   1.1532   1.2    7.7	Her X-1
140.2402  23.4408    3.6  46.0  139.1   5.5155   3.2 ------	UNKNOWN
196.4739  46.0944    2.6  13.6   37.4   1.5921   4.5 ------	UNKNOWN
 95.7499  38.4940    4.9  57.5 -170.4   4.8374   2.4 ------	UNKNOWN
Plot creation:
Mon Mar 28 14:49:37 EDT 2016