Special notes of this burst
Image
Pre-slew 15.0-350.0 keV image (Event data)
#   RAcent    DECcent   POSerr    Theta     Phi              Peak Cts       SNR   Name
  112.7662    17.0235   0.0138    19.6953    61.4634         0.4841346     13.918 TRIG_00679120

Foreground time interval of the image:
 -0.036   9.312 (delta_t =   9.348 [sec])
Background time interval of the image:
-239.776  -0.036 (delta_t = 239.740 [sec])
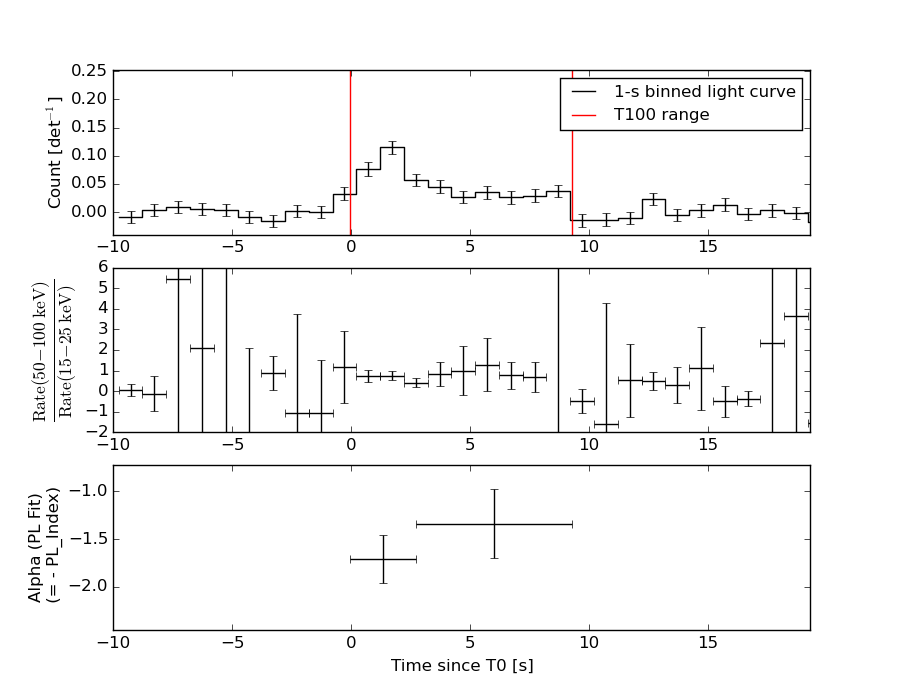
Lightcurves
Notes:
- 1) The mask-weighted light curves are using the flight position.
- 2) Multiple plots of different time binning/intervals are shown to cover all scenarios of short/long GRBs, rate/image triggers, and real/false positives.
- 3) For all the mask-weighted lightcurves, the y-axis units are counts/sec/det where a det is 0.4 x 0.4 = 0.16 sq cm.
- 4) The verticle lines correspond to following: green dotted lines are T50 interval, black dotted lines are T90 interval, blue solid line(s) is a spacecraft slew start time, and orange solid line(s) is a spacecraft slew end time.
- 5) Time of each bin is in the middle of the bin.
1 s binning
From T0-310 s to T0+310 s

From T100_start - 20 s to T100_end + 30 s
Full time interval
64 ms binning
Full time interval

From T100_start to T100_end

From T0-5 sec to T0+5 sec

16 ms binning
From T100_start-5 s to T100_start+5 s
Blue+Cyan dotted lines: Time interval of the scaled map
From 0.000000 to 2.048000
8 ms binning
From T100_start-3 s to T100_start+3 s
Blue+Cyan dotted lines: Time interval of the scaled map
From 0.000000 to 2.048000
2 ms binning
From T100_start-1 s to T100_start+1 s

Blue+Cyan dotted lines: Time interval of the scaled map
From 0.000000 to 2.048000
SN=5 or 10 sec. binning (whichever binning is satisfied first)
SN=5 or 10 sec. binning (T < 200 sec)

Quad-rate summed light curves (from T0-300s to T0+1000s)

Spectral Evolution
Spectra
Notes:
- 1) The fitting includes the systematic errors.
- 2) When the burst includes telescope slew time periods, the fitting uses an average response file made from multiple 5-s response files through out the slew time plus single time preiod for the non-slew times, and weighted by the total counts in the corresponding time period using addrmf. An average response file is needed becuase a spectral fit using the pre-slew DRM will introduce some errors in both a spectral shape and a normalization if the PHA file contains a lot of the slew/post-slew time interval.
- 3) For fits to more complicated models (e.g. a power-law over a cutoff power-law), the BAT team has decided to require a chi-square improvement of more than 6 for each extra dof.
Time averaged spectrum fit using the average DRM
Power-law model

Time interval is from   -0.036 sec. to    9.312 sec.

Spectral model in power-law:
------------------------------------------------------------
Parameters  : value       lower 90%   higher 90%
Photon index: 1.52836     ( -0.219949   0.222498 )
Norm@50keV  : 3.11909E-03    ( -0.00040331   0.000398262 )
------------------------------------------------------------
#Fit statistic : Chi-Squared =          62.83 using 59 PHA bins.
# Reduced chi-squared =          1.102 for     57 degrees of freedom
# Null hypothesis probability =   2.773965e-01

Photon flux (15-150 keV)    in 9.348 sec: 0.392441 ( -0.04844  0.048497 ) ph/cm2/s
Energy fluence (15-150 keV)             : 2.75403e-07 ( -3.89101e-08  3.94866e-08 ) ergs/cm2
Cutoff power-law model
Time interval is from   -0.036 sec. to    9.312 sec.
Spectral model in the cutoff power-law:
------------------------------------------------------------
Parameters  : value       lower 90%   higher 90%
Photon index: 1.52962     ( -0.22448   0.220702 )
Epeak [keV] : 9999.36      ( -9999.36 -9999.36 )
Norm@50keV  : 3.12120E-03    ( -0.00225277   0.00435825 )
------------------------------------------------------------
#Fit statistic : Chi-Squared =          62.84 using 59 PHA bins.
# Reduced chi-squared =          1.122 for     56 degrees of freedom
# Null hypothesis probability =   2.470212e-01

Photon flux (15-150 keV)    in 9.348 sec: 0.393417 ( -0.051805  0.049339 ) ph/cm2/s
Energy fluence (15-150 keV)             : 2.77958e-07 ( 0  0 ) ergs/cm2
Band function
Time interval is from   -0.036 sec. to    9.312 sec.

Spectral model in the Band function:
------------------------------------------------------------
Parameters  : value       lower 90%   higher 90%
alpha       : 4.97190   ( -4.9719   -4.9719 )
beta        : -1.58003    ( -0.254135   0.238444 )
Epeak [keV] : 21.4774      ( -21.4774 7.3369 )
Norm@50keV   : 837.881    ( -101.843   1.82197e+06 )
------------------------------------------------------------
#Fit statistic : Chi-Squared =          62.34 using 59 PHA bins.
# Reduced chi-squared =          1.134 for     55 degrees of freedom
# Null hypothesis probability =   2.314260e-01

Photon flux (15-150 keV)    in 9.348 sec:  (    ) ph/cm2/s
Energy fluence (15-150 keV)             : 0 ( 0  0 ) ergs/cm2
Single BB
Spectral model blackbody:
------------------------------------------------------------
Parameters  : value    Lower 90%  Upper 90%
kT [keV]    : 13.5626  (-2.08787  2.57008)
R^2/D10^2   : 6.17573E-02  (-0.0284018   0.0505913)
(R is the radius in km and D10 is the distance to the source in units of 10 kpc)
------------------------------------------------------------
#Fit statistic : Chi-Squared =          82.14 using 59 PHA bins.
# Reduced chi-squared =          1.441 for     57 degrees of freedom
# Null hypothesis probability =   1.629103e-02

Energy  Fluence     90% Error
[keV]   [erg/cm2]   [erg/cm2]
15- 25  2.249e-08   5.623e-09
25- 50  8.099e-08   1.446e-08
50-150  9.646e-08   2.703e-08
15-150  1.999e-07   3.706e-08
Thermal bremsstrahlung (OTTB)

Spectral model: thermal bremsstrahlung
------------------------------------------------------------
Parameters  : value         Lower 90%    Upper 90%
kT [keV]    : 199.351       (-86.991      -199.361)
Norm        : 1.59786       (-0.194803     0.195005)
------------------------------------------------------------
#Fit statistic : Chi-Squared =          63.56 using 59 PHA bins.
# Reduced chi-squared =          1.115 for     57 degrees of freedom
# Null hypothesis probability =   2.564213e-01

Energy  Fluence     90% Error
[keV]   [erg/cm2]   [erg/cm2]
15- 25  3.719e-08   2.108e-08
25- 50  7.155e-08   3.928e-08
50-150  1.569e-07   8.638e-08
15-150  2.657e-07   1.467e-07
Double BB

------------------------------------------------------------
Parameters  : value         Lower 90%    Upper 90%
kT1 [keV]   : 9.78542        (-4.6981      2.43947)
R1^2/D10^2  : 0.170749        (-0.105674      1.74539)
kT2 [keV]   : 200.000        (-200      -200)
R2^2/D10^2  : 5.30237E-05    (-1.64161e-05   0.00019818)
------------------------------------------------------------
#Fit statistic : Chi-Squared =          64.03 using 59 PHA bins.
#Fit statistic : Chi-Squared =          63.99 using 59 PHA bins.
# Reduced chi-squared =          1.164 for     55 degrees of freedom
# Reduced chi-squared =          1.163 for     55 degrees of freedom
# Null hypothesis probability =   1.893062e-01
# Null hypothesis probability =   1.902679e-01

Energy  Fluence     90% Error
[keV]   [erg/cm2]   [erg/cm2]
15- 25  3.279e-08   1.257e-08
25- 50  7.845e-08   3.157e-08
50-150  1.701e-07   1.090e-07
15-150  2.813e-07   1.547e-07
Peak spectrum fit
Power-law model
Time interval is from    1.120 sec. to    2.120 sec.

Spectral model in power-law:
------------------------------------------------------------
Parameters  : value       lower 90%   higher 90%
Photon index: 1.50511     ( -0.327818   0.325436 )
Norm@50keV  : 7.26617E-03    ( -0.00128593   0.00125803 )
------------------------------------------------------------
#Fit statistic : Chi-Squared =          68.97 using 59 PHA bins.
# Reduced chi-squared =          1.210 for     57 degrees of freedom
# Null hypothesis probability =   1.329721e-01

Photon flux (15-150 keV)    in 1 sec: 0.908380 ( -0.153933  0.15404 ) ph/cm2/s
Energy fluence (15-150 keV)             : 6.88811e-08 ( -1.34006e-08  1.36428e-08 ) ergs/cm2
Cutoff power-law model

Time interval is from    1.120 sec. to    2.120 sec.
Spectral model in the cutoff power-law:
------------------------------------------------------------
Parameters  : value       lower 90%   higher 90%
Photon index: 1.50428     ( -0.45031   0.303865 )
Epeak [keV] : 1.00000E+04      ( -10000 -10000 )
Norm@50keV  : 7.28521E-03    ( -0.00129489   -0.00728523 )
------------------------------------------------------------
#Fit statistic : Chi-Squared =          68.99 using 59 PHA bins.
# Reduced chi-squared =          1.232 for     56 degrees of freedom
# Null hypothesis probability =   1.140564e-01

Photon flux (15-150 keV)    in 1 sec: 0.918153 ( -0.159414  0.146057 ) ph/cm2/s
Energy fluence (15-150 keV)             : 3.83469e-08 ( -1.50172e-08  1.13856e-08 ) ergs/cm2
Band function
Time interval is from    1.120 sec. to    2.120 sec.

Spectral model in the Band function:
------------------------------------------------------------
Parameters  : value       lower 90%   higher 90%
alpha       : 4.89992   ( -4.89992   -4.89992 )
beta        : -1.59707    ( -0.454866   0.36653 )
Epeak [keV] : 22.9660      ( -22.966 7.15583 )
Norm@50keV   : 1128.74    ( -186.918   4.66238e+06 )
------------------------------------------------------------
#Fit statistic : Chi-Squared =          68.32 using 59 PHA bins.
# Reduced chi-squared =          1.242 for     55 degrees of freedom
# Null hypothesis probability =   1.071050e-01

Photon flux (15-150 keV)    in 1 sec:  (    ) ph/cm2/s
Energy fluence (15-150 keV)             : 0 ( 0  0 ) ergs/cm2
Single BB
Spectral model blackbody:
------------------------------------------------------------
Parameters  : value    Lower 90%  Upper 90%
kT [keV]    : 10.6406  (-2.6356  4.79223)
R^2/D10^2   : 0.324024  (-0.319017   0.612601)
(R is the radius in km and D10 is the distance to the source in units of 10 kpc)
------------------------------------------------------------
#Fit statistic : Chi-Squared =          88.70 using 59 PHA bins.
# Reduced chi-squared =          1.556 for     57 degrees of freedom
# Null hypothesis probability =   4.548511e-03

Energy  Fluence     90% Error
[keV]   [erg/cm2]   [erg/cm2]
15- 25  7.609e-09   2.961e-09
25- 50  2.060e-08   5.235e-09
50-150  1.283e-08   6.201e-09
15-150  4.104e-08   1.265e-08
Thermal bremsstrahlung (OTTB)
Spectral model: thermal bremsstrahlung
------------------------------------------------------------
Parameters  : value         Lower 90%    Upper 90%
kT [keV]    : 199.360       (-99.5538      -199.362)
Norm        : 3.68005       (-0.617403     0.618369)
------------------------------------------------------------
#Fit statistic : Chi-Squared =          70.98 using 59 PHA bins.
# Reduced chi-squared =          1.245 for     57 degrees of freedom
# Null hypothesis probability =   1.008490e-01

Energy  Fluence     90% Error
[keV]   [erg/cm2]   [erg/cm2]
15- 25  9.164e-09   5.260e-09
25- 50  1.763e-08   1.008e-08
50-150  3.866e-08   2.168e-08
15-150  6.545e-08   3.633e-08
Double BB
------------------------------------------------------------
Parameters  : value         Lower 90%    Upper 90%
kT1 [keV]   : 7.28606        (-1.41282      2.0277)
R1^2/D10^2  : 1.17908        (-0.843034      1.79642)
kT2 [keV]   : 200.000        (-157.351      -200)
R2^2/D10^2  : 1.72897E-04    (-4.89409e-05   4.89213e-05)
------------------------------------------------------------
#Fit statistic : Chi-Squared =          60.35 using 59 PHA bins.
#Fit statistic : Chi-Squared =          60.03 using 59 PHA bins.
# Reduced chi-squared =          1.097 for     55 degrees of freedom
# Reduced chi-squared =          1.091 for     55 degrees of freedom
# Null hypothesis probability =   2.885476e-01
# Null hypothesis probability =   2.985407e-01

Energy  Fluence     90% Error
[keV]   [erg/cm2]   [erg/cm2]
15- 25  1.080e-08   5.169e-09
25- 50  1.704e-08   9.035e-09
50-150  5.009e-08   4.745e-08
15-150  7.792e-08   5.645e-08
Pre-slew spectrum (Pre-slew PHA with pre-slew DRM)
Power-law model
Spectral model in power-law:
------------------------------------------------------------
Parameters  : value       lower 90%   higher 90%
Photon index: 1.52836     ( -0.219949   0.222498 )
Norm@50keV  : 3.11909E-03    ( -0.00040331   0.000398262 )
------------------------------------------------------------
#Fit statistic : Chi-Squared =          62.83 using 59 PHA bins.
# Reduced chi-squared =          1.102 for     57 degrees of freedom
# Null hypothesis probability =   2.773965e-01

Photon flux (15-150 keV)    in 9.348 sec: 0.392430 ( -0.048438  0.048494 ) ph/cm2/s
Energy fluence (15-150 keV)             : 2.75365e-07 ( -3.89035e-08  3.9493e-08 ) ergs/cm2
Cutoff power-law model

Spectral model in the cutoff power-law:
------------------------------------------------------------
Parameters  : value       lower 90%   higher 90%
Photon index: 1.53352     ( -0.226337   0.219131 )
Epeak [keV] : 9999.36      ( -9999.36 -9999.36 )
Norm@50keV  : 3.11690E-03    (     )
------------------------------------------------------------
#Fit statistic : Chi-Squared =          62.84 using 59 PHA bins.
# Reduced chi-squared =          1.122 for     56 degrees of freedom
# Null hypothesis probability =   2.470200e-01

Photon flux (15-150 keV)    in 9.348 sec: 0.392391 ( -0.048446  0.048377 ) ph/cm2/s
Energy fluence (15-150 keV)             : 2.75022e-07 ( -4.03806e-08  3.92186e-08 ) ergs/cm2
Band function

Spectral model in the Band function:
------------------------------------------------------------
Parameters  : value       lower 90%   higher 90%
alpha       : 4.97190   ( -4.9719   -4.9719 )
beta        : -1.58003    ( -0.254135   0.238444 )
Epeak [keV] : 21.4774      ( -21.4774 7.3369 )
Norm@50keV   : 837.881    ( -101.843   1.82197e+06 )
------------------------------------------------------------
#Fit statistic : Chi-Squared =          62.34 using 59 PHA bins.
# Reduced chi-squared =          1.134 for     55 degrees of freedom
# Null hypothesis probability =   2.314260e-01

Photon flux (15-150 keV)    in 9.348 sec:  (    ) ph/cm2/s
Energy fluence (15-150 keV)             : 0 ( 0  0 ) ergs/cm2
S(25-50 keV) vs. S(50-100 keV) plot

S(25-50 keV)  = 6.91e-08
S(50-100 keV) = 9.53e-08
T90 vs. Hardness ratio plot

T90                                   = 8.73199993371964 sec.
Hardness ratio (energy fluence ratio) = 1.37916
Color vs. Color plot

Count Ratio  (25-50 keV) / (15-25 keV) = 1.18425
Count Ratio (50-100 keV) / (15-25 keV) = 0.826361
Mask shadow pattern
IMX = 1.710043101406890E-01, IMY = -3.144712058619749E-01
TIME vs. PHA plot around the trigger time
Blue+Cyan dotted lines: Time interval of the scaled map
From 0.000000 to 2.048000
TIME vs. DetID plot around the trigger time

Blue+Cyan dotted lines: Time interval of the scaled map
From 0.000000 to 2.048000
100 us light curve (15-350 keV)
Blue+Cyan dotted lines: Time interval of the scaled map
From 0.000000 to 2.048000
Spacecraft aspect plot
Bright source in the pre-burst/pre-slew/post-slew images
Pre-burst image of 15-350 keV band
Time interval of the image:
-239.776000 -0.036000

# RAcent  DECcent POSerr Theta    Phi  PeakCts   SNR AngSep     Name
#  [deg]    [deg]    ['] [deg]  [deg]                   [']
 83.6283  22.0218    0.2  16.4  -40.1   9.9195  50.9    0.5	Crab
 83.1061 -29.1693    3.0  39.8 -167.8   1.1021   3.9 ------	UNKNOWN
 83.3661  58.2979    3.5  49.9  -10.5   1.3281   3.3 ------	UNKNOWN
 55.3358  27.5867    3.6  41.0  -61.1   1.9809   3.2 ------	UNKNOWN
Pre-slew background subtracted image of 15-350 keV band
Time interval of the image:
-0.036000 9.312000

# RAcent  DECcent POSerr Theta    Phi  PeakCts   SNR AngSep     Name
#  [deg]    [deg]    ['] [deg]  [deg]                   [']
 83.7129  21.8682    4.2  16.2  -40.3   0.0792   2.8    9.8	Crab
112.7662  17.0234    0.8  19.7   61.5   0.4840  13.9 ------	UNKNOWN
 96.3594 -34.1500    2.5  43.3  174.4   0.2424   4.6 ------	UNKNOWN
Post-slew image of 15-350 keV band
Time interval of the image:
75.124610 962.291800

# RAcent  DECcent POSerr Theta    Phi  PeakCts   SNR AngSep     Name
#  [deg]    [deg]    ['] [deg]  [deg]                   [']
 83.6329  22.0212    0.2  27.9  -81.2  36.8827  49.2    0.4	Crab
147.4921  38.4268    3.5  37.1   41.5   3.1207   3.3 ------	UNKNOWN
129.7179  61.5494    2.7  46.1    4.9   4.2964   4.2 ------	UNKNOWN
110.7459 -10.8022    2.9  27.9  178.0   2.4764   3.9 ------	UNKNOWN
114.1220  52.0780    2.9  35.1   -4.8   2.5420   3.9 ------	UNKNOWN
 97.5733  -3.2984    3.0  25.2 -148.4   2.0208   3.8 ------	UNKNOWN
Plot creation:
Mon Mar 28 14:47:30 EDT 2016