Click here for the BAT GCN circular template
Image
Pre-slew 15.0-350.0 keV image (Event data)

# RAcent DECcent POSerr Theta Phi Peak Cts SNR Name
99.4212 5.7527 0.0126 17.2182 -141.8376 1.1024749 15.294 TRIG_00680017
Foreground time interval of the image:
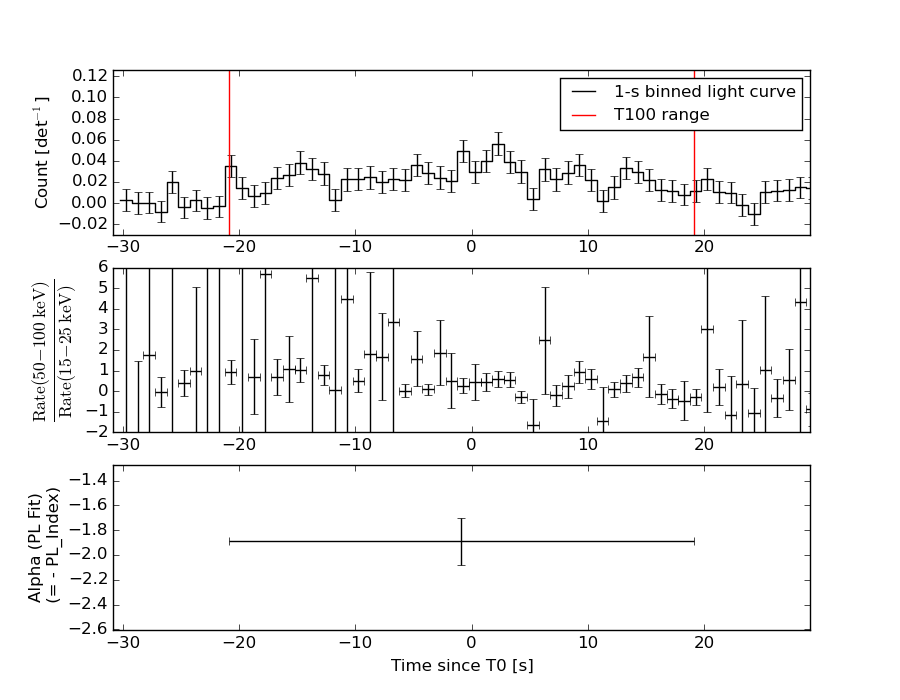
-20.884 19.100 (delta_t = 39.984 [sec])
Background time interval of the image:
-239.232 -20.884 (delta_t = 218.348 [sec])
Lightcurves
Notes:
- 1) The mask-weighted light curves are using the flight position.
- 2) Multiple plots of different time binning/intervals are shown to cover all scenarios of short/long GRBs, rate/image triggers, and real/false positives.
- 3) For all the mask-weighted lightcurves, the y-axis units are counts/sec/det where a det is 0.4 x 0.4 = 0.16 sq cm.
- 4) The verticle lines correspond to following: green dotted lines are T50 interval, black dotted lines are T90 interval, blue solid line(s) is a spacecraft slew start time, and orange solid line(s) is a spacecraft slew end time.
- 5) Time of each bin is in the middle of the bin.
1 s binning
From T0-310 s to T0+310 s
From T100_start - 20 s to T100_end + 30 s
Full time interval
64 ms binning
Full time interval
From T100_start to T100_end

From T0-5 sec to T0+5 sec
16 ms binning
From T100_start-5 s to T100_start+5 s

Blue+Cyan dotted lines: Time interval of the scaled map
From 0.000000 to 8.192000
8 ms binning
From T100_start-3 s to T100_start+3 s
Blue+Cyan dotted lines: Time interval of the scaled map
From 0.000000 to 8.192000
2 ms binning
From T100_start-1 s to T100_start+1 s
Blue+Cyan dotted lines: Time interval of the scaled map
From 0.000000 to 8.192000
SN=5 or 10 sec. binning (whichever binning is satisfied first)
SN=5 or 10 sec. binning (T < 200 sec)
Quad-rate summed light curves (from T0-300s to T0+1000s)

Spectral Evolution
Spectra
Notes:
- 1) The fitting includes the systematic errors.
- 2) When the burst includes telescope slew time periods, the fitting uses an average response file made from multiple 5-s response files through out the slew time plus single time preiod for the non-slew times, and weighted by the total counts in the corresponding time period using addrmf. An average response file is needed becuase a spectral fit using the pre-slew DRM will introduce some errors in both a spectral shape and a normalization if the PHA file contains a lot of the slew/post-slew time interval.
- 3) For fits to more complicated models (e.g. a power-law over a cutoff power-law), the BAT team has decided to require a chi-square improvement of more than 6 for each extra dof.
Time averaged spectrum fit using the average DRM
Power-law model

Time interval is from  -20.884 sec. to   19.100 sec.

Spectral model in power-law:
------------------------------------------------------------
Parameters  : value       lower 90%   higher 90%
Photon index: 1.88831     ( -0.186858   0.196075 )
Norm@50keV  : 1.46141E-03    ( -0.000190173   0.000186354 )
------------------------------------------------------------
#Fit statistic : Chi-Squared =          52.84 using 59 PHA bins.
# Reduced chi-squared =         0.9269 for     57 degrees of freedom
# Null hypothesis probability =   6.319662e-01

Photon flux (15-150 keV)    in 39.98 sec: 0.208707 ( -0.021286  0.021287 ) ph/cm2/s
Energy fluence (15-150 keV)             : 5.37207e-07 ( -6.80128e-08  6.97983e-08 ) ergs/cm2
Cutoff power-law model

Time interval is from  -20.884 sec. to   19.100 sec.
Spectral model in the cutoff power-law:
------------------------------------------------------------
Parameters  : value       lower 90%   higher 90%
Photon index: 1.14517     ( -0.982405   0.772679 )
Epeak [keV] : 46.7941      ( -13.5 -46.7941 )
Norm@50keV  : 3.99099E-03    ( -0.00255057   0.0113853 )
------------------------------------------------------------
#Fit statistic : Chi-Squared =          50.16 using 59 PHA bins.
# Reduced chi-squared =         0.8957 for     56 degrees of freedom
# Null hypothesis probability =   6.944532e-01

Photon flux (15-150 keV)    in 39.98 sec: 0.202712 ( -0.022049  0.022111 ) ph/cm2/s
Energy fluence (15-150 keV)             : 4.91886e-07 ( -7.67092e-08  8.27102e-08 ) ergs/cm2
Band function
Time interval is from  -20.884 sec. to   19.100 sec.

Spectral model in the Band function:
------------------------------------------------------------
Parameters  : value       lower 90%   higher 90%
alpha       : 0.136889   ( -3.60857   -0.673426 )
beta        : -2.21139    ( 2.21243   0.385622 )
Epeak [keV] : 33.1303      ( -12.6177 43.9873 )
Norm@50keV   : 3.28712E-02    ( -0.0323166   104.091 )
------------------------------------------------------------
#Fit statistic : Chi-Squared =          49.66 using 59 PHA bins.
# Reduced chi-squared =         0.9029 for     55 degrees of freedom
# Null hypothesis probability =   6.781675e-01

Photon flux (15-150 keV)    in 39.98 sec:  (    ) ph/cm2/s
Energy fluence (15-150 keV)             : 0 ( 0  0 ) ergs/cm2
Single BB

Spectral model blackbody:
------------------------------------------------------------
Parameters  : value    Lower 90%  Upper 90%
kT [keV]    : 9.91351  (-1.14472  1.32893)
R^2/D10^2   : 0.101605  (-0.0385259   0.0603171)
(R is the radius in km and D10 is the distance to the source in units of 10 kpc)
------------------------------------------------------------
#Fit statistic : Chi-Squared =          63.95 using 59 PHA bins.
# Reduced chi-squared =          1.122 for     57 degrees of freedom
# Null hypothesis probability =   2.456252e-01

Energy  Fluence     90% Error
[keV]   [erg/cm2]   [erg/cm2]
15- 25  8.106e-08   1.543e-08
25- 50  1.991e-07   2.653e-08
50-150  1.013e-07   2.743e-08
15-150  3.814e-07   4.942e-08
Thermal bremsstrahlung (OTTB)
Spectral model: thermal bremsstrahlung
------------------------------------------------------------
Parameters  : value         Lower 90%    Upper 90%
kT [keV]    : 75.8587       (-22.301      39.2732)
Norm        : 1.00044       (-0.147345     0.181996)
------------------------------------------------------------
#Fit statistic : Chi-Squared =          50.23 using 59 PHA bins.
# Reduced chi-squared =         0.8813 for     57 degrees of freedom
# Null hypothesis probability =   7.249709e-01

Energy  Fluence     90% Error
[keV]   [erg/cm2]   [erg/cm2]
15- 25  1.034e-07   1.443e-08
25- 50  1.680e-07   1.985e-08
50-150  2.286e-07   9.969e-08
15-150  5.000e-07   9.375e-08
Double BB
Spectral model: bbodyrad<1> + bbodyrad<2>
------------------------------------------------------------
Parameters  : value         Lower 90%    Upper 90%
kT1 [keV]   : 6.47926        (-1.98383      1.88122)
R1^2/D10^2  : 0.355543        (-0.197919      0.833685)
kT2 [keV]   : 20.6046        (-6.87118      18.2613)
R2^2/D10^2  : 4.15716E-03    (-0.00373707   0.00794911)
------------------------------------------------------------
#Fit statistic : Chi-Squared =          49.37 using 59 PHA bins.
# Reduced chi-squared =         0.8977 for     55 degrees of freedom
# Null hypothesis probability =   6.886266e-01

Energy  Fluence     90% Error
[keV]   [erg/cm2]   [erg/cm2]
15- 25  1.013e-07   4.945e-08
25- 50  1.713e-07   7.476e-08
50-150  2.284e-07   1.334e-07
15-150  5.010e-07   2.259e-07
Peak spectrum fit
Power-law model
Time interval is from    1.796 sec. to    2.796 sec.

Spectral model in power-law:
------------------------------------------------------------
Parameters  : value       lower 90%   higher 90%
Photon index: 1.65862     ( -0.592658   0.628491 )
Norm@50keV  : 3.25115E-03    ( -0.00121527   0.00112766 )
------------------------------------------------------------
#Fit statistic : Chi-Squared =          48.98 using 59 PHA bins.
# Reduced chi-squared =         0.8592 for     57 degrees of freedom
# Null hypothesis probability =   7.663193e-01

Photon flux (15-150 keV)    in 1 sec: 0.425751 ( -0.12955  0.129556 ) ph/cm2/s
Energy fluence (15-150 keV)             : 3.02155e-08 ( -1.12751e-08  1.20504e-08 ) ergs/cm2
Cutoff power-law model
Time interval is from    1.796 sec. to    2.796 sec.
Spectral model in the cutoff power-law:
------------------------------------------------------------
Parameters  : value       lower 90%   higher 90%
Photon index: 2.47593     ( -0.607131   0.618761 )
Epeak [keV] : 161.504      ( -9999.35 -9999.36 )
Norm@50keV  : 1.20977E-03    ( -0.00121349   0.0343154 )
------------------------------------------------------------
#Fit statistic : Chi-Squared =          48.79 using 59 PHA bins.
# Reduced chi-squared =         0.8712 for     56 degrees of freedom
# Null hypothesis probability =   7.419215e-01

Photon flux (15-150 keV)    in 1 sec: 0.426517 ( -0.130771  0.128842 ) ph/cm2/s
Energy fluence (15-150 keV)             : 2.1746e-08 ( -1.33601e-08  7.09432e-09 ) ergs/cm2
Band function
Time interval is from    1.796 sec. to    2.796 sec.

Spectral model in the Band function:
------------------------------------------------------------
Parameters  : value       lower 90%   higher 90%
alpha       : 5.00000   ( -5   -5 )
beta        : -1.92442    ( -1.52896   0.742839 )
Epeak [keV] : 24.6252      ( -24.6221 9.45045 )
Norm@50keV   : 478.362    ( -143.994   3.77228e+06 )
------------------------------------------------------------
#Fit statistic : Chi-Squared =          48.19 using 59 PHA bins.
# Reduced chi-squared =         0.8761 for     55 degrees of freedom
# Null hypothesis probability =   7.305285e-01

Photon flux (15-150 keV)    in 1 sec:  (    ) ph/cm2/s
Energy fluence (15-150 keV)             : 0 ( 0  0 ) ergs/cm2
Single BB

Spectral model blackbody:
------------------------------------------------------------
Parameters  : value    Lower 90%  Upper 90%
kT [keV]    : 8.45748  (-2.72171  5.43483)
R^2/D10^2   : 0.364287  (-0.363133   1.25551)
(R is the radius in km and D10 is the distance to the source in units of 10 kpc)
------------------------------------------------------------
#Fit statistic : Chi-Squared =          52.96 using 59 PHA bins.
# Reduced chi-squared =         0.9292 for     57 degrees of freedom
# Null hypothesis probability =   6.272133e-01

Energy  Fluence     90% Error
[keV]   [erg/cm2]   [erg/cm2]
15- 25  4.895e-09   2.921e-09
25- 50  9.415e-09   6.130e-09
50-150  2.959e-09   2.437e-09
15-150  1.727e-08   1.087e-08
Thermal bremsstrahlung (OTTB)
Spectral model: thermal bremsstrahlung
------------------------------------------------------------
Parameters  : value         Lower 90%    Upper 90%
kT [keV]    : 149.995       (-117.315      -154.894)
Norm        : 1.73267       (-0.553402     1.09292)
------------------------------------------------------------
#Fit statistic : Chi-Squared =          49.49 using 59 PHA bins.
# Reduced chi-squared =         0.8683 for     57 degrees of freedom
# Null hypothesis probability =   7.496081e-01

Energy  Fluence     90% Error
[keV]   [erg/cm2]   [erg/cm2]
15- 25  4.306e-09   2.722e-09
25- 50  8.230e-09   4.913e-09
50-150  1.772e-08   1.089e-08
15-150  3.025e-08   1.794e-08
Double BB

Spectral model: bbodyrad<1> + bbodyrad<2>
------------------------------------------------------------
Parameters  : value         Lower 90%    Upper 90%
kT1 [keV]   : 6.53503        (-2.19308      2.89075)
R1^2/D10^2  : 0.848464        (-0.66744      2.88147)
kT2 [keV]   : 69.8238        (-69.9683      -69.9684)
R2^2/D10^2  : 4.28923E-04    (-0.000394333   0.00533262)
------------------------------------------------------------
#Fit statistic : Chi-Squared =          46.14 using 59 PHA bins.
# Reduced chi-squared =         0.8389 for     55 degrees of freedom
# Null hypothesis probability =   7.968972e-01

Energy  Fluence     90% Error
[keV]   [erg/cm2]   [erg/cm2]
15- 25  5.563e-09   3.428e-09
25- 50  7.776e-09   4.560e-09
50-150  2.235e-08   1.321e-08
15-150  3.569e-08   1.916e-08
Pre-slew spectrum (Pre-slew PHA with pre-slew DRM)
Power-law model
Spectral model in power-law:
------------------------------------------------------------
Parameters  : value       lower 90%   higher 90%
Photon index: 1.88831     ( -0.186858   0.196075 )
Norm@50keV  : 1.46141E-03    ( -0.000190173   0.000186354 )
------------------------------------------------------------
#Fit statistic : Chi-Squared =          52.84 using 59 PHA bins.
# Reduced chi-squared =         0.9269 for     57 degrees of freedom
# Null hypothesis probability =   6.319662e-01

Photon flux (15-150 keV)    in 39.98 sec: 0.208695 ( -0.0212848  0.0212849 ) ph/cm2/s
Energy fluence (15-150 keV)             : 5.37127e-07 ( -6.7978e-08  6.98067e-08 ) ergs/cm2
Cutoff power-law model
Spectral model in the cutoff power-law:
------------------------------------------------------------
Parameters  : value       lower 90%   higher 90%
Photon index: 1.14519     ( -0.982409   0.772677 )
Epeak [keV] : 46.7943      ( -13.5001 -46.7941 )
Norm@50keV  : 3.99088E-03    ( -0.00255055   0.0113853 )
------------------------------------------------------------
#Fit statistic : Chi-Squared =          50.16 using 59 PHA bins.
# Reduced chi-squared =         0.8957 for     56 degrees of freedom
# Null hypothesis probability =   6.944532e-01

Photon flux (15-150 keV)    in 39.98 sec: 0.202675 ( -0.022042  0.022103 ) ph/cm2/s
Energy fluence (15-150 keV)             : 4.9201e-07 ( -7.67736e-08  8.27466e-08 ) ergs/cm2
Band function

Spectral model in the Band function:
------------------------------------------------------------
Parameters  : value       lower 90%   higher 90%
alpha       : 0.136846   ( -3.61613   -0.673206 )
beta        : -2.21138    ( 2.21243   0.385624 )
Epeak [keV] : 33.1304      ( -12.6178 43.9895 )
Norm@50keV   : 3.28690E-02    ( -0.0323166   104.156 )
------------------------------------------------------------
#Fit statistic : Chi-Squared =          49.66 using 59 PHA bins.
# Reduced chi-squared =         0.9029 for     55 degrees of freedom
# Null hypothesis probability =   6.781675e-01

Photon flux (15-150 keV)    in 39.98 sec:  (    ) ph/cm2/s
Energy fluence (15-150 keV)             : 0 ( 0  0 ) ergs/cm2
S(25-50 keV) vs. S(50-100 keV) plot

S(25-50 keV)  = 1.56e-07
S(50-100 keV) = 1.69e-07
T90 vs. Hardness ratio plot

T90                                   = 33.4759999513626 sec.
Hardness ratio (energy fluence ratio) = 1.08333
Color vs. Color plot
Count Ratio  (25-50 keV) / (15-25 keV) = 1.14812
Count Ratio (50-100 keV) / (15-25 keV) = 0.567047
Mask shadow pattern

IMX = -2.436630703935760E-01, IMY = 1.914851246551121E-01
TIME vs. PHA plot around the trigger time
Blue+Cyan dotted lines: Time interval of the scaled map
From 0.000000 to 8.192000
TIME vs. DetID plot around the trigger time

Blue+Cyan dotted lines: Time interval of the scaled map
From 0.000000 to 8.192000
100 us light curve (15-350 keV)
Blue+Cyan dotted lines: Time interval of the scaled map
From 0.000000 to 8.192000
Spacecraft aspect plot

Bright source in the pre-burst/pre-slew/post-slew images
Pre-burst image of 15-350 keV band
Time interval of the image:
-239.232000 -20.884000

# RAcent  DECcent POSerr Theta    Phi  PeakCts   SNR AngSep     Name
#  [deg]    [deg]    ['] [deg]  [deg]                   [']
 83.6377  22.0138    0.4  27.8  -87.5   8.9247  30.4    0.3	Crab
124.6432 -33.4501    2.8  51.7  154.8   4.2085   4.2 ------	UNKNOWN
102.9741 -36.2761    3.3  54.1  177.1   2.6883   3.5 ------	UNKNOWN
143.2494  68.9934    3.0  55.4    0.2   3.0874   3.8 ------	UNKNOWN
100.7812 -29.5439    2.4  48.0 -178.5   2.0560   4.9 ------	UNKNOWN
 97.8382  22.3378    2.3  15.0  -79.4   0.9872   4.9 ------	UNKNOWN
 71.2333  40.2776    2.1  42.7  -60.8   3.7750   5.5 ------	UNKNOWN
 70.3234  12.7402    2.2  41.1 -102.6   4.3506   5.2 ------	UNKNOWN
Pre-slew background subtracted image of 15-350 keV band
Time interval of the image:
-20.884000 19.100000

# RAcent  DECcent POSerr Theta    Phi  PeakCts   SNR AngSep     Name
#  [deg]    [deg]    ['] [deg]  [deg]                   [']
 83.7262  21.8781    6.7  27.7  -87.8   0.1829   1.7    9.7	Crab
150.7317  33.2709    2.2  37.8   44.6   0.7775   5.2 ------	UNKNOWN
 99.4212   5.7527    0.8  17.2 -141.8   1.1027  15.3 ------	UNKNOWN
 81.4213  65.8749    2.1  53.1  -28.0   1.3701   5.5 ------	UNKNOWN
Post-slew image of 15-350 keV band
Time interval of the image:
94.468600 962.827700

# RAcent  DECcent POSerr Theta    Phi  PeakCts   SNR AngSep     Name
#  [deg]    [deg]    ['] [deg]  [deg]                   [']
 83.6350  22.0253    0.2  22.3  -42.8  35.5011  59.0    0.7	Crab
121.5777 -37.2727    3.0  47.7  154.9   7.1830   3.9 ------	UNKNOWN
112.4243  44.1202    3.4  40.0   13.3   3.1407   3.4 ------	UNKNOWN
108.9840  54.4456    2.5  49.3    6.1   5.6196   4.6 ------	UNKNOWN
101.6289 -48.3707    3.8  54.1  177.0   7.1693   3.1 ------	UNKNOWN
101.6124 -41.5692    3.9  47.3  176.6   3.6030   3.0 ------	UNKNOWN
 96.7306  40.6732    3.6  35.0   -4.8   2.4914   3.2 ------	UNKNOWN
 64.7433 -12.4020    2.8  39.0 -119.1   5.5745   4.1 ------	UNKNOWN
 61.6653  44.7315    3.9  51.0  -35.2   5.9417   3.0 ------	UNKNOWN
Plot creation:
Fri Apr 15 11:54:14 EDT 2016