Estimated redshift from machine learning (Ukwatta et al. 2016) - may take a few minute to calcaulte
Image
Pre-slew 15.0-350.0 keV image (Event data)
#   RAcent    DECcent   POSerr    Theta     Phi              Peak Cts       SNR   Name
  122.5626    71.1277   0.0149    45.8567   -25.3478         0.2427134     12.902 TRIG_00682059

Foreground time interval of the image:
  0.016   0.372 (delta_t =   0.356 [sec])
Background time interval of the image:
-40.571   0.016 (delta_t =  40.587 [sec])
Lightcurves
Notes:
- 1) The mask-weighted light curves are using the flight position.
- 2) Multiple plots of different time binning/intervals are shown to cover all scenarios of short/long GRBs, rate/image triggers, and real/false positives.
- 3) For all the mask-weighted lightcurves, the y-axis units are counts/sec/det where a det is 0.4 x 0.4 = 0.16 sq cm.
- 4) The verticle lines correspond to following: green dotted lines are T50 interval, black dotted lines are T90 interval, blue solid line(s) is a spacecraft slew start time, and orange solid line(s) is a spacecraft slew end time.
- 5) Time of each bin is in the middle of the bin.
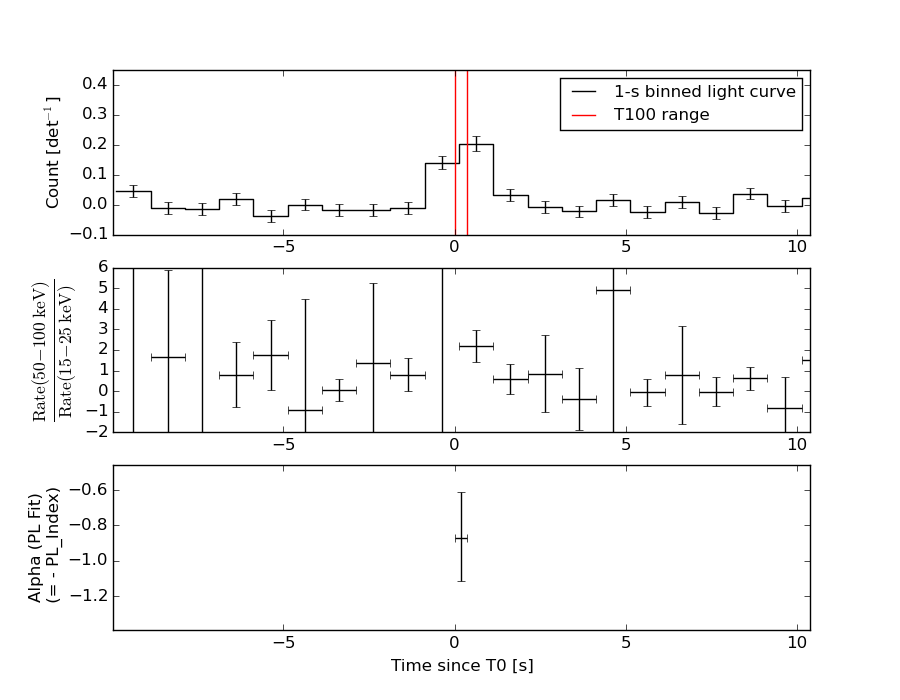
1 s binning
From T0-310 s to T0+310 s
From T100_start - 20 s to T100_end + 30 s
Full time interval
64 ms binning
Full time interval

From T100_start to T100_end

From T0-5 sec to T0+5 sec

16 ms binning
From T100_start-5 s to T100_start+5 s

Blue+Cyan dotted lines: Time interval of the scaled map
From 0.000000 to 0.384000
8 ms binning
From T100_start-3 s to T100_start+3 s
Blue+Cyan dotted lines: Time interval of the scaled map
From 0.000000 to 0.384000
2 ms binning
From T100_start-1 s to T100_start+1 s

Blue+Cyan dotted lines: Time interval of the scaled map
From 0.000000 to 0.384000
SN=5 or 10 sec. binning (whichever binning is satisfied first)

SN=5 or 10 sec. binning (T < 200 sec)
Quad-rate summed light curves (from T0-300s to T0+1000s)

Spectral Evolution
Spectra
Notes:
- 1) The fitting includes the systematic errors.
- 2) When the burst includes telescope slew time periods, the fitting uses an average response file made from multiple 5-s response files through out the slew time plus single time preiod for the non-slew times, and weighted by the total counts in the corresponding time period using addrmf. An average response file is needed becuase a spectral fit using the pre-slew DRM will introduce some errors in both a spectral shape and a normalization if the PHA file contains a lot of the slew/post-slew time interval.
- 3) For fits to more complicated models (e.g. a power-law over a cutoff power-law), the BAT team has decided to require a chi-square improvement of more than 6 for each extra dof.
Time averaged spectrum fit using the average DRM
Power-law model

Time interval is from    0.016 sec. to    0.372 sec.

Spectral model in power-law:
------------------------------------------------------------
Parameters  : value       lower 90%   higher 90%
Photon index: 0.868494     ( -0.25627   0.244942 )
Norm@50keV  : 3.96136E-02    ( -0.00594644   0.00587144 )
------------------------------------------------------------
#Fit statistic : Chi-Squared =          56.23 using 59 PHA bins.
# Reduced chi-squared =         0.9865 for     57 degrees of freedom
# Null hypothesis probability =   5.038664e-01

Photon flux (15-150 keV)    in 0.356 sec: 0.171835 0.193786 0.191382 0.188935 0.186678 0.184342 0.114949 7.50212E-02 5.37835E-02 4.27296E-02 3.67811E-02 3.13924E-02 2.65794E-02 (    ) ph/cm2/s
Energy fluence (15-150 keV)             : 1.60258e-07 ( -2.45111e-08  2.45837e-08 ) ergs/cm2
Cutoff power-law model

Time interval is from    0.016 sec. to    0.372 sec.
Spectral model in the cutoff power-law:
------------------------------------------------------------
Parameters  : value       lower 90%   higher 90%
Photon index: 0.486533     ( -1.28011   0.501304 )
Epeak [keV] : 246.351      ( -246.321 -246.321 )
Norm@50keV  : 5.70015E-02    (     )
------------------------------------------------------------
#Fit statistic : Chi-Squared =          55.84 using 59 PHA bins.
# Reduced chi-squared =         0.9971 for     56 degrees of freedom
# Null hypothesis probability =   4.809578e-01

Photon flux (15-150 keV)    in 0.356 sec: 4.49549 ( -0.67663  0.68994 ) ph/cm2/s
Energy fluence (15-150 keV)             : 1.59269e-07 ( -2.51189e-08  2.49272e-08 ) ergs/cm2
Band function
Time interval is from    0.016 sec. to    0.372 sec.

Spectral model in the Band function:
------------------------------------------------------------
Parameters  : value       lower 90%   higher 90%
alpha       : -9.99998   ( 9.99998   9.99998 )
beta        : -0.868493    ( -0.244941   0.25627 )
Epeak [keV] : 15.6882      ( -15.6882 -15.6882 )
Norm@50keV   : 5.38405    ( -0.808211   0.798029 )
------------------------------------------------------------
#Fit statistic : Chi-Squared =          56.23 using 59 PHA bins.
# Reduced chi-squared =          1.022 for     55 degrees of freedom
# Null hypothesis probability =   4.285351e-01

Photon flux (15-150 keV)    in 0.356 sec:  (    ) ph/cm2/s
Energy fluence (15-150 keV)             : 0 ( 0  0 ) ergs/cm2
Single BB

Spectral model blackbody:
------------------------------------------------------------
Parameters  : value    Lower 90%  Upper 90%
kT [keV]    : 25.2796  (-4.2703  5.84174)
R^2/D10^2   : 0.112683  (-0.0525171   0.0866994)
(R is the radius in km and D10 is the distance to the source in units of 10 kpc)
------------------------------------------------------------
#Fit statistic : Chi-Squared =          60.54 using 59 PHA bins.
# Reduced chi-squared =          1.062 for     57 degrees of freedom
# Null hypothesis probability =   3.492246e-01

Energy  Fluence     90% Error
[keV]   [erg/cm2]   [erg/cm2]
15- 25  4.427e-09   1.510e-09
25- 50  2.526e-08   6.565e-09
50-150  1.195e-07   3.092e-08
15-150  1.492e-07   3.510e-08
Thermal bremsstrahlung (OTTB)
Spectral model: thermal bremsstrahlung
------------------------------------------------------------
Parameters  : value         Lower 90%    Upper 90%
kT [keV]    : 200.000       (-31.4371      -200)
Norm        : 17.9829       (-2.78762     2.78762)
------------------------------------------------------------
#Fit statistic : Chi-Squared =          76.52 using 59 PHA bins.
# Reduced chi-squared =          1.342 for     57 degrees of freedom
# Null hypothesis probability =   4.322940e-02

Energy  Fluence     90% Error
[keV]   [erg/cm2]   [erg/cm2]
15- 25  1.594e-08   9.174e-09
25- 50  3.065e-08   1.740e-08
50-150  6.723e-08   3.823e-08
15-150  1.138e-07   6.364e-08
Double BB

Spectral model: bbodyrad<1> + bbodyrad<2>
------------------------------------------------------------
Parameters  : value         Lower 90%    Upper 90%
kT1 [keV]   : 4.02780        (-2.14902      7.12234)
R1^2/D10^2  : 22.2516        (-21.8568      2105.67)
kT2 [keV]   : 28.9467        (-5.78132      15.4759)
R2^2/D10^2  : 7.13436E-02    (-0.0511912   0.0498122)
------------------------------------------------------------
#Fit statistic : Chi-Squared =          54.60 using 59 PHA bins.
# Reduced chi-squared =         0.9927 for     55 degrees of freedom
# Null hypothesis probability =   4.899365e-01

Energy  Fluence     90% Error
[keV]   [erg/cm2]   [erg/cm2]
15- 25  1.085e-08   5.479e-09
25- 50  2.342e-08   7.656e-09
50-150  1.240e-07   4.297e-08
15-150  1.583e-07   5.365e-08
Peak spectrum fit
Power-law model

Time interval is from   -0.304 sec. to    0.696 sec.

Spectral model in power-law:
------------------------------------------------------------
Parameters  : value       lower 90%   higher 90%
Photon index: 0.904721     ( -0.258378   0.243922 )
Norm@50keV  : 1.84231E-02    ( -0.00296828   0.00292739 )
------------------------------------------------------------
#Fit statistic : Chi-Squared =          53.87 using 59 PHA bins.
# Reduced chi-squared =         0.9450 for     57 degrees of freedom
# Null hypothesis probability =   5.934008e-01

Photon flux (15-150 keV)    in 1 sec: 2.11464 ( -0.33841  0.34083 ) ph/cm2/s
Energy fluence (15-150 keV)             : 2.064e-07 ( -3.21632e-08  3.22437e-08 ) ergs/cm2
Cutoff power-law model

Time interval is from   -0.304 sec. to    0.696 sec.
Spectral model in the cutoff power-law:
------------------------------------------------------------
Parameters  : value       lower 90%   higher 90%
Photon index: -0.550265     ( -1.75178   1.23199 )
Epeak [keV] : 107.364      ( -27.9155 221.663 )
Norm@50keV  : 7.31570E-02    ( -0.0731571   0.253614 )
------------------------------------------------------------
#Fit statistic : Chi-Squared =          49.64 using 59 PHA bins.
# Reduced chi-squared =         0.8864 for     56 degrees of freedom
# Null hypothesis probability =   7.128785e-01

Photon flux (15-150 keV)    in 1 sec: 2.01297 ( -0.34915  0.35259 ) ph/cm2/s
Energy fluence (15-150 keV)             : 1.98793e-07 ( -3.43028e-08  3.39464e-08 ) ergs/cm2
Band function
Time interval is from   -0.304 sec. to    0.696 sec.

Spectral model in the Band function:
------------------------------------------------------------
Parameters  : value       lower 90%   higher 90%
alpha       : 0.550003   ( -0.902742   0.919683 )
beta        : -10.00000    ( 10   20 )
Epeak [keV] : 107.359      ( -21.1548 221.265 )
Norm@50keV   : 7.31508E-02    ( -0.0108085   0.247824 )
------------------------------------------------------------
#Fit statistic : Chi-Squared =          49.64 using 59 PHA bins.
# Reduced chi-squared =         0.9025 for     55 degrees of freedom
# Null hypothesis probability =   6.789076e-01

Photon flux (15-150 keV)    in 1 sec:  (    ) ph/cm2/s
Energy fluence (15-150 keV)             : 0 ( 0  0 ) ergs/cm2
Single BB

Spectral model blackbody:
------------------------------------------------------------
Parameters  : value    Lower 90%  Upper 90%
kT [keV]    : 23.5462  (-3.69525  4.90281)
R^2/D10^2   : 6.60212E-02  (-0.029765   0.0481425)
(R is the radius in km and D10 is the distance to the source in units of 10 kpc)
------------------------------------------------------------
#Fit statistic : Chi-Squared =          50.37 using 59 PHA bins.
# Reduced chi-squared =         0.8838 for     57 degrees of freedom
# Null hypothesis probability =   7.201238e-01

Energy  Fluence     90% Error
[keV]   [erg/cm2]   [erg/cm2]
15- 25  6.558e-09   2.150e-09
25- 50  3.604e-08   9.800e-09
50-150  1.491e-07   3.815e-08
15-150  1.917e-07   4.850e-08
Thermal bremsstrahlung (OTTB)

Spectral model: thermal bremsstrahlung
------------------------------------------------------------
Parameters  : value         Lower 90%    Upper 90%
kT [keV]    : 200.000       (-32.0839      -200)
Norm        : 8.74421       (-1.42492     1.42492)
------------------------------------------------------------
#Fit statistic : Chi-Squared =          71.59 using 59 PHA bins.
# Reduced chi-squared =          1.256 for     57 degrees of freedom
# Null hypothesis probability =   9.236783e-02

Energy  Fluence     90% Error
[keV]   [erg/cm2]   [erg/cm2]
15- 25  2.178e-08   1.249e-08
25- 50  4.190e-08   2.353e-08
50-150  9.189e-08   5.255e-08
15-150  1.556e-07   8.790e-08
Double BB

Spectral model: bbodyrad<1> + bbodyrad<2>
------------------------------------------------------------
Parameters  : value         Lower 90%    Upper 90%
kT1 [keV]   : 8.81567        (-8.81567      -8.81567)
R1^2/D10^2  : 0.266158        (-0.266158      -0.266158)
kT2 [keV]   : 26.3628        (-6.02159      -26.3628)
R2^2/D10^2  : 4.27445E-02    (-0.0427445   0.0628224)
------------------------------------------------------------
#Fit statistic : Chi-Squared =          49.64 using 59 PHA bins.
# Reduced chi-squared =         0.9026 for     55 degrees of freedom
# Null hypothesis probability =   6.787200e-01

Energy  Fluence     90% Error
[keV]   [erg/cm2]   [erg/cm2]
15- 25  8.997e-09   4.750e-09
25- 50  3.739e-08   1.964e-08
50-150  1.520e-07   8.375e-08
15-150  1.984e-07   1.090e-07
Pre-slew spectrum (Pre-slew PHA with pre-slew DRM)
Power-law model

Spectral model in power-law:
------------------------------------------------------------
Parameters  : value       lower 90%   higher 90%
Photon index: 0.868494     ( -0.25627   0.244942 )
Norm@50keV  : 3.96136E-02    ( -0.00594644   0.00587144 )
------------------------------------------------------------
#Fit statistic : Chi-Squared =          56.23 using 59 PHA bins.
# Reduced chi-squared =         0.9865 for     57 degrees of freedom
# Null hypothesis probability =   5.038664e-01

Photon flux (15-150 keV)    in 0.356 sec: 4.54659 ( -0.674461  0.676144 ) ph/cm2/s
Energy fluence (15-150 keV)             : 1.60242e-07 ( -2.45098e-08  2.45907e-08 ) ergs/cm2
Cutoff power-law model
Spectral model in the cutoff power-law:
------------------------------------------------------------
Parameters  : value       lower 90%   higher 90%
Photon index: 0.486465     ( -1.2801   0.501316 )
Epeak [keV] : 246.324      ( -246.32 -246.32 )
Norm@50keV  : 5.70046E-02    ( -0.057005   0.120175 )
------------------------------------------------------------
#Fit statistic : Chi-Squared =          55.84 using 59 PHA bins.
# Reduced chi-squared =         0.9971 for     56 degrees of freedom
# Null hypothesis probability =   4.809578e-01

Photon flux (15-150 keV)    in 0.356 sec: 4.49541 ( -0.69214  0.68961 ) ph/cm2/s
Energy fluence (15-150 keV)             : 1.59346e-07 ( -2.5134e-08  2.49528e-08 ) ergs/cm2
Band function

Spectral model in the Band function:
------------------------------------------------------------
Parameters  : value       lower 90%   higher 90%
alpha       : -9.99998   ( 9.99998   9.99998 )
beta        : -0.868493    ( -0.244941   0.25627 )
Epeak [keV] : 15.6882      ( -15.6882 -15.6882 )
Norm@50keV   : 5.38405    ( -0.808211   0.798029 )
------------------------------------------------------------
#Fit statistic : Chi-Squared =          56.23 using 59 PHA bins.
# Reduced chi-squared =          1.022 for     55 degrees of freedom
# Null hypothesis probability =   4.285351e-01

Photon flux (15-150 keV)    in 0.356 sec:  (    ) ph/cm2/s
Energy fluence (15-150 keV)             : 0 ( 0  0 ) ergs/cm2
S(25-50 keV) vs. S(50-100 keV) plot
S(25-50 keV)  = 2.71e-08
S(50-100 keV) = 5.95e-08
T90 vs. Hardness ratio plot
T90                                   = 0.319999933242798 sec.
Hardness ratio (energy fluence ratio) = 2.19557
Color vs. Color plot
Count Ratio  (25-50 keV) / (15-25 keV) = 2.17246
Count Ratio (50-100 keV) / (15-25 keV) = 3.4308
Mask shadow pattern

IMX = 9.311642255971224E-01, IMY = 4.411101652933436E-01
TIME vs. PHA plot around the trigger time
Blue+Cyan dotted lines: Time interval of the scaled map
From 0.000000 to 0.384000
TIME vs. DetID plot around the trigger time

Blue+Cyan dotted lines: Time interval of the scaled map
From 0.000000 to 0.384000
100 us light curve (15-350 keV)
Blue+Cyan dotted lines: Time interval of the scaled map
From 0.000000 to 0.384000
Spacecraft aspect plot
Bright source in the pre-burst/pre-slew/post-slew images
Pre-burst image of 15-350 keV band
Time interval of the image:
-40.571410 0.016000

# RAcent  DECcent POSerr Theta    Phi  PeakCts   SNR AngSep     Name
#  [deg]    [deg]    ['] [deg]  [deg]                   [']
131.1709 -26.7536    1.8  52.2  156.1   2.1750   6.4 ------	UNKNOWN
184.4816  51.2775    2.7  48.7   20.8   0.8202   4.3 ------	UNKNOWN
Pre-slew background subtracted image of 15-350 keV band
Time interval of the image:
0.016000 0.372000

# RAcent  DECcent POSerr Theta    Phi  PeakCts   SNR AngSep     Name
#  [deg]    [deg]    ['] [deg]  [deg]                   [']
125.3071 -21.0625    2.6  46.7  163.4   0.0846   4.5 ------	UNKNOWN
 99.1154 -23.9707    2.4  57.6 -168.8   0.1729   4.8 ------	UNKNOWN
184.8144  79.3265    2.5  58.8  -11.9   0.2611   4.5 ------	UNKNOWN
122.5626  71.1278    0.9  45.9  -25.3   0.2427  12.9 ------	UNKNOWN
 95.3854  26.3688    2.2  30.7 -102.8   0.0723   5.2 ------	UNKNOWN
Post-slew image of 15-350 keV band
Time interval of the image:
78.828600 962.192200

# RAcent  DECcent POSerr Theta    Phi  PeakCts   SNR AngSep     Name
#  [deg]    [deg]    ['] [deg]  [deg]                   [']
 83.6177  22.0179    0.8  54.0 -150.4  31.4507  13.9    0.9	Crab
170.0291  75.1479    4.3  13.9   35.3   1.3179   2.7 ------	UNKNOWN
321.6205  58.8672    4.0  49.3  -29.4   3.5871   2.9 ------	UNKNOWN
Plot creation:
Wed Jun  1 17:56:38 EDT 2016