Estimated redshift from machine learning (Ukwatta et al. 2016) - may take a few minute to calcaulte
Image
Pre-slew 15.0-350.0 keV image (Event data)
#   RAcent    DECcent   POSerr    Theta     Phi              Peak Cts       SNR   Name
  349.3731   -40.2589   0.0221    41.9472  -133.4827         0.1438468      8.714 TRIG_00682339

Foreground time interval of the image:
  0.060   0.452 (delta_t =   0.392 [sec])
Background time interval of the image:
-81.731   0.060 (delta_t =  81.791 [sec])
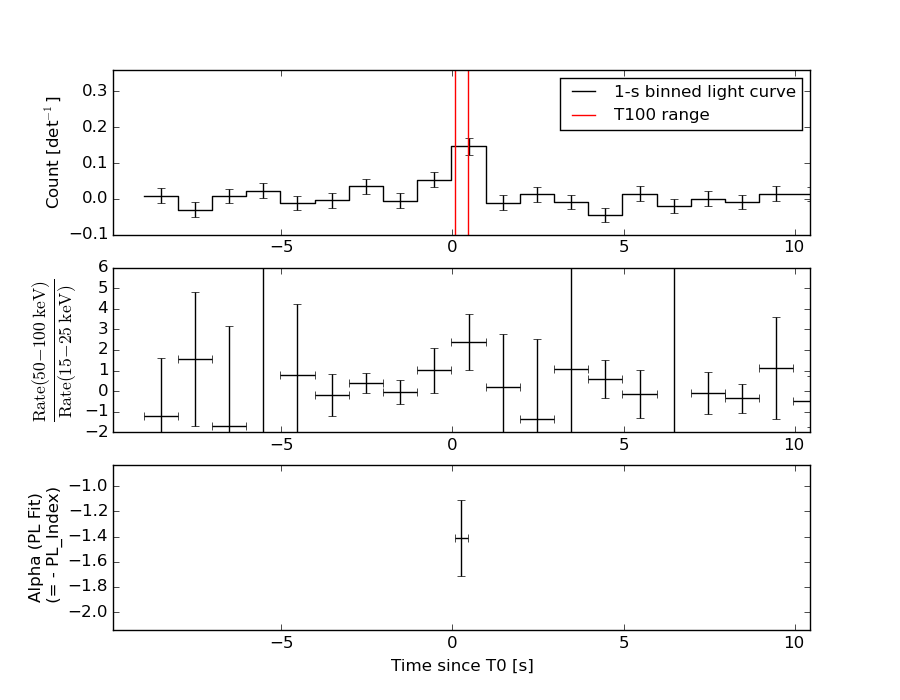
Lightcurves
Notes:
- 1) The mask-weighted light curves are using the flight position.
- 2) Multiple plots of different time binning/intervals are shown to cover all scenarios of short/long GRBs, rate/image triggers, and real/false positives.
- 3) For all the mask-weighted lightcurves, the y-axis units are counts/sec/det where a det is 0.4 x 0.4 = 0.16 sq cm.
- 4) The verticle lines correspond to following: green dotted lines are T50 interval, black dotted lines are T90 interval, blue solid line(s) is a spacecraft slew start time, and orange solid line(s) is a spacecraft slew end time.
- 5) Time of each bin is in the middle of the bin.
1 s binning
From T0-310 s to T0+310 s
From T100_start - 20 s to T100_end + 30 s
Full time interval
64 ms binning
Full time interval
From T100_start to T100_end
From T0-5 sec to T0+5 sec
16 ms binning
From T100_start-5 s to T100_start+5 s
8 ms binning
From T100_start-3 s to T100_start+3 s
2 ms binning
From T100_start-1 s to T100_start+1 s
SN=5 or 10 sec. binning (whichever binning is satisfied first)
SN=5 or 10 sec. binning (T < 200 sec)
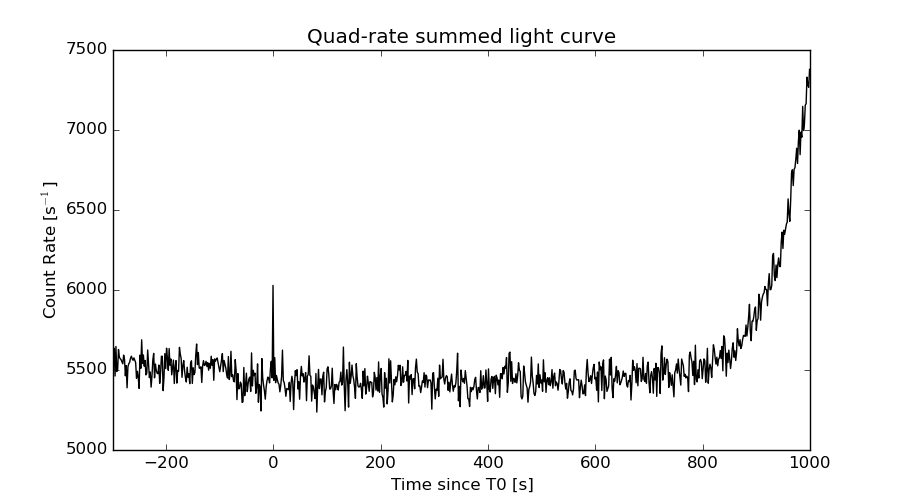
Quad-rate summed light curves (from T0-300s to T0+1000s)
Spectral Evolution
Spectra
Notes:
- 1) The fitting includes the systematic errors.
- 2) When the burst includes telescope slew time periods, the fitting uses an average response file made from multiple 5-s response files through out the slew time plus single time preiod for the non-slew times, and weighted by the total counts in the corresponding time period using addrmf. An average response file is needed becuase a spectral fit using the pre-slew DRM will introduce some errors in both a spectral shape and a normalization if the PHA file contains a lot of the slew/post-slew time interval.
- 3) For fits to more complicated models (e.g. a power-law over a cutoff power-law), the BAT team has decided to require a chi-square improvement of more than 6 for each extra dof.
Time averaged spectrum fit using the average DRM
Power-law model
Time interval is from    0.060 sec. to    0.452 sec.

Spectral model in power-law:
------------------------------------------------------------
Parameters  : value       lower 90%   higher 90%
Photon index: 1.40944     ( -0.299254   0.303467 )
Norm@50keV  : 2.06955E-02    ( -0.00456469   0.00456188 )
------------------------------------------------------------
#Fit statistic : Chi-Squared =          65.94 using 59 PHA bins.
# Reduced chi-squared =          1.157 for     57 degrees of freedom
# Null hypothesis probability =   1.952526e-01

Photon flux (15-150 keV)    in 0.392 sec: 2.52626 ( -0.57323  0.5762 ) ph/cm2/s
Energy fluence (15-150 keV)             : 7.82322e-08 ( -1.80115e-08  1.80943e-08 ) ergs/cm2
Cutoff power-law model

Time interval is from    0.060 sec. to    0.452 sec.
Spectral model in the cutoff power-law:
------------------------------------------------------------
Parameters  : value       lower 90%   higher 90%
Photon index: -1.40225     ( -3.30513   1.77778 )
Epeak [keV] : 66.5851      ( -13.1238 25.7583 )
Norm@50keV  : 0.412443    ( -0.412444   10.6718 )
------------------------------------------------------------
#Fit statistic : Chi-Squared =          56.77 using 59 PHA bins.
# Reduced chi-squared =          1.014 for     56 degrees of freedom
# Null hypothesis probability =   4.461073e-01

Photon flux (15-150 keV)    in 0.392 sec: 2.39281 ( -0.58849  0.59049 ) ph/cm2/s
Energy fluence (15-150 keV)             : 7.55188e-08 ( -1.93395e-08  1.95386e-08 ) ergs/cm2
Band function
Time interval is from    0.060 sec. to    0.452 sec.

Spectral model in the Band function:
------------------------------------------------------------
Parameters  : value       lower 90%   higher 90%
alpha       : 1.25285   ( -1.62427   2.57043 )
beta        : -9.37167    ( 9.37167   19.3715 )
Epeak [keV] : 67.3879      ( -13.7413 24.3192 )
Norm@50keV   : 0.353499    ( -0.357553   36.1218 )
------------------------------------------------------------
#Fit statistic : Chi-Squared =          56.78 using 59 PHA bins.
# Reduced chi-squared =          1.032 for     55 degrees of freedom
# Null hypothesis probability =   4.083588e-01

Photon flux (15-150 keV)    in 0.392 sec:  (    ) ph/cm2/s
Energy fluence (15-150 keV)             : 0 ( 0  0 ) ergs/cm2
Single BB

Spectral model blackbody:
------------------------------------------------------------
Parameters  : value    Lower 90%  Upper 90%
kT [keV]    : 17.0305  (-3.15055  3.79492)
R^2/D10^2   : 0.222174  (-0.113154   0.223849)
(R is the radius in km and D10 is the distance to the source in units of 10 kpc)
------------------------------------------------------------
#Fit statistic : Chi-Squared =          56.76 using 59 PHA bins.
# Reduced chi-squared =         0.9958 for     57 degrees of freedom
# Null hypothesis probability =   4.839677e-01

Energy  Fluence     90% Error
[keV]   [erg/cm2]   [erg/cm2]
15- 25  5.142e-09   2.194e-09
25- 50  2.278e-08   7.560e-09
50-150  4.721e-08   1.754e-08
15-150  7.513e-08   2.187e-08
Thermal bremsstrahlung (OTTB)
Spectral model: thermal bremsstrahlung
------------------------------------------------------------
Parameters  : value         Lower 90%    Upper 90%
kT [keV]    : 199.358       (-93.1222      -199.362)
Norm        : 10.7943       (-2.34352     2.3472)
------------------------------------------------------------
#Fit statistic : Chi-Squared =          64.37 using 59 PHA bins.
# Reduced chi-squared =          1.129 for     57 degrees of freedom
# Null hypothesis probability =   2.343461e-01

Energy  Fluence     90% Error
[keV]   [erg/cm2]   [erg/cm2]
15- 25  1.054e-08   6.227e-09
25- 50  2.027e-08   1.162e-08
50-150  4.445e-08   2.644e-08
15-150  7.526e-08   4.457e-08
Double BB
Spectral model: bbodyrad<1> + bbodyrad<2>
------------------------------------------------------------
Parameters  : value         Lower 90%    Upper 90%
kT1 [keV]   : 0.146610        (-0.14661      -0.14661)
R1^2/D10^2  : 6.69056E-02        (-0.0669056      -0.0669056)
kT2 [keV]   : 17.0304        (-3.15047      3.795)
R2^2/D10^2  : 0.222177    (-0.113157   0.223846)
------------------------------------------------------------
#Fit statistic : Chi-Squared =          56.76 using 59 PHA bins.
# Reduced chi-squared =          1.032 for     55 degrees of freedom
# Null hypothesis probability =   4.091635e-01

Energy  Fluence     90% Error
[keV]   [erg/cm2]   [erg/cm2]
15- 25  0.000e+00   0.000e+00
25- 50  0.000e+00   0.000e+00
50-150  0.000e+00   0.000e+00
15-150  0.000e+00   0.000e+00
Peak spectrum fit
Power-law model

Time interval is from   -0.242 sec. to    0.758 sec.

Spectral model in power-law:
------------------------------------------------------------
Parameters  : value       lower 90%   higher 90%
Photon index: 1.63178     ( -0.333691   0.353393 )
Norm@50keV  : 1.14598E-02    ( -0.00272308   0.00268404 )
------------------------------------------------------------
#Fit statistic : Chi-Squared =          64.99 using 59 PHA bins.
# Reduced chi-squared =          1.140 for     57 degrees of freedom
# Null hypothesis probability =   2.183141e-01

Photon flux (15-150 keV)    in 1 sec: 1.48751 ( -0.33405  0.33466 ) ph/cm2/s
Energy fluence (15-150 keV)             : 1.0681e-07 ( -2.63556e-08  2.68896e-08 ) ergs/cm2
Cutoff power-law model
Time interval is from   -0.242 sec. to    0.758 sec.
Spectral model in the cutoff power-law:
------------------------------------------------------------
Parameters  : value       lower 90%   higher 90%
Photon index: -1.24041     ( -3.99891   2.1879 )
Epeak [keV] : 51.9308      ( -10.1401 26.3567 )
Norm@50keV  : 0.381442    ( -0.405766   45.3047 )
------------------------------------------------------------
#Fit statistic : Chi-Squared =          59.07 using 59 PHA bins.
# Reduced chi-squared =          1.055 for     56 degrees of freedom
# Null hypothesis probability =   3.639494e-01

Photon flux (15-150 keV)    in 1 sec: 1.37142 ( -0.35057  0.35144 ) ph/cm2/s
Energy fluence (15-150 keV)             : 9.12914e-08 ( -2.48146e-08  2.88133e-08 ) ergs/cm2
Band function
Time interval is from   -0.242 sec. to    0.758 sec.

Spectral model in the Band function:
------------------------------------------------------------
Parameters  : value       lower 90%   higher 90%
alpha       : 0.448968   ( -2.35546   -1.33594 )
beta        : -4.97101    ( 3.48346   13.4834 )
Epeak [keV] : 54.8459      ( -14.2402 25.3998 )
Norm@50keV   : 0.141879    ( -0.603387   41.9965 )
------------------------------------------------------------
#Fit statistic : Chi-Squared =          59.45 using 59 PHA bins.
# Reduced chi-squared =          1.081 for     55 degrees of freedom
# Null hypothesis probability =   3.167165e-01

Photon flux (15-150 keV)    in 1 sec:  (    ) ph/cm2/s
Energy fluence (15-150 keV)             : 0 ( 0  0 ) ergs/cm2
Single BB
Spectral model blackbody:
------------------------------------------------------------
Parameters  : value    Lower 90%  Upper 90%
kT [keV]    : 13.1679  (-2.45842  3.0797)
R^2/D10^2   : 0.292118  (-0.157537   0.321018)
(R is the radius in km and D10 is the distance to the source in units of 10 kpc)
------------------------------------------------------------
#Fit statistic : Chi-Squared =          59.06 using 59 PHA bins.
# Reduced chi-squared =          1.036 for     57 degrees of freedom
# Null hypothesis probability =   4.000684e-01

Energy  Fluence     90% Error
[keV]   [erg/cm2]   [erg/cm2]
15- 25  1.074e-08   4.062e-09
25- 50  3.750e-08   1.447e-08
50-150  4.142e-08   2.113e-08
15-150  8.966e-08   3.416e-08
Thermal bremsstrahlung (OTTB)
Spectral model: thermal bremsstrahlung
------------------------------------------------------------
Parameters  : value         Lower 90%    Upper 90%
kT [keV]    : 144.367       (-73.5806      -136.527)
Norm        : 6.14243       (-1.50002     2.03269)
------------------------------------------------------------
#Fit statistic : Chi-Squared =          63.15 using 59 PHA bins.
# Reduced chi-squared =          1.108 for     57 degrees of freedom
# Null hypothesis probability =   2.680148e-01

Energy  Fluence     90% Error
[keV]   [erg/cm2]   [erg/cm2]
15- 25  1.583e-08   9.210e-09
25- 50  2.917e-08   1.616e-08
50-150  5.666e-08   3.626e-08
15-150  1.017e-07   6.075e-08
Double BB
#Fit statistic : Chi-Squared =          58.62 using 59 PHA bins.
# Reduced chi-squared =          1.068 for     55 degrees of freedom
# Reduced chi-squared =          1.067 for     55 degrees of freedom
# Reduced chi-squared =          1.067 for     55 degrees of freedom
# Reduced chi-squared =          1.066 for     55 degrees of freedom
# Reduced chi-squared =          1.066 for     55 degrees of freedom
# Reduced chi-squared =          1.066 for     55 degrees of freedom
# Null hypothesis probability =   3.393620e-01
# Null hypothesis probability =   3.411352e-01
# Null hypothesis probability =   3.424584e-01
# Null hypothesis probability =   3.433058e-01
# Null hypothesis probability =   3.437612e-01
# Null hypothesis probability =   3.441011e-01

Energy  Fluence     90% Error
[keV]   [erg/cm2]   [erg/cm2]
15- 25  1.105e-08   4.894e-09
25- 50  3.689e-08   1.765e-08
50-150  4.205e-08   2.282e-08
15-150  8.999e-08   3.806e-08
Pre-slew spectrum (Pre-slew PHA with pre-slew DRM)
Power-law model

Spectral model in power-law:
------------------------------------------------------------
Parameters  : value       lower 90%   higher 90%
Photon index: 1.40944     ( -0.299254   0.303467 )
Norm@50keV  : 2.06955E-02    ( -0.00456469   0.00456188 )
------------------------------------------------------------
#Fit statistic : Chi-Squared =          65.94 using 59 PHA bins.
# Reduced chi-squared =          1.157 for     57 degrees of freedom
# Null hypothesis probability =   1.952526e-01

Photon flux (15-150 keV)    in 0.392 sec: 2.52625 ( -0.573196  0.576186 ) ph/cm2/s
Energy fluence (15-150 keV)             : 7.82263e-08 ( -1.80088e-08  1.81196e-08 ) ergs/cm2
Cutoff power-law model
Spectral model in the cutoff power-law:
------------------------------------------------------------
Parameters  : value       lower 90%   higher 90%
Photon index: -1.40053     ( -3.30545   1.77748 )
Epeak [keV] : 66.5927      ( -13.1238 25.758 )
Norm@50keV  : 0.411718    ( -0.41244   10.6736 )
------------------------------------------------------------
#Fit statistic : Chi-Squared =          56.77 using 59 PHA bins.
# Reduced chi-squared =          1.014 for     56 degrees of freedom
# Null hypothesis probability =   4.461072e-01

Photon flux (15-150 keV)    in 0.392 sec: 2.39272 ( -0.58829  0.59071 ) ph/cm2/s
Energy fluence (15-150 keV)             : 7.55458e-08 ( -1.93389e-08  1.95483e-08 ) ergs/cm2
Band function

Spectral model in the Band function:
------------------------------------------------------------
Parameters  : value       lower 90%   higher 90%
alpha       : 1.25285   ( -1.62427   2.57043 )
beta        : -9.37167    ( 9.37167   19.3715 )
Epeak [keV] : 67.3879      ( -13.7414 24.3192 )
Norm@50keV   : 0.353499    ( -0.357553   34.0065 )
------------------------------------------------------------
#Fit statistic : Chi-Squared =          56.78 using 59 PHA bins.
# Reduced chi-squared =          1.032 for     55 degrees of freedom
# Null hypothesis probability =   4.083588e-01

Photon flux (15-150 keV)    in 0.392 sec:  (    ) ph/cm2/s
Energy fluence (15-150 keV)             : 0 ( 0  0 ) ergs/cm2
S(25-50 keV) vs. S(50-100 keV) plot
S(25-50 keV)  = 1.85e-08
S(50-100 keV) = 2.78e-08
T90 vs. Hardness ratio plot
T90                                   = 0.355999946594238 sec.
Hardness ratio (energy fluence ratio) = 1.5027
Color vs. Color plot
Count Ratio  (25-50 keV) / (15-25 keV) = 3.07418
Count Ratio (50-100 keV) / (15-25 keV) = 3.13736
Mask shadow pattern
IMX = -6.184523809566941E-01, IMY = 6.521067639165855E-01
TIME vs. PHA plot around the trigger time
TIME vs. DetID plot around the trigger time
100 us light curve (15-350 keV)
Spacecraft aspect plot

Bright source in the pre-burst/pre-slew/post-slew images
Pre-burst image of 15-350 keV band
Time interval of the image:
-81.731420 0.060000

# RAcent  DECcent POSerr Theta    Phi  PeakCts   SNR AngSep     Name
#  [deg]    [deg]    ['] [deg]  [deg]                   [']
297.7962 -63.1040    3.6  41.2  168.2   0.5380   3.2 ------	UNKNOWN
301.0864 -54.8947    2.8  47.3  176.6   0.9221   4.2 ------	UNKNOWN
Pre-slew background subtracted image of 15-350 keV band
Time interval of the image:
0.060000 0.452000

# RAcent  DECcent POSerr Theta    Phi  PeakCts   SNR AngSep     Name
#  [deg]    [deg]    ['] [deg]  [deg]                   [']
349.3730 -40.2589    1.3  41.9 -133.5   0.1439   8.7 ------	UNKNOWN
Post-slew image of 15-350 keV band
Time interval of the image:
Plot creation:
Wed Jun  1 17:53:25 EDT 2016