Estimated redshift from machine learning (Ukwatta et al. 2016) - may take a few minute to calcaulte
Image
Pre-slew 15.0-350.0 keV image (Event data)
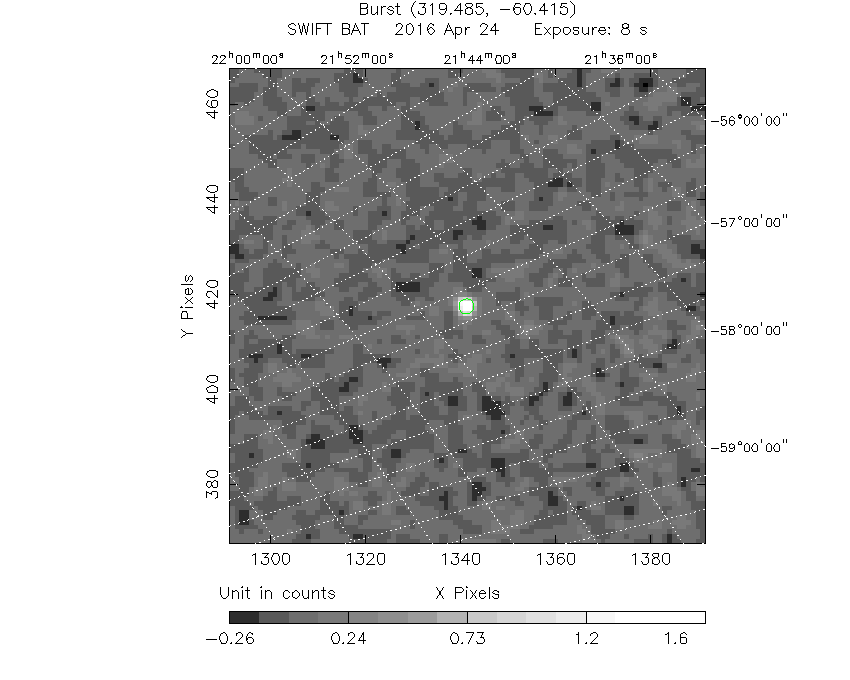
# RAcent DECcent POSerr Theta Phi Peak Cts SNR Name
319.4846 -60.4081 0.0076 44.3598 172.6921 1.8508401 25.517 TRIG_00683906
Foreground time interval of the image:
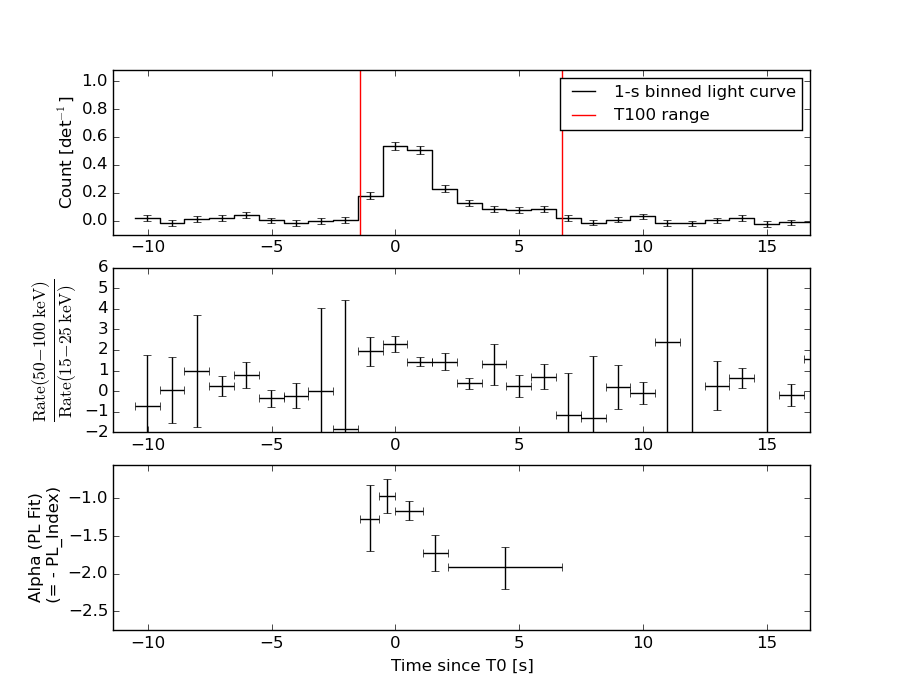
-1.424 6.736 (delta_t = 8.160 [sec])
Background time interval of the image:
-239.520 -1.424 (delta_t = 238.096 [sec])
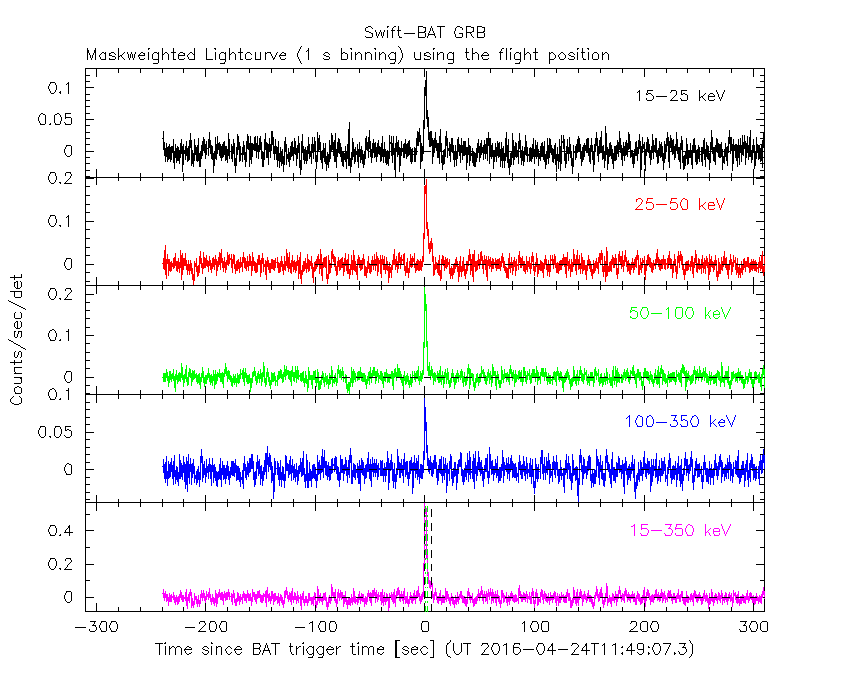
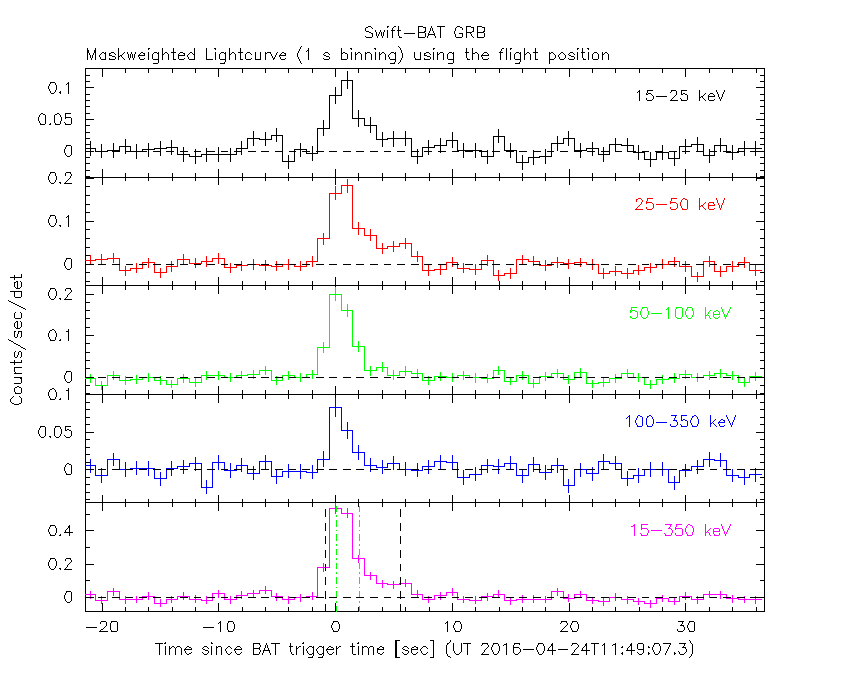
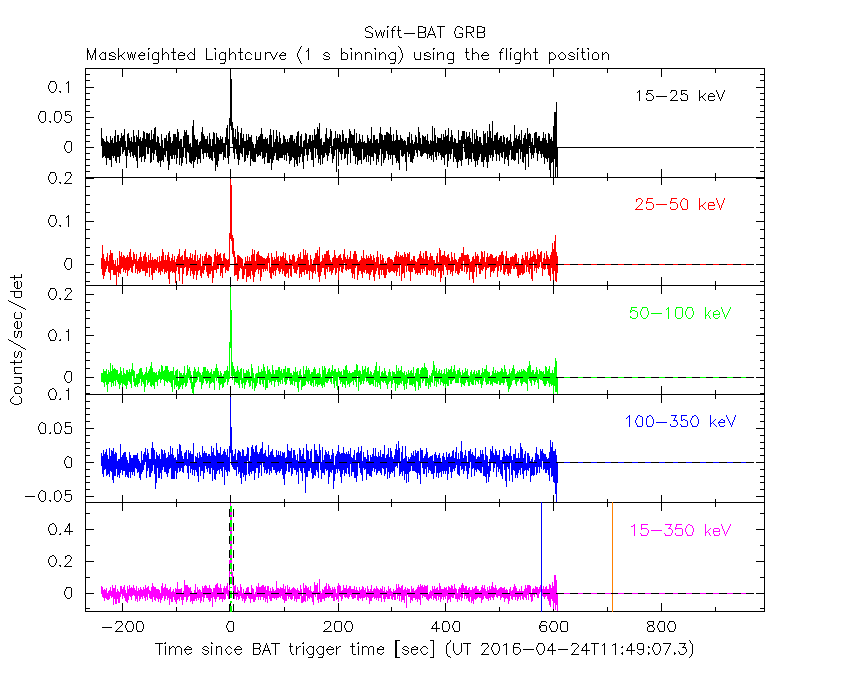
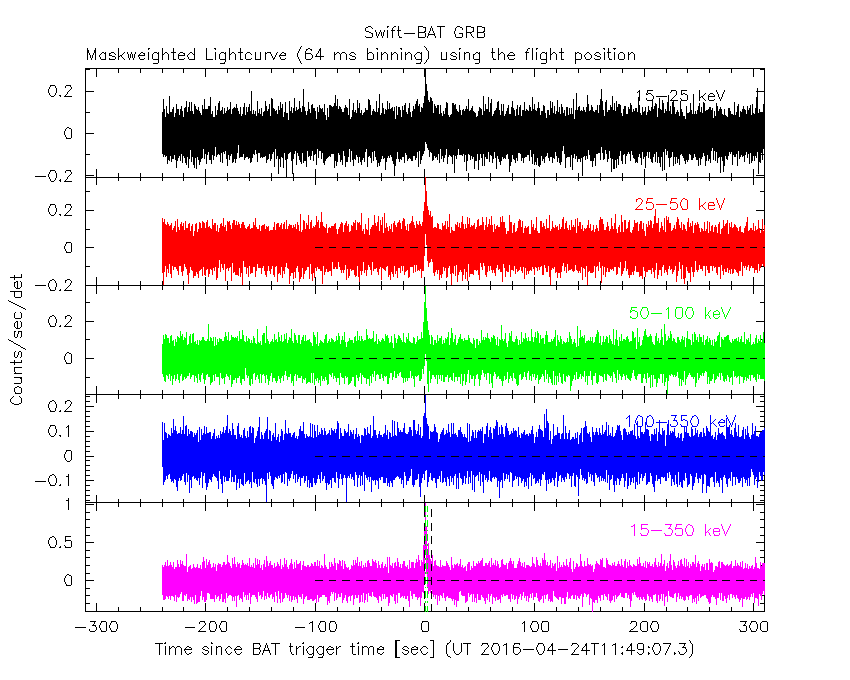
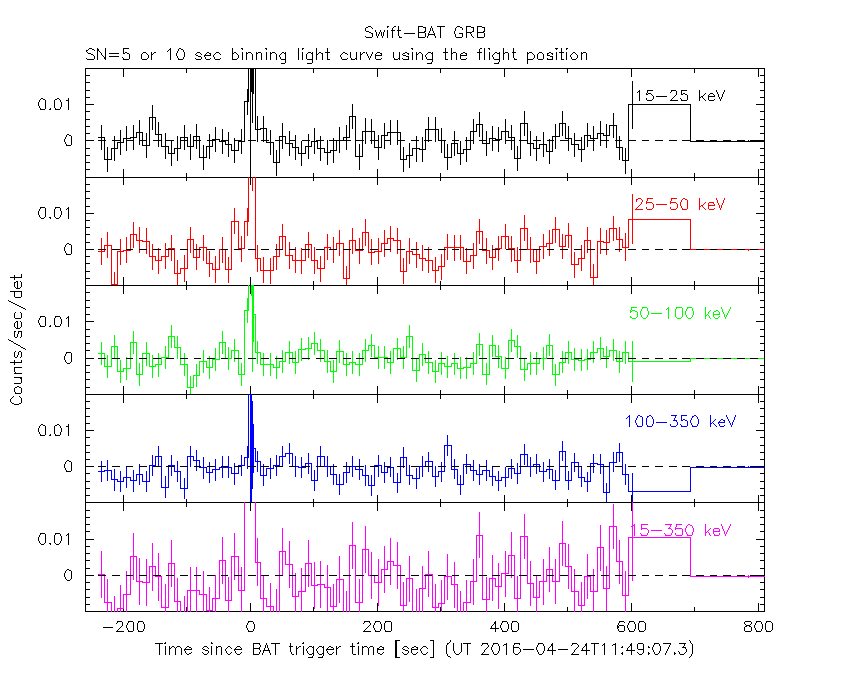
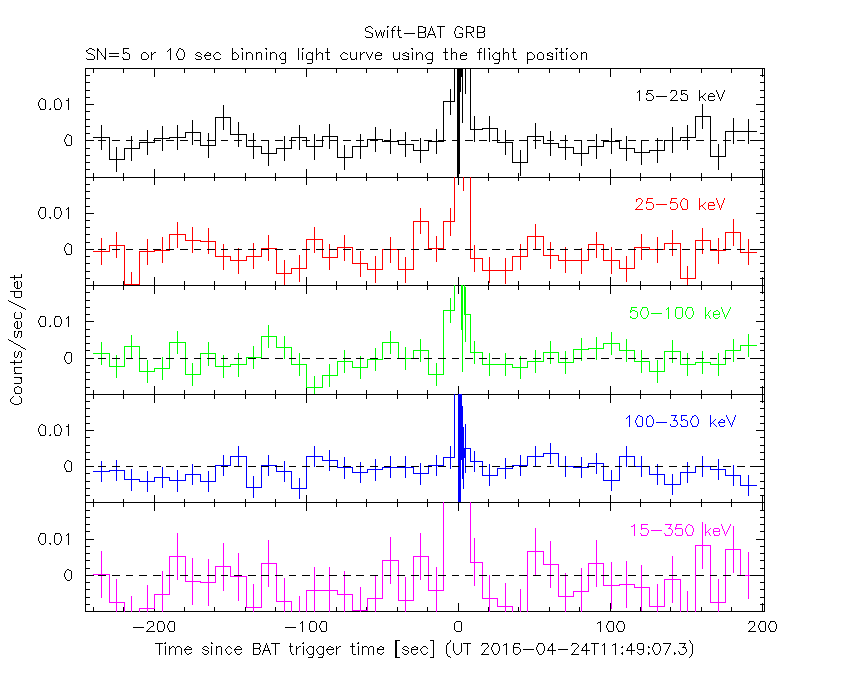
Lightcurves
Notes:
- 1) The mask-weighted light curves are using the flight position.
- 2) Multiple plots of different time binning/intervals are shown to cover all scenarios of short/long GRBs, rate/image triggers, and real/false positives.
- 3) For all the mask-weighted lightcurves, the y-axis units are counts/sec/det where a det is 0.4 x 0.4 = 0.16 sq cm.
- 4) The verticle lines correspond to following: green dotted lines are T50 interval, black dotted lines are T90 interval, blue solid line(s) is a spacecraft slew start time, and orange solid line(s) is a spacecraft slew end time.
- 5) Time of each bin is in the middle of the bin.
1 s binning
From T0-310 s to T0+310 s
From T100_start - 20 s to T100_end + 30 s
Full time interval
64 ms binning
Full time interval
From T100_start to T100_end
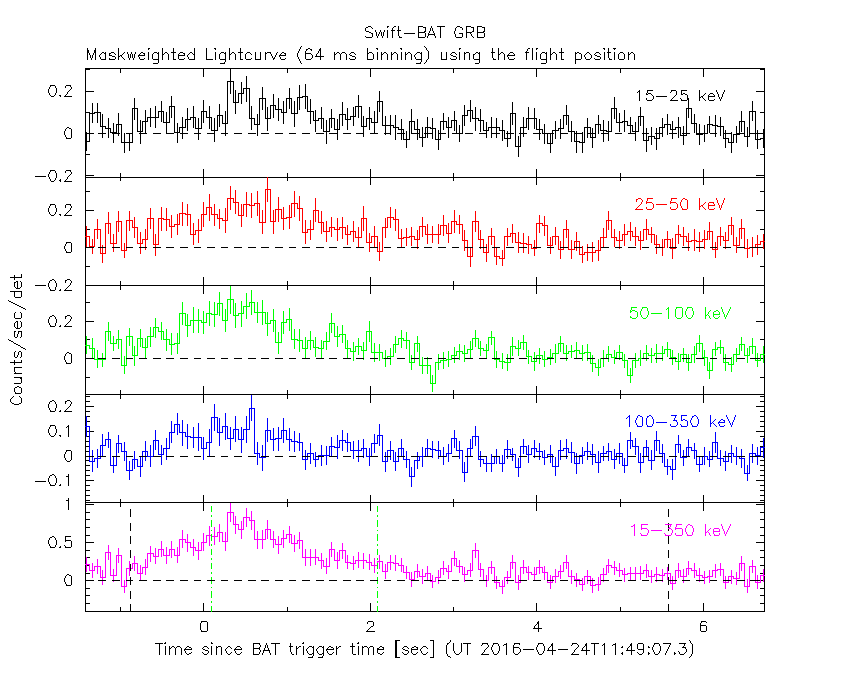
From T0-5 sec to T0+5 sec

16 ms binning
From T100_start-5 s to T100_start+5 s
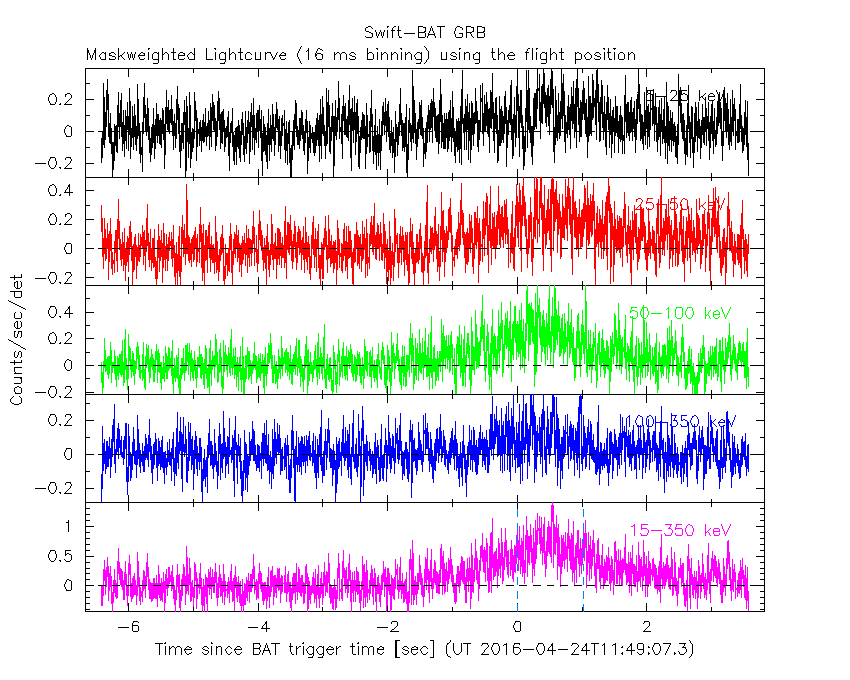
Blue+Cyan dotted lines: Time interval of the scaled map
From 0.000000 to 1.024000
8 ms binning
From T100_start-3 s to T100_start+3 s
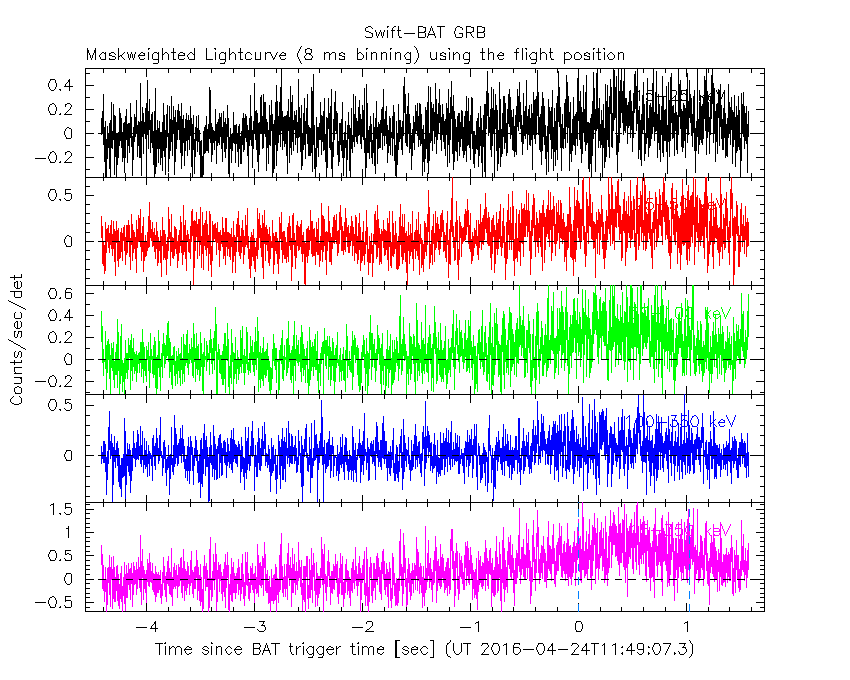
Blue+Cyan dotted lines: Time interval of the scaled map
From 0.000000 to 1.024000
2 ms binning
From T100_start-1 s to T100_start+1 s
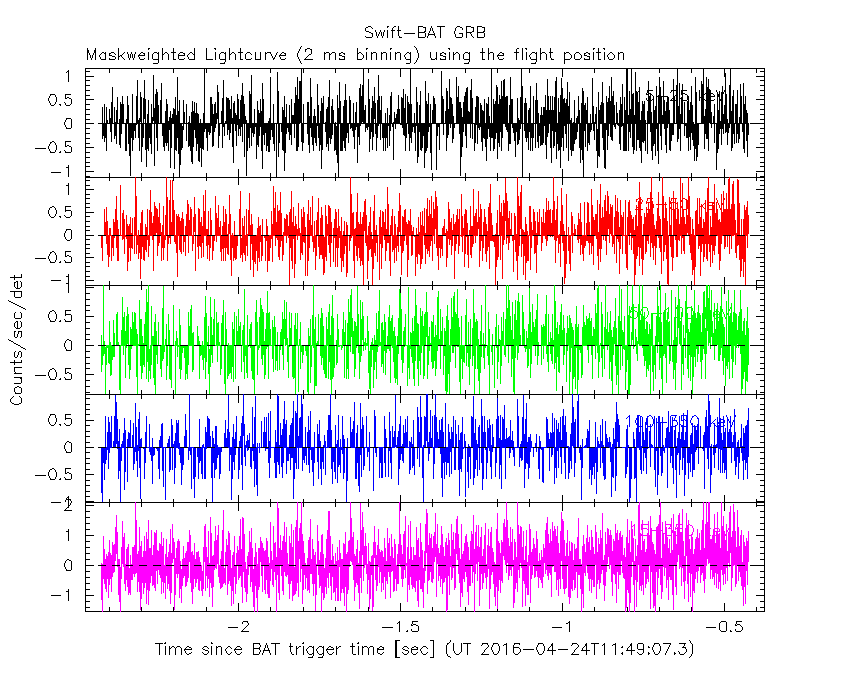
Blue+Cyan dotted lines: Time interval of the scaled map
From 0.000000 to 1.024000
SN=5 or 10 sec. binning (whichever binning is satisfied first)
SN=5 or 10 sec. binning (T < 200 sec)
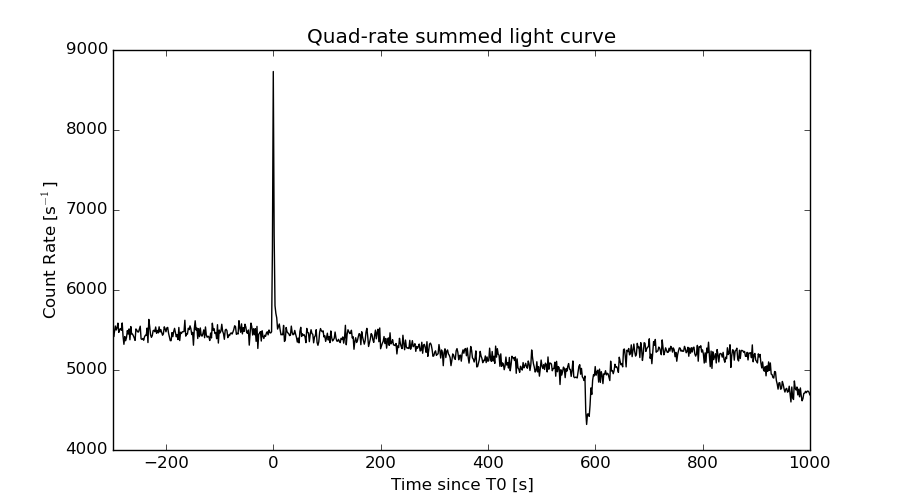
Quad-rate summed light curves (from T0-300s to T0+1000s)
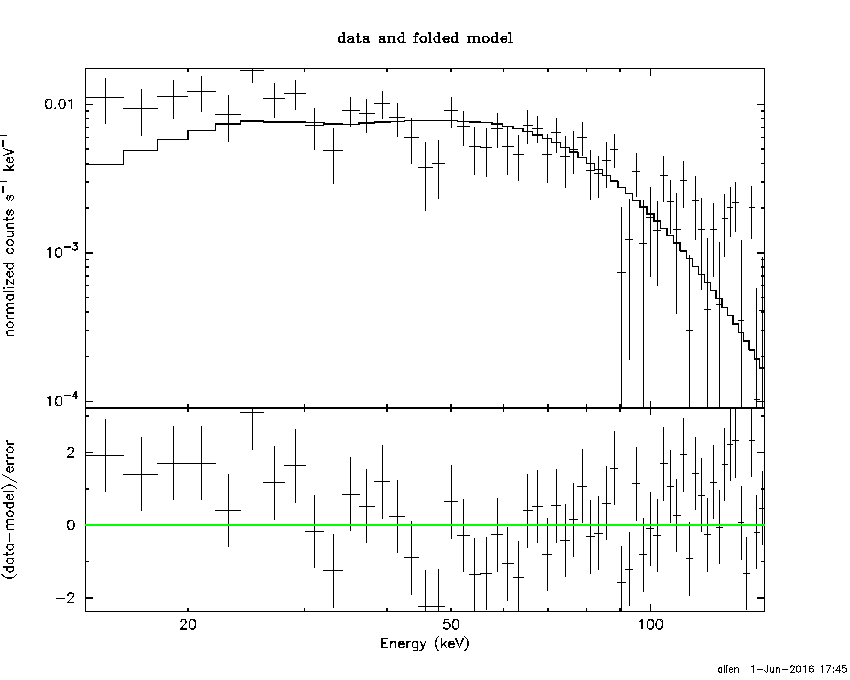
Spectral Evolution
Spectra
Notes:
- 1) The fitting includes the systematic errors.
- 2) When the burst includes telescope slew time periods, the fitting uses an average response file made from multiple 5-s response files through out the slew time plus single time preiod for the non-slew times, and weighted by the total counts in the corresponding time period using addrmf. An average response file is needed becuase a spectral fit using the pre-slew DRM will introduce some errors in both a spectral shape and a normalization if the PHA file contains a lot of the slew/post-slew time interval.
- 3) For fits to more complicated models (e.g. a power-law over a cutoff power-law), the BAT team has decided to require a chi-square improvement of more than 6 for each extra dof.
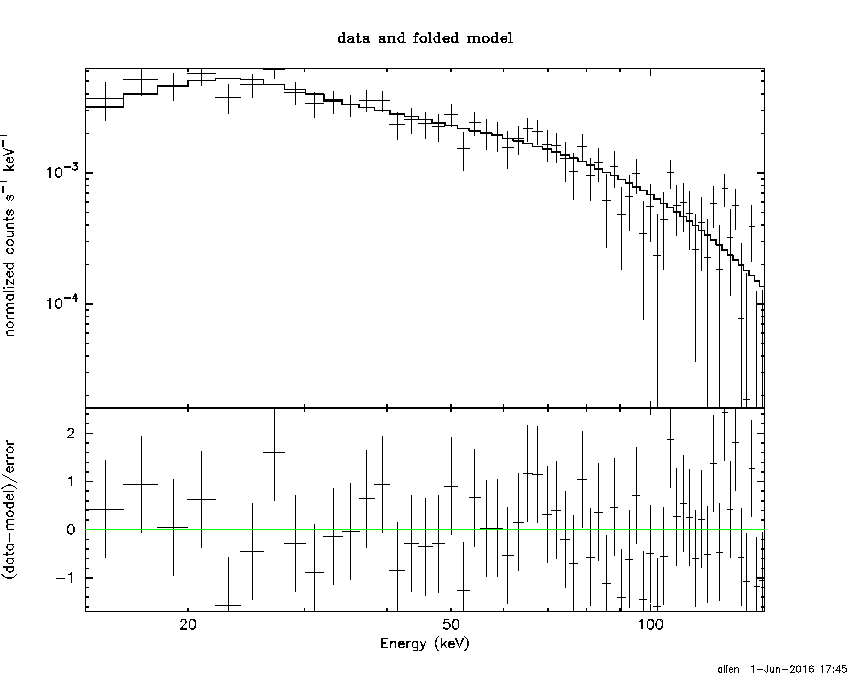
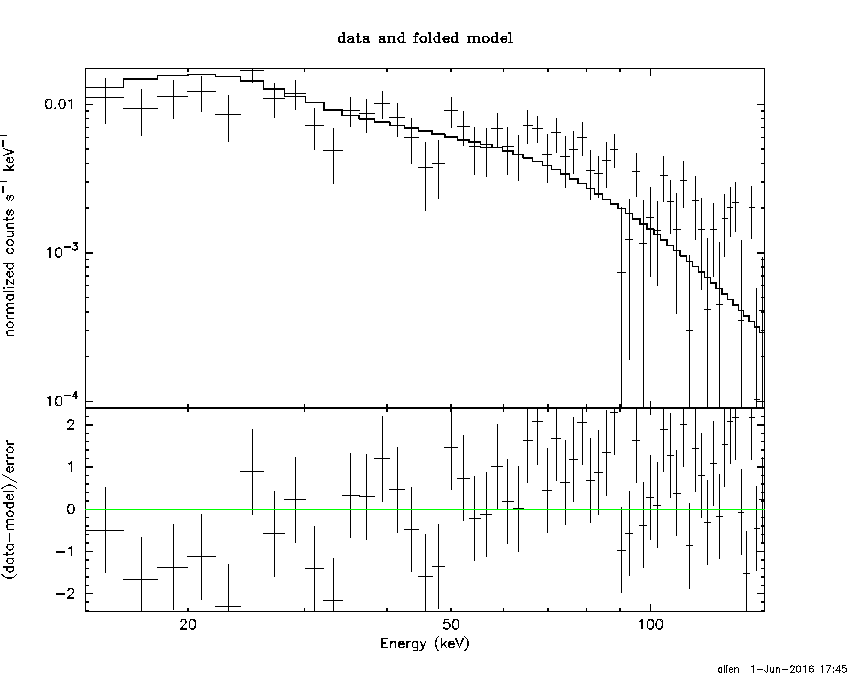
Time averaged spectrum fit using the average DRM
Power-law model
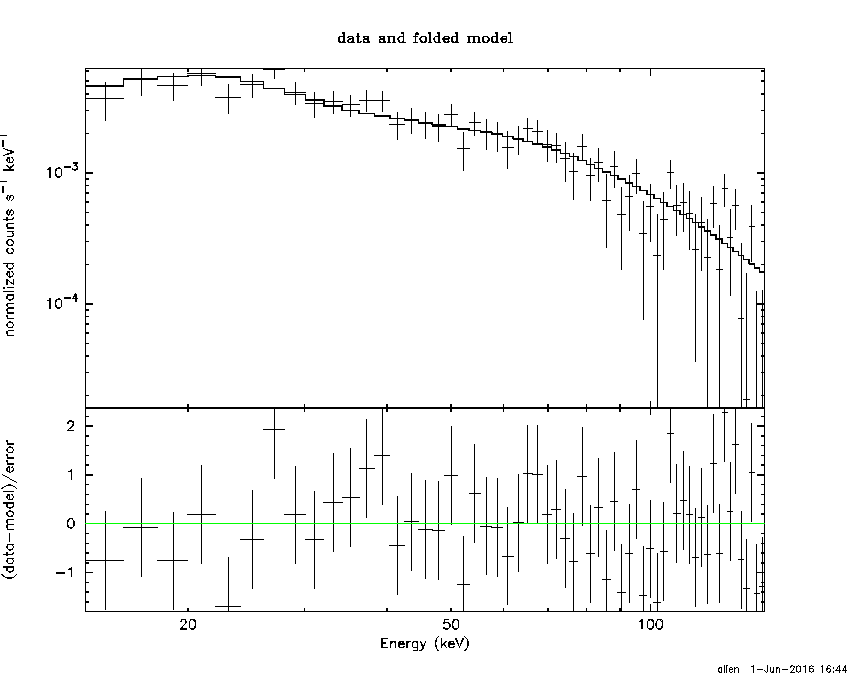
Time interval is from   -1.424 sec. to    6.736 sec.

Spectral model in power-law:
------------------------------------------------------------
Parameters  : value       lower 90%   higher 90%
Photon index: 1.40043     ( -0.104163   0.103983 )
Norm@50keV  : 1.57901E-02    ( -0.000952744   0.00095257 )
------------------------------------------------------------
#Fit statistic : Chi-Squared =          50.79 using 59 PHA bins.
# Reduced chi-squared =         0.8911 for     57 degrees of freedom
# Null hypothesis probability =   7.057564e-01

Photon flux (15-150 keV)    in 8.16 sec: 1.92316 ( -0.12274  0.12301 ) ph/cm2/s
Energy fluence (15-150 keV)             : 1.24506e-06 ( -8.04519e-08  8.06845e-08 ) ergs/cm2
Cutoff power-law model

Time interval is from   -1.424 sec. to    6.736 sec.
Spectral model in the cutoff power-law:
------------------------------------------------------------
Parameters  : value       lower 90%   higher 90%
Photon index: 1.10461     ( -0.439562   0.341897 )
Epeak [keV] : 163.538      ( -67.6566 -163.538 )
Norm@50keV  : 2.18320E-02    ( -0.0065832   0.0130122 )
------------------------------------------------------------
#Fit statistic : Chi-Squared =          49.22 using 59 PHA bins.
# Reduced chi-squared =         0.8789 for     56 degrees of freedom
# Null hypothesis probability =   7.273753e-01

Photon flux (15-150 keV)    in 8.16 sec: 1.89858 ( -0.12706  0.12726 ) ph/cm2/s
Energy fluence (15-150 keV)             : 1.22693e-06 ( -8.53128e-08  8.47571e-08 ) ergs/cm2
Band function

Time interval is from   -1.424 sec. to    6.736 sec.

Spectral model in the Band function:
------------------------------------------------------------
Parameters  : value       lower 90%   higher 90%
alpha       : -0.193739   ( -1.0817   0.466058 )
beta        : -1.53048    ( 1.52973   0.170736 )
Epeak [keV] : 54.7027      ( -28.6934 226.496 )
Norm@50keV   : 8.35509E-02    ( -0.087373   531.067 )
------------------------------------------------------------
#Fit statistic : Chi-Squared =          47.84 using 59 PHA bins.
# Reduced chi-squared =         0.8698 for     55 degrees of freedom
# Null hypothesis probability =   7.422521e-01

Photon flux (15-150 keV)    in 8.16 sec:  (    ) ph/cm2/s
Energy fluence (15-150 keV)             : 0 ( 0  0 ) ergs/cm2
Single BB
Spectral model blackbody:
------------------------------------------------------------
Parameters  : value    Lower 90%  Upper 90%
kT [keV]    : 16.9525  (-1.29618  1.43032)
R^2/D10^2   : 0.146476  (-0.036019   0.0469037)
(R is the radius in km and D10 is the distance to the source in units of 10 kpc)
------------------------------------------------------------
#Fit statistic : Chi-Squared =         105.94 using 59 PHA bins.
# Reduced chi-squared =         1.8586 for     57 degrees of freedom
# Null hypothesis probability =   8.907396e-05

Energy  Fluence     90% Error
[keV]   [erg/cm2]   [erg/cm2]
15- 25  7.001e-08   8.654e-09
25- 50  3.091e-07   2.538e-08
50-150  6.336e-07   6.654e-08
15-150  1.013e-06   7.385e-08
Thermal bremsstrahlung (OTTB)
Spectral model: thermal bremsstrahlung
------------------------------------------------------------
Parameters  : value         Lower 90%    Upper 90%
kT [keV]    : 200.000       (-19.3956      -200)
Norm        : 8.02955       (-0.485924     0.485924)
------------------------------------------------------------
#Fit statistic : Chi-Squared =          56.42 using 59 PHA bins.
# Reduced chi-squared =         0.9898 for     57 degrees of freedom
# Null hypothesis probability =   4.968706e-01

Energy  Fluence     90% Error
[keV]   [erg/cm2]   [erg/cm2]
15- 25  1.632e-07   1.183e-08
25- 50  3.138e-07   2.301e-08
50-150  6.883e-07   1.565e-07
15-150  1.165e-06   1.506e-07
Double BB
Spectral model: bbodyrad<1> + bbodyrad<2>
------------------------------------------------------------
Parameters  : value         Lower 90%    Upper 90%
kT1 [keV]   : 8.72445        (-1.77385      1.99535)
R1^2/D10^2  : 0.935258        (-0.421544      0.955291)
kT2 [keV]   : 33.2451        (-7.63739      18.0674)
R2^2/D10^2  : 1.12273E-02    (-0.00818063   0.0170195)
------------------------------------------------------------
#Fit statistic : Chi-Squared =          49.22 using 59 PHA bins.
# Reduced chi-squared =         0.8948 for     55 degrees of freedom
# Null hypothesis probability =   6.942592e-01

Energy  Fluence     90% Error
[keV]   [erg/cm2]   [erg/cm2]
15- 25  1.260e-07   3.481e-08
25- 50  3.202e-07   6.230e-08
50-150  7.873e-07   3.461e-07
15-150  1.234e-06   3.753e-07
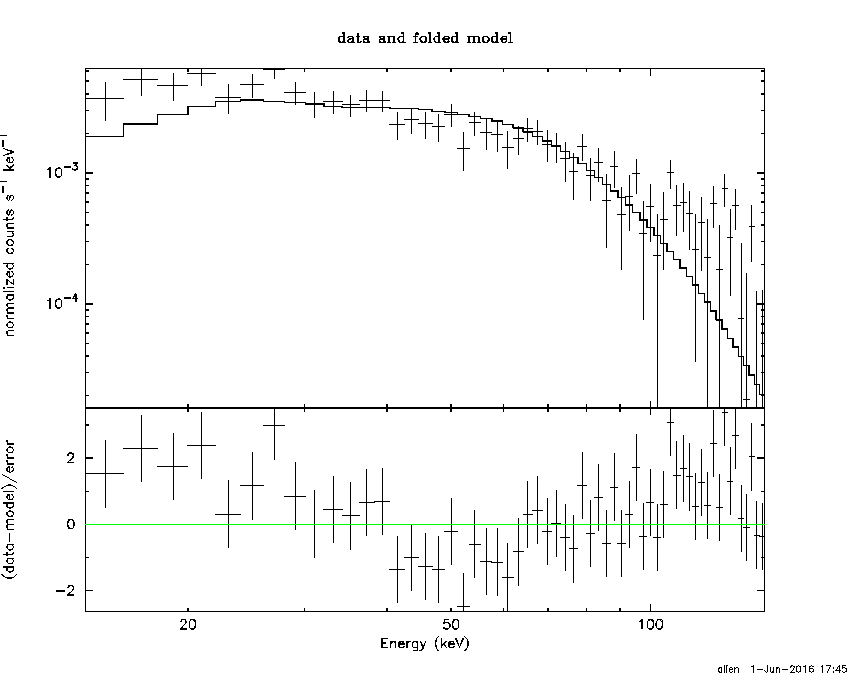
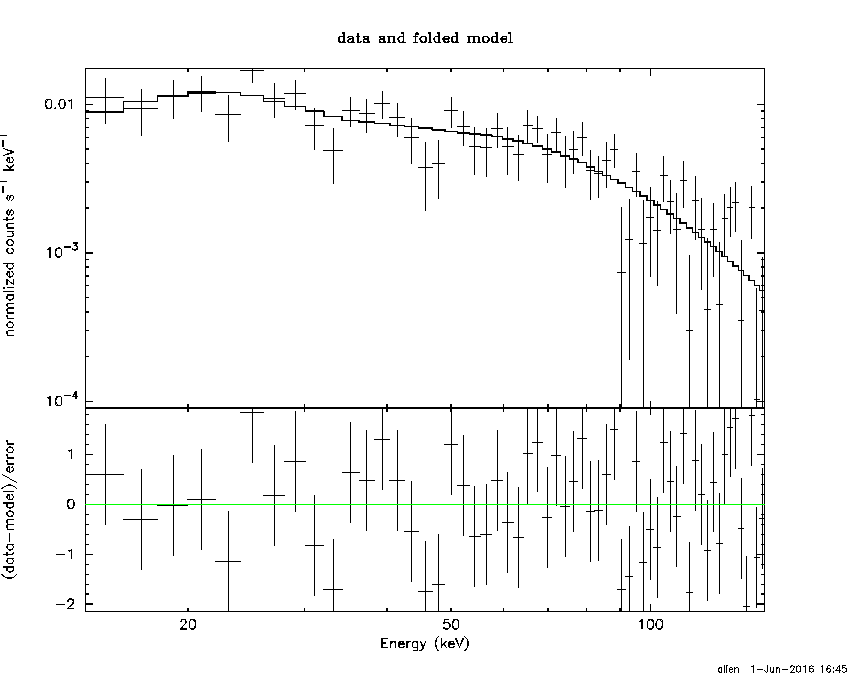
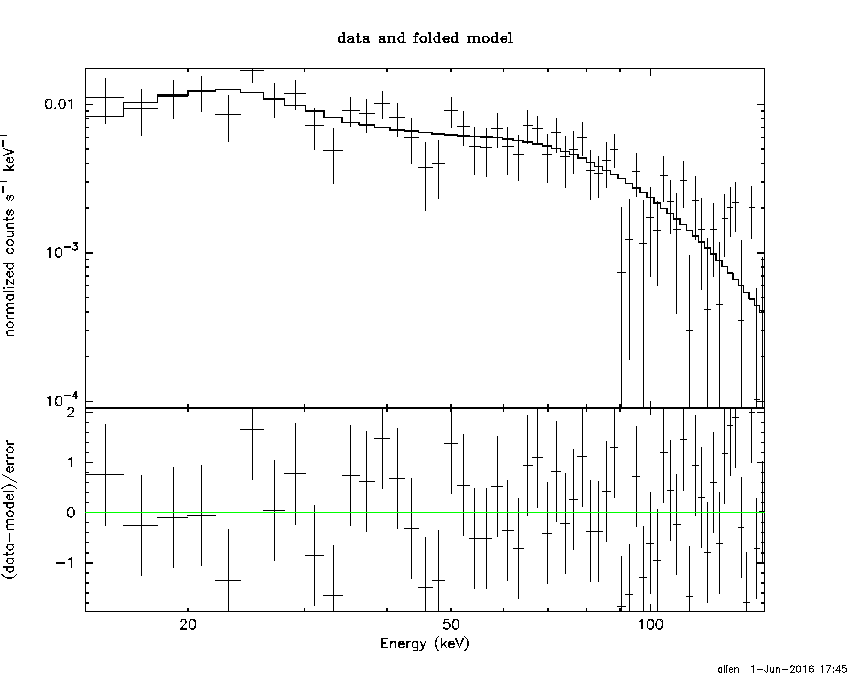
Peak spectrum fit
Power-law model

Time interval is from    0.068 sec. to    1.068 sec.

Spectral model in power-law:
------------------------------------------------------------
Parameters  : value       lower 90%   higher 90%
Photon index: 1.14321     ( -0.130175   0.129078 )
Norm@50keV  : 4.36651E-02    ( -0.00331107   0.0033054 )
------------------------------------------------------------
#Fit statistic : Chi-Squared =          62.75 using 59 PHA bins.
# Reduced chi-squared =          1.101 for     57 degrees of freedom
# Null hypothesis probability =   2.797050e-01

Photon flux (15-150 keV)    in 1 sec: 5.08819 ( -0.40038  0.40112 ) ph/cm2/s
Energy fluence (15-150 keV)             : 4.50474e-07 ( -3.65792e-08  3.67291e-08 ) ergs/cm2
Cutoff power-law model
Time interval is from    0.068 sec. to    1.068 sec.
Spectral model in the cutoff power-law:
------------------------------------------------------------
Parameters  : value       lower 90%   higher 90%
Photon index: 0.878850     ( -0.551403   0.327243 )
Epeak [keV] : 248.160      ( -248.16 -248.16 )
Norm@50keV  : 5.71722E-02    ( -0.0160036   0.0409074 )
------------------------------------------------------------
#Fit statistic : Chi-Squared =          61.94 using 59 PHA bins.
# Reduced chi-squared =          1.106 for     56 degrees of freedom
# Null hypothesis probability =   2.724556e-01

Photon flux (15-150 keV)    in 1 sec: 1.46068 ( -0.700342  0.42559 ) ph/cm2/s
Energy fluence (15-150 keV)             : 4.47208e-07 ( -3.75891e-08  3.74551e-08 ) ergs/cm2
Band function
Time interval is from    0.068 sec. to    1.068 sec.

Spectral model in the Band function:
------------------------------------------------------------
Parameters  : value       lower 90%   higher 90%
alpha       : -0.890464   ( 0.733515   0.733515 )
beta        : -4.09615    ( 8.79332   18.7531 )
Epeak [keV] : 259.635      ( -124.293 -259.581 )
Norm@50keV   : 5.64053E-02    ( -0.00658276   0.0140523 )
------------------------------------------------------------
#Fit statistic : Chi-Squared =          61.95 using 59 PHA bins.
# Reduced chi-squared =          1.126 for     55 degrees of freedom
# Null hypothesis probability =   2.421543e-01

Photon flux (15-150 keV)    in 1 sec:  (    ) ph/cm2/s
Energy fluence (15-150 keV)             : 0 ( 0  0 ) ergs/cm2
Single BB
Spectral model blackbody:
------------------------------------------------------------
Parameters  : value    Lower 90%  Upper 90%
kT [keV]    : 21.1635  (-1.99673  2.2779)
R^2/D10^2   : 0.201905  (-0.057095   0.0768741)
(R is the radius in km and D10 is the distance to the source in units of 10 kpc)
------------------------------------------------------------
#Fit statistic : Chi-Squared =          92.64 using 59 PHA bins.
# Reduced chi-squared =          1.625 for     57 degrees of freedom
# Null hypothesis probability =   1.984153e-03

Energy  Fluence     90% Error
[keV]   [erg/cm2]   [erg/cm2]
15- 25  1.703e-08   2.600e-09
25- 50  8.795e-08   9.365e-09
50-150  2.938e-07   3.800e-08
15-150  3.987e-07   3.610e-08
Thermal bremsstrahlung (OTTB)
Spectral model: thermal bremsstrahlung
------------------------------------------------------------
Parameters  : value         Lower 90%    Upper 90%
kT [keV]    : 200.000       (-14.161      -200)
Norm        : 21.1753       (-1.64372     1.64372)
------------------------------------------------------------
#Fit statistic : Chi-Squared =          90.84 using 59 PHA bins.
# Reduced chi-squared =          1.594 for     57 degrees of freedom
# Null hypothesis probability =   2.913115e-03

Energy  Fluence     90% Error
[keV]   [erg/cm2]   [erg/cm2]
15- 25  5.274e-08   4.975e-09
25- 50  1.015e-07   2.094e-08
50-150  2.225e-07   7.138e-08
15-150  3.767e-07   9.220e-08
Double BB
Spectral model: bbodyrad<1> + bbodyrad<2>
------------------------------------------------------------
Parameters  : value         Lower 90%    Upper 90%
kT1 [keV]   : 6.78074        (-1.89489      2.70301)
R1^2/D10^2  : 4.22597        (-2.79853      10.1947)
kT2 [keV]   : 29.4370        (-4.76117      8.6989)
R2^2/D10^2  : 6.09540E-02    (-0.0352503   0.0504421)
------------------------------------------------------------
#Fit statistic : Chi-Squared =          61.54 using 59 PHA bins.
# Reduced chi-squared =          1.119 for     55 degrees of freedom
# Null hypothesis probability =   2.535340e-01

Energy  Fluence     90% Error
[keV]   [erg/cm2]   [erg/cm2]
15- 25  3.852e-08   1.795e-08
25- 50  8.997e-08   2.435e-08
50-150  3.211e-07   8.060e-08
15-150  4.496e-07   1.098e-07
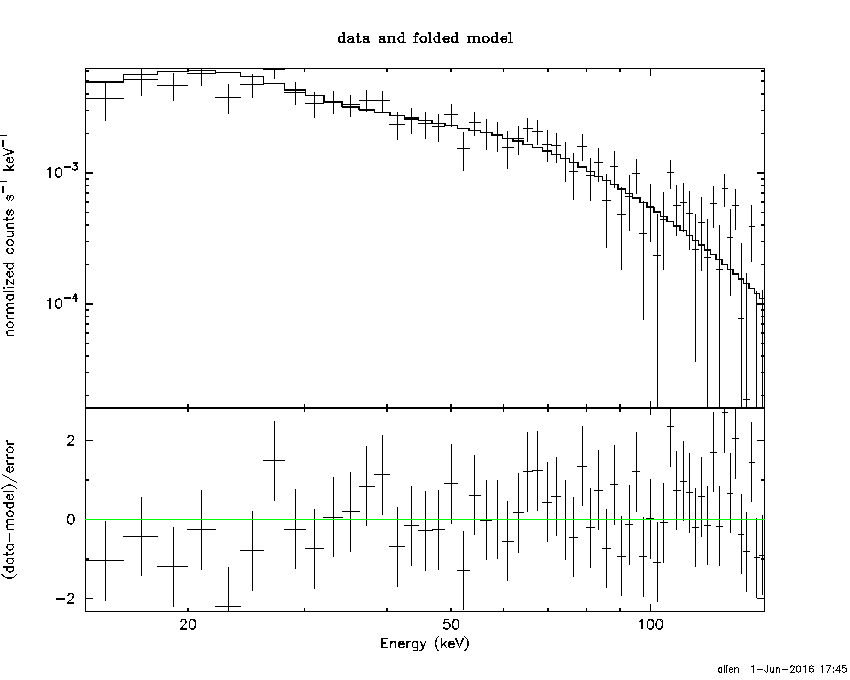
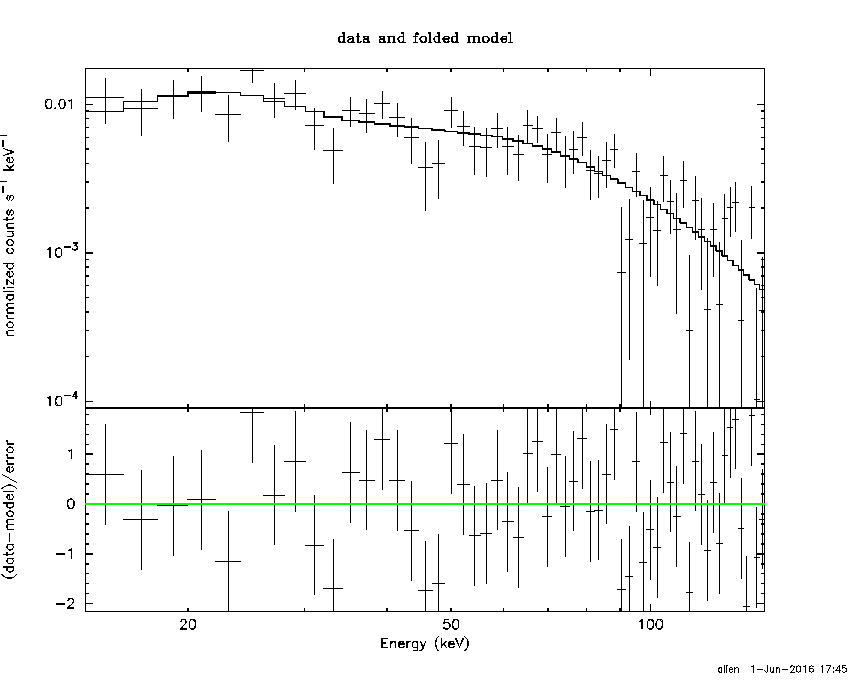
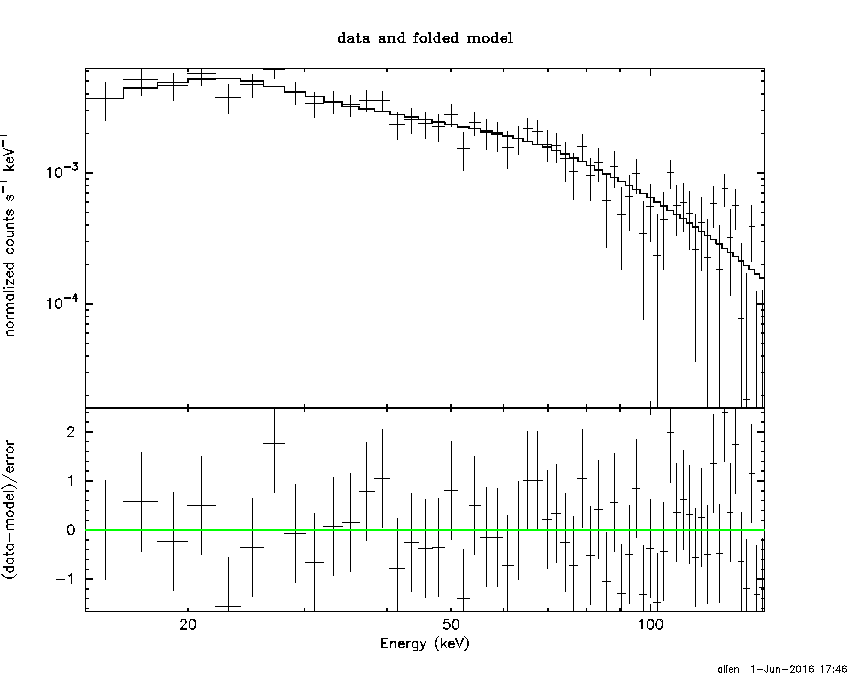
Pre-slew spectrum (Pre-slew PHA with pre-slew DRM)
Power-law model

Spectral model in power-law:
------------------------------------------------------------
Parameters  : value       lower 90%   higher 90%
Photon index: 1.40043     ( -0.104163   0.103983 )
Norm@50keV  : 1.57901E-02    ( -0.000952744   0.00095257 )
------------------------------------------------------------
#Fit statistic : Chi-Squared =          50.79 using 59 PHA bins.
# Reduced chi-squared =         0.8911 for     57 degrees of freedom
# Null hypothesis probability =   7.057564e-01

Photon flux (15-150 keV)    in 8.16 sec: 1.92312 ( -0.122726  0.123001 ) ph/cm2/s
Energy fluence (15-150 keV)             : 1.2449e-06 ( -8.04928e-08  8.07029e-08 ) ergs/cm2
Cutoff power-law model

Spectral model in the cutoff power-law:
------------------------------------------------------------
Parameters  : value       lower 90%   higher 90%
Photon index: 1.10461     ( -0.439562   0.341897 )
Epeak [keV] : 163.538      ( -67.6566 -163.538 )
Norm@50keV  : 2.18320E-02    ( -0.0065832   0.0130122 )
------------------------------------------------------------
#Fit statistic : Chi-Squared =          49.22 using 59 PHA bins.
# Reduced chi-squared =         0.8789 for     56 degrees of freedom
# Null hypothesis probability =   7.273753e-01

Photon flux (15-150 keV)    in 8.16 sec: 1.89839 ( -0.12703  0.12721 ) ph/cm2/s
Energy fluence (15-150 keV)             : 1.22741e-06 ( -8.54434e-08  8.4815e-08 ) ergs/cm2
Band function
Spectral model in the Band function:
------------------------------------------------------------
Parameters  : value       lower 90%   higher 90%
alpha       : -0.193739   ( -1.0817   0.466058 )
beta        : -1.53048    ( 1.52973   0.170736 )
Epeak [keV] : 54.7027      ( -28.6981 218.391 )
Norm@50keV   : 8.35509E-02    ( -0.087373   536.621 )
------------------------------------------------------------
#Fit statistic : Chi-Squared =          47.84 using 59 PHA bins.
# Reduced chi-squared =         0.8698 for     55 degrees of freedom
# Null hypothesis probability =   7.422521e-01

Photon flux (15-150 keV)    in 8.16 sec:  (    ) ph/cm2/s
Energy fluence (15-150 keV)             : 0 ( 0  0 ) ergs/cm2
S(25-50 keV) vs. S(50-100 keV) plot
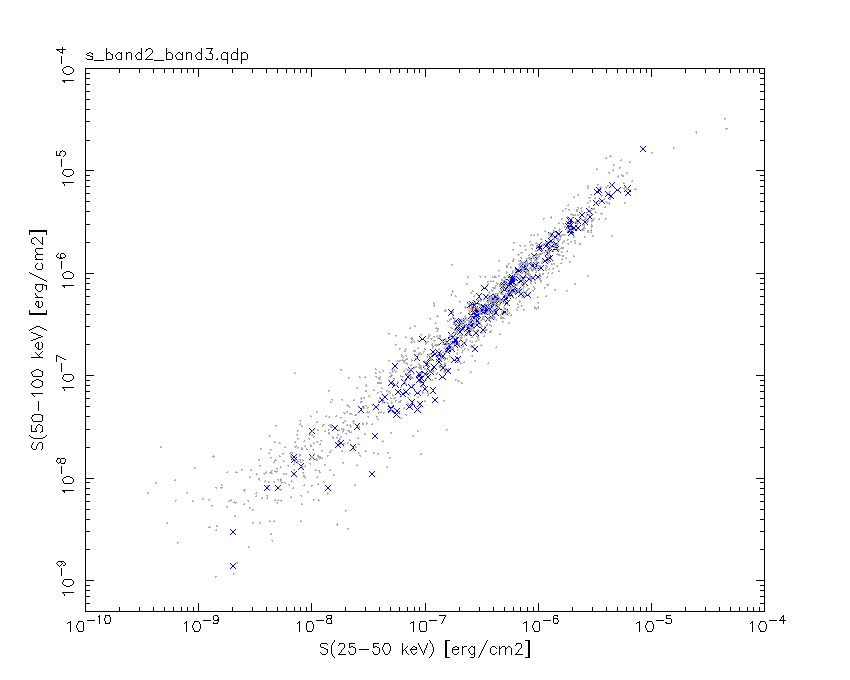
S(25-50 keV)  = 2.93e-07
S(50-100 keV) = 4.44e-07
T90 vs. Hardness ratio plot
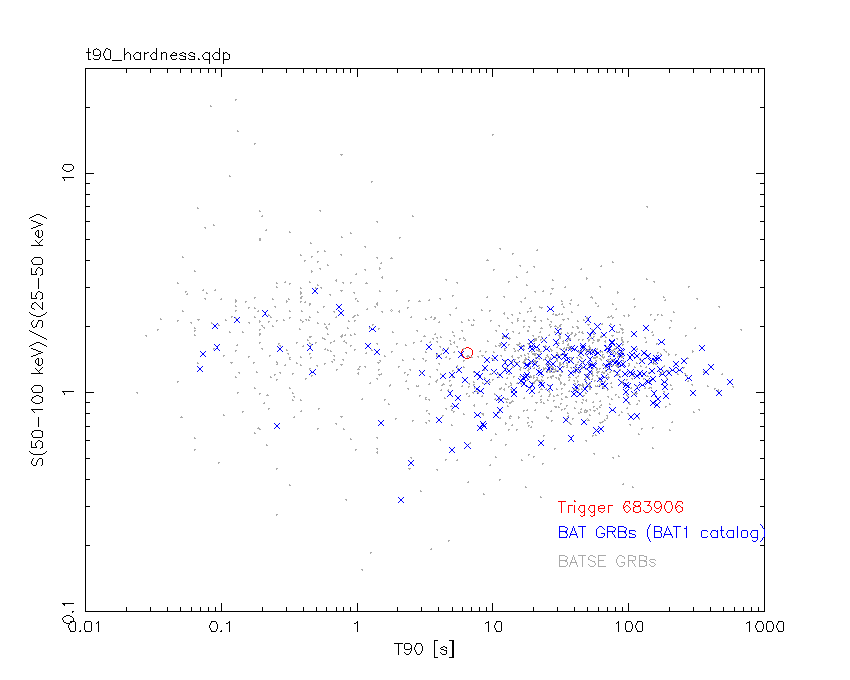
T90                                   = 6.4640000462532 sec.
Hardness ratio (energy fluence ratio) = 1.51536
Color vs. Color plot

Count Ratio  (25-50 keV) / (15-25 keV) = 1.75097
Count Ratio (50-100 keV) / (15-25 keV) = 1.44676
Mask shadow pattern
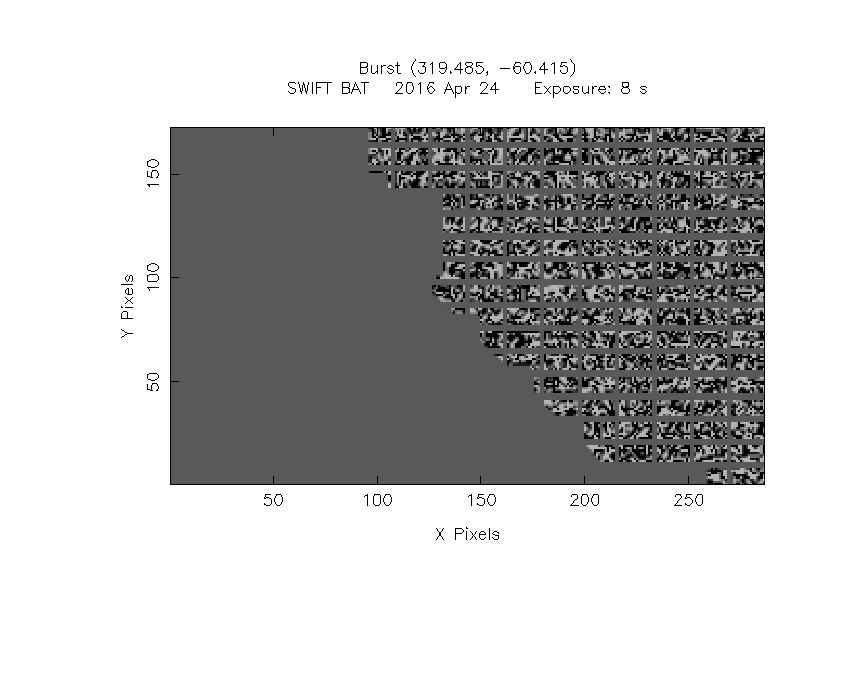
IMX = -9.699563817779852E-01, IMY = -1.243905168047467E-01
TIME vs. PHA plot around the trigger time
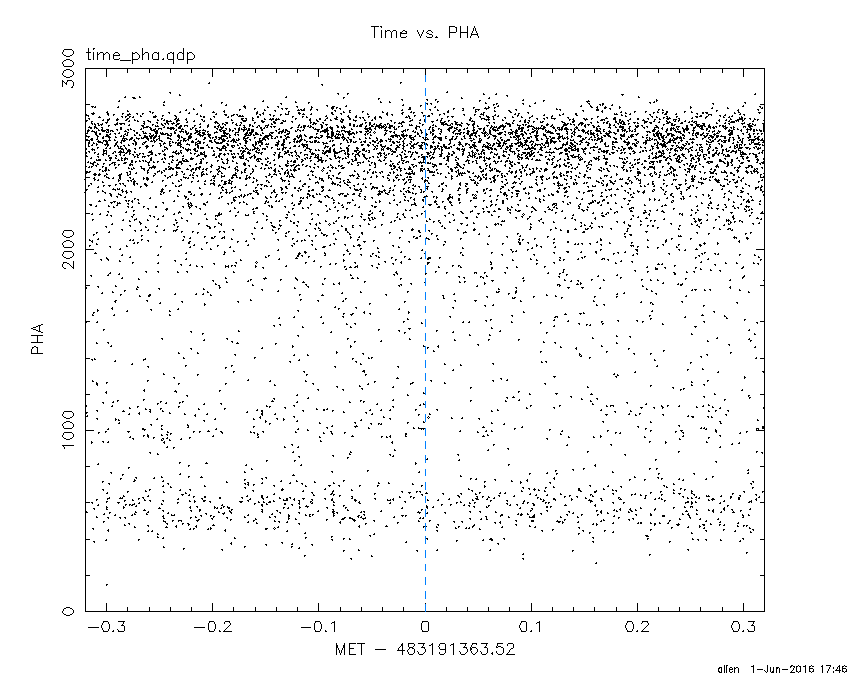
Blue+Cyan dotted lines: Time interval of the scaled map
From 0.000000 to 1.024000
TIME vs. DetID plot around the trigger time
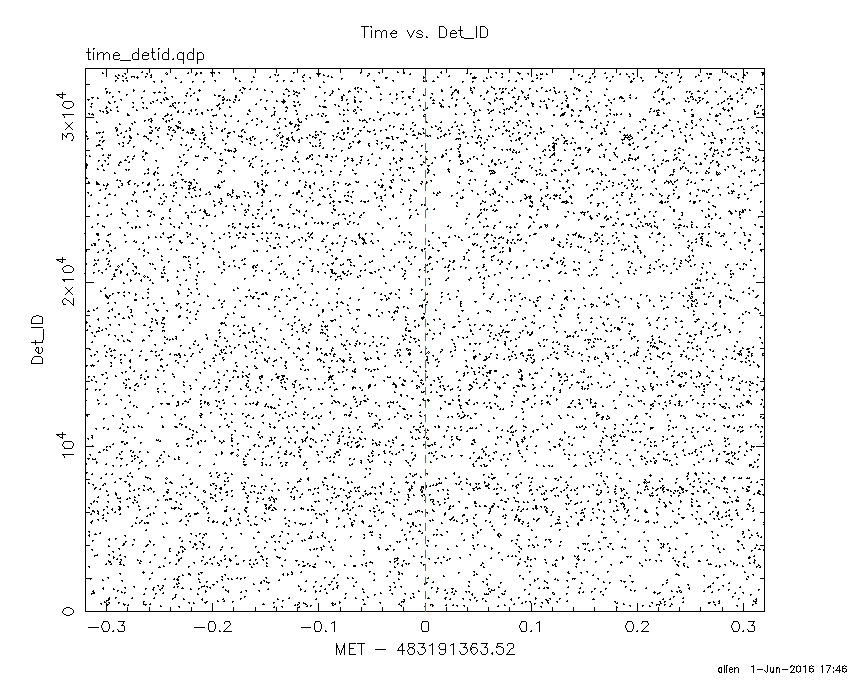
Blue+Cyan dotted lines: Time interval of the scaled map
From 0.000000 to 1.024000
100 us light curve (15-350 keV)
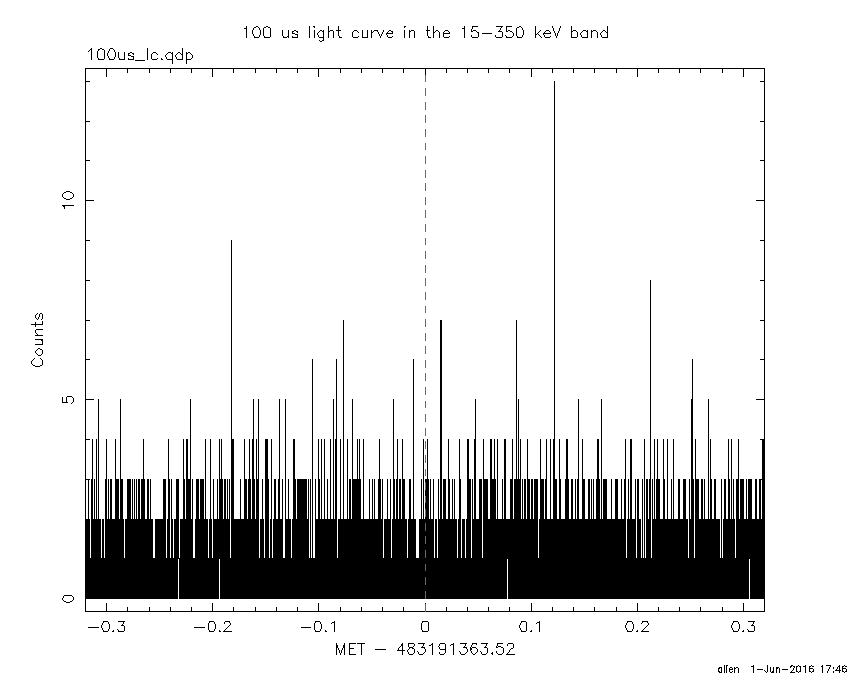
Blue+Cyan dotted lines: Time interval of the scaled map
From 0.000000 to 1.024000
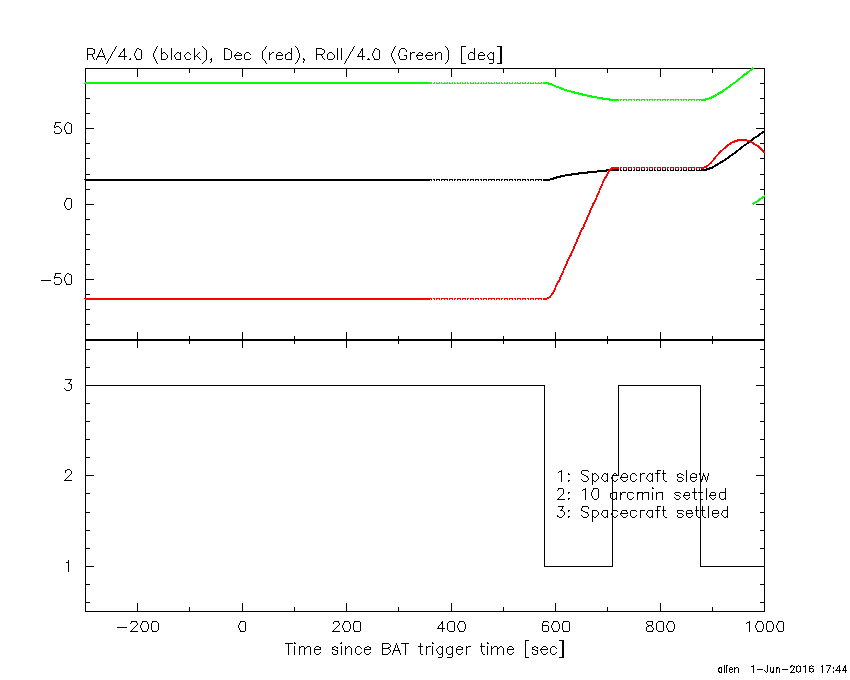
Spacecraft aspect plot
Bright source in the pre-burst/pre-slew/post-slew images
Pre-burst image of 15-350 keV band
Time interval of the image:
-239.520000 -1.424000

# RAcent  DECcent POSerr Theta    Phi  PeakCts   SNR AngSep     Name
#  [deg]    [deg]    ['] [deg]  [deg]                   [']
135.6687 -40.6234    6.0  46.4   46.1   1.6008   1.9    7.6	Vela X-1
104.6806 -52.9156    2.4  23.1   33.3   1.1585   4.8 ------	UNKNOWN
 99.8563 -41.7114    2.3  29.6   11.1   1.2329   5.1 ------	UNKNOWN
320.3496 -56.2678    3.0  47.3  176.8   1.8980   3.8 ------	UNKNOWN
 93.7130 -10.5784    3.0  56.2  -14.9   3.0955   3.8 ------	UNKNOWN
  5.0720 -32.0317    3.3  48.0 -129.3   3.8927   3.5 ------	UNKNOWN
 54.2818 -19.5420    2.8  43.8  -64.2   4.5285   4.0 ------	UNKNOWN
Pre-slew background subtracted image of 15-350 keV band
Time interval of the image:
-1.424000 6.736000

# RAcent  DECcent POSerr Theta    Phi  PeakCts   SNR AngSep     Name
#  [deg]    [deg]    ['] [deg]  [deg]                   [']
135.3633 -40.4235   13.2  46.4   45.7  -0.1302  -0.9   10.9	Vela X-1
319.4846 -60.4081    0.5  44.4  172.7   1.8509  25.5 ------	UNKNOWN
Post-slew image of 15-350 keV band
Time interval of the image:
709.680610 876.780600

# RAcent  DECcent POSerr Theta    Phi  PeakCts   SNR AngSep     Name
#  [deg]    [deg]    ['] [deg]  [deg]                   [']
 83.6379  22.0151    0.3   6.7 -114.7   6.9352  44.2    0.3	Crab
 78.3784  77.4458    2.6  53.5  -10.1   2.1659   4.5 ------	UNKNOWN
 50.3976  79.1184    2.3  57.7  -15.1   3.7129   5.0 ------	UNKNOWN
 30.2752  70.9636    3.4  57.6  -26.4   3.3169   3.4 ------	UNKNOWN
Plot creation:
Wed Jun  1 17:46:36 EDT 2016