Estimated redshift from machine learning (Ukwatta et al. 2016) - may take a few minute to calcaulte
Image
Pre-slew 15.0-350.0 keV image (Event data)
#   RAcent    DECcent   POSerr    Theta     Phi              Peak Cts       SNR   Name
  280.3395   -54.3431   0.0373    24.6767  -127.0068         0.9256070      5.152 TRIG_00684098

Foreground time interval of the image:
 -0.532 140.781 (delta_t = 141.313 [sec])
Background time interval of the image:
-239.520  -0.532 (delta_t = 238.988 [sec])
Lightcurves
Notes:
- 1) The mask-weighted light curves are using the flight position.
- 2) Multiple plots of different time binning/intervals are shown to cover all scenarios of short/long GRBs, rate/image triggers, and real/false positives.
- 3) For all the mask-weighted lightcurves, the y-axis units are counts/sec/det where a det is 0.4 x 0.4 = 0.16 sq cm.
- 4) The verticle lines correspond to following: green dotted lines are T50 interval, black dotted lines are T90 interval, blue solid line(s) is a spacecraft slew start time, and orange solid line(s) is a spacecraft slew end time.
- 5) Time of each bin is in the middle of the bin.
1 s binning
From T0-310 s to T0+310 s

From T100_start - 20 s to T100_end + 30 s

Full time interval

64 ms binning
Full time interval

From T100_start to T100_end

From T0-5 sec to T0+5 sec
16 ms binning
From T100_start-5 s to T100_start+5 s

Blue+Cyan dotted lines: Time interval of the scaled map
From 0.000000 to 0.256000
8 ms binning
From T100_start-3 s to T100_start+3 s

Blue+Cyan dotted lines: Time interval of the scaled map
From 0.000000 to 0.256000
2 ms binning
From T100_start-1 s to T100_start+1 s

Blue+Cyan dotted lines: Time interval of the scaled map
From 0.000000 to 0.256000
SN=5 or 10 sec. binning (whichever binning is satisfied first)

SN=5 or 10 sec. binning (T < 200 sec)
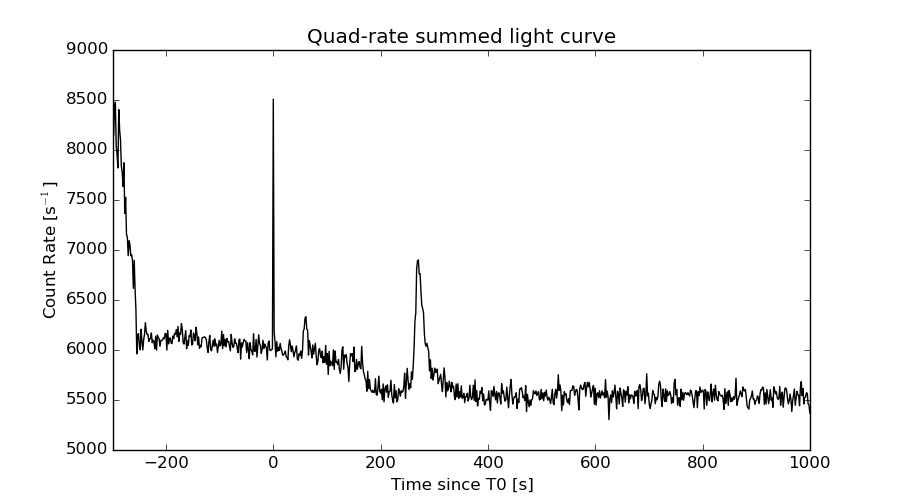
Quad-rate summed light curves (from T0-300s to T0+1000s)
Spectral Evolution

Spectra
Notes:
- 1) The fitting includes the systematic errors.
- 2) When the burst includes telescope slew time periods, the fitting uses an average response file made from multiple 5-s response files through out the slew time plus single time preiod for the non-slew times, and weighted by the total counts in the corresponding time period using addrmf. An average response file is needed becuase a spectral fit using the pre-slew DRM will introduce some errors in both a spectral shape and a normalization if the PHA file contains a lot of the slew/post-slew time interval.
- 3) For fits to more complicated models (e.g. a power-law over a cutoff power-law), the BAT team has decided to require a chi-square improvement of more than 6 for each extra dof.
Time averaged spectrum fit using the average DRM
Power-law model

Time interval is from   -0.532 sec. to  319.800 sec.

Spectral model in power-law:
------------------------------------------------------------
Parameters  : value       lower 90%   higher 90%
Photon index: 2.17677     ( -0.171632   0.180775 )
Norm@50keV  : 6.70337E-04    ( -7.79085e-05   7.62261e-05 )
------------------------------------------------------------
#Fit statistic : Chi-Squared =          53.25 using 59 PHA bins.
# Reduced chi-squared =         0.9342 for     57 degrees of freedom
# Null hypothesis probability =   6.165036e-01

Photon flux (15-150 keV)    in 320.3 sec: 0.109649 ( -0.009081  0.009089 ) ph/cm2/s
Energy fluence (15-150 keV)             : 2.01278e-06 ( -1.9937e-07  2.03763e-07 ) ergs/cm2
Cutoff power-law model

Time interval is from   -0.532 sec. to  319.800 sec.
Spectral model in the cutoff power-law:
------------------------------------------------------------
Parameters  : value       lower 90%   higher 90%
Photon index: 2.21123     ( -0.576839   -1.99383 )
Epeak [keV] : 258.943      (   )
Norm@50keV  : 6.40787E-04    (     )
------------------------------------------------------------
#Fit statistic : Chi-Squared =          53.29 using 59 PHA bins.
# Reduced chi-squared =         0.9516 for     56 degrees of freedom
# Null hypothesis probability =   5.782096e-01

Photon flux (15-150 keV)    in 320.3 sec: 0.109364 ( -0.009064  0.009866 ) ph/cm2/s
Energy fluence (15-150 keV)             : 2.00871e-06 ( -1.97004e-07  2.22125e-07 ) ergs/cm2
Band function

Time interval is from   -0.532 sec. to  319.800 sec.

Spectral model in the Band function:
------------------------------------------------------------
Parameters  : value       lower 90%   higher 90%
alpha       : -2.71501   ( 2.71501   2.71501 )
beta        : -2.17676    ( -0.180779   0.171711 )
Epeak [keV] : 8.54879      ( -8.54879 -8.54879 )
Norm@50keV   : 9.11084E-02    ( -0.0105891   0.01036 )
------------------------------------------------------------
#Fit statistic : Chi-Squared =          53.25 using 59 PHA bins.
# Reduced chi-squared =         0.9682 for     55 degrees of freedom
# Null hypothesis probability =   5.417286e-01

Photon flux (15-150 keV)    in 320.3 sec:  (    ) ph/cm2/s
Energy fluence (15-150 keV)             : 0 ( 0  0 ) ergs/cm2
Single BB

Spectral model blackbody:
------------------------------------------------------------
Parameters  : value    Lower 90%  Upper 90%
kT [keV]    : 8.74130  (-0.891749  1.00643)
R^2/D10^2   : 8.04166E-02  (-0.0282315   0.043442)
(R is the radius in km and D10 is the distance to the source in units of 10 kpc)
------------------------------------------------------------
#Fit statistic : Chi-Squared =          90.39 using 59 PHA bins.
# Reduced chi-squared =          1.586 for     57 degrees of freedom
# Null hypothesis probability =   3.202343e-03

Energy  Fluence     90% Error
[keV]   [erg/cm2]   [erg/cm2]
15- 25  3.772e-07   5.612e-08
25- 50  7.655e-07   8.872e-08
50-150  2.669e-07   6.864e-08
15-150  1.409e-06   1.469e-07
Thermal bremsstrahlung (OTTB)

Spectral model: thermal bremsstrahlung
------------------------------------------------------------
Parameters  : value         Lower 90%    Upper 90%
kT [keV]    : 51.5317       (-11.538      17.2425)
Norm        : 0.599467       (-0.0879974     0.112833)
------------------------------------------------------------
#Fit statistic : Chi-Squared =          56.82 using 59 PHA bins.
# Reduced chi-squared =         0.9968 for     57 degrees of freedom
# Null hypothesis probability =   4.819599e-01

Energy  Fluence     90% Error
[keV]   [erg/cm2]   [erg/cm2]
15- 25  4.727e-07   5.557e-08
25- 50  6.861e-07   6.294e-08
50-150  6.852e-07   1.762e-07
15-150  1.844e-06   2.141e-07
Double BB

Spectral model: bbodyrad<1> + bbodyrad<2>
------------------------------------------------------------
Parameters  : value         Lower 90%    Upper 90%
kT1 [keV]   : 5.22910        (-1.25828      1.26151)
R1^2/D10^2  : 0.479123        (-0.267943      0.748496)
kT2 [keV]   : 19.0319        (-5.02999      9.0401)
R2^2/D10^2  : 2.72665E-03    (-0.00209082   0.00693325)
------------------------------------------------------------
#Fit statistic : Chi-Squared =          55.23 using 59 PHA bins.
# Reduced chi-squared =          1.004 for     55 degrees of freedom
# Null hypothesis probability =   4.659303e-01

Energy  Fluence     90% Error
[keV]   [erg/cm2]   [erg/cm2]
15- 25  5.071e-07   1.751e-07
25- 50  6.233e-07   2.027e-07
50-150  8.131e-07   4.485e-07
15-150  1.944e-06   7.061e-07
Peak spectrum fit
Power-law model

Time interval is from   -0.272 sec. to    0.728 sec.

Spectral model in power-law:
------------------------------------------------------------
Parameters  : value       lower 90%   higher 90%
Photon index: 1.54388     ( -0.134137   0.135831 )
Norm@50keV  : 2.24149E-02    ( -0.00183708   0.0018264 )
------------------------------------------------------------
#Fit statistic : Chi-Squared =          58.80 using 59 PHA bins.
# Reduced chi-squared =          1.032 for     57 degrees of freedom
# Null hypothesis probability =   4.092957e-01

Photon flux (15-150 keV)    in 1 sec: 2.83267 ( -0.2263  0.22649 ) ph/cm2/s
Energy fluence (15-150 keV)             : 2.11232e-07 ( -1.87412e-08  1.88963e-08 ) ergs/cm2
Cutoff power-law model

Time interval is from   -0.272 sec. to    0.728 sec.
Spectral model in the cutoff power-law:
------------------------------------------------------------
Parameters  : value       lower 90%   higher 90%
Photon index: 1.25820     ( -0.523176   0.356223 )
Epeak [keV] : 129.068      (   )
Norm@50keV  : 3.14208E-02    (     )
------------------------------------------------------------
#Fit statistic : Chi-Squared =          57.74 using 59 PHA bins.
# Reduced chi-squared =          1.031 for     56 degrees of freedom
# Null hypothesis probability =   4.106203e-01

Photon flux (15-150 keV)    in 1 sec: 2.80362 ( -0.23  0.23138 ) ph/cm2/s
Energy fluence (15-150 keV)             : 2.07195e-07 ( -2.01225e-08  2.00582e-08 ) ergs/cm2
Band function

Time interval is from   -0.272 sec. to    0.728 sec.

Spectral model in the Band function:
------------------------------------------------------------
Parameters  : value       lower 90%   higher 90%
alpha       : -1.25814   ( -0.347929   0.480012 )
beta        : -10.0000    ( 10   3.55271e-15 )
Epeak [keV] : 129.033      ( -41.4197 -129.033 )
Norm@50keV   : 3.14188E-02    ( -0.0103854   0.0258794 )
------------------------------------------------------------
#Fit statistic : Chi-Squared =          57.74 using 59 PHA bins.
# Reduced chi-squared =          1.050 for     55 degrees of freedom
# Null hypothesis probability =   3.742154e-01

Photon flux (15-150 keV)    in 1 sec:  (    ) ph/cm2/s
Energy fluence (15-150 keV)             : 0 ( 0  0 ) ergs/cm2
Single BB

Spectral model blackbody:
------------------------------------------------------------
Parameters  : value    Lower 90%  Upper 90%
kT [keV]    : 14.5416  (-1.5887  1.7924)
R^2/D10^2   : 0.353502  (-0.118469   0.178374)
(R is the radius in km and D10 is the distance to the source in units of 10 kpc)
------------------------------------------------------------
#Fit statistic : Chi-Squared =         102.50 using 59 PHA bins.
# Reduced chi-squared =         1.7983 for     57 degrees of freedom
# Null hypothesis probability =   2.070216e-04

Energy  Fluence     90% Error
[keV]   [erg/cm2]   [erg/cm2]
15- 25  1.572e-08   2.285e-09
25- 50  6.068e-08   6.405e-09
50-150  8.609e-08   1.468e-08
15-150  1.625e-07   1.705e-08
Thermal bremsstrahlung (OTTB)

Spectral model: thermal bremsstrahlung
------------------------------------------------------------
Parameters  : value         Lower 90%    Upper 90%
kT [keV]    : 199.361       (-62.2873      -199.362)
Norm        : 11.5749       (-0.90598     0.907037)
------------------------------------------------------------
#Fit statistic : Chi-Squared =          57.76 using 59 PHA bins.
# Reduced chi-squared =          1.013 for     57 degrees of freedom
# Null hypothesis probability =   4.469378e-01

Energy  Fluence     90% Error
[keV]   [erg/cm2]   [erg/cm2]
15- 25  2.882e-08   2.705e-09
25- 50  5.544e-08   8.970e-09
50-150  1.216e-07   4.530e-08
15-150  2.059e-07   5.270e-08
Double BB

Spectral model: bbodyrad<1> + bbodyrad<2>
------------------------------------------------------------
Parameters  : value         Lower 90%    Upper 90%
kT1 [keV]   : 6.62835        (-1.17162      1.38527)
R1^2/D10^2  : 3.78897        (-1.82723      3.89417)
kT2 [keV]   : 26.4096        (-4.76134      7.58571)
R2^2/D10^2  : 3.46948E-02    (-0.0201338   0.0365308)
------------------------------------------------------------
#Fit statistic : Chi-Squared =          53.06 using 59 PHA bins.
# Reduced chi-squared =         0.9647 for     55 degrees of freedom
# Null hypothesis probability =   5.491840e-01

Energy  Fluence     90% Error
[keV]   [erg/cm2]   [erg/cm2]
15- 25  2.926e-08   8.825e-09
25- 50  5.474e-08   1.409e-08
50-150  1.260e-07   5.031e-08
15-150  2.100e-07   6.797e-08
Pre-slew spectrum (Pre-slew PHA with pre-slew DRM)
Power-law model

Spectral model in power-law:
------------------------------------------------------------
Parameters  : value       lower 90%   higher 90%
Photon index: 1.95102     ( -0.427967   0.488903 )
Norm@50keV  : 4.49055E-04    ( -0.000132071   0.000122312 )
------------------------------------------------------------
#Fit statistic : Chi-Squared =          49.89 using 59 PHA bins.
# Reduced chi-squared =         0.8753 for     57 degrees of freedom
# Null hypothesis probability =   7.365066e-01

Photon flux (15-150 keV)    in 141.3 sec: 6.58857E-02 ( -0.0142016  0.0142085 ) ph/cm2/s
Energy fluence (15-150 keV)             : 5.83939e-07 ( -1.55282e-07  1.62167e-07 ) ergs/cm2
Cutoff power-law model

Spectral model in the cutoff power-law:
------------------------------------------------------------
Parameters  : value       lower 90%   higher 90%
Photon index: 2.70329     ( -1.77006   0.273378 )
Epeak [keV] : 231.184      (   )
Norm@50keV  : 1.95393E-04    (     )
------------------------------------------------------------
#Fit statistic : Chi-Squared =          49.32 using 59 PHA bins.
# Reduced chi-squared =         0.8807 for     56 degrees of freedom
# Null hypothesis probability =   7.238999e-01

Photon flux (15-150 keV)    in 141.3 sec: 6.59201E-02 ( -0.0142626  0.014176 ) ph/cm2/s
Energy fluence (15-150 keV)             : 5.8388e-07 ( -1.54959e-07  1.58219e-07 ) ergs/cm2
Band function

Spectral model in the Band function:
------------------------------------------------------------
Parameters  : value       lower 90%   higher 90%
alpha       : -2.27161   ( 2.27161   2.27161 )
beta        : -1.95103    ( -0.488935   0.428311 )
Epeak [keV] : 71.9449      ( -71.9449 -71.9449 )
Norm@50keV   : 6.10326E-02    ( -0.01795   0.0166243 )
------------------------------------------------------------
#Fit statistic : Chi-Squared =          49.89 using 59 PHA bins.
# Reduced chi-squared =         0.9071 for     55 degrees of freedom
# Null hypothesis probability =   6.696792e-01

Photon flux (15-150 keV)    in 141.3 sec:  (    ) ph/cm2/s
Energy fluence (15-150 keV)             : 0 ( 0  0 ) ergs/cm2
S(25-50 keV) vs. S(50-100 keV) plot

S(25-50 keV)  = 6.34e-07
S(50-100 keV) = 5.61e-07
T90 vs. Hardness ratio plot

T90                                   = 304.595999896526 sec.
Hardness ratio (energy fluence ratio) = 0.884858
Color vs. Color plot
Count Ratio  (25-50 keV) / (15-25 keV) = 0.905023
Count Ratio (50-100 keV) / (15-25 keV) = 0.430363
Mask shadow pattern

IMX = -2.765502225343917E-01, IMY = 3.669045055672575E-01
TIME vs. PHA plot around the trigger time

Blue+Cyan dotted lines: Time interval of the scaled map
From 0.000000 to 0.256000
TIME vs. DetID plot around the trigger time

Blue+Cyan dotted lines: Time interval of the scaled map
From 0.000000 to 0.256000
100 us light curve (15-350 keV)

Blue+Cyan dotted lines: Time interval of the scaled map
From 0.000000 to 0.256000
Spacecraft aspect plot

Bright source in the pre-burst/pre-slew/post-slew images
Pre-burst image of 15-350 keV band
Time interval of the image:
-239.520000 -0.532000

# RAcent  DECcent POSerr Theta    Phi  PeakCts   SNR AngSep     Name
#  [deg]    [deg]    ['] [deg]  [deg]                   [']
170.2268 -60.6217    3.7  35.0   -2.8   1.0638   3.1    2.6	Cen X-3
186.6876 -62.7620    2.7  26.9   -3.4   1.1736   4.2    1.0	GX 301-2
245.0110 -15.6431    0.6  39.1  136.9  11.9425  18.8    1.8	Sco X-1
256.0123 -37.8485    1.6  20.8  170.5   1.7431   7.2    1.2	4U 1700-377
256.4063 -36.3391    3.2  22.3  169.2   0.9285   3.6    5.2	GX 349+2
262.9635 -24.7398    6.0  35.2  168.2   0.6507   1.9    2.5	GX 1+4
264.8177 -44.5039    4.2  20.2 -162.5   0.6815   2.7    4.6	4U 1735-44
270.3021 -25.1283    3.6  38.0  178.3   1.1496   3.2    3.1	GX 5-1
270.4101 -25.7797    3.3  37.5  179.0   1.1785   3.5    6.2	GRS 1758-258
274.1345 -14.0292    4.8  49.5  175.1   1.6192   2.4    7.5	GX 17+2
275.7275 -30.4418    0.0  36.3 -170.1   0.2783   0.9   11.2	H1820-303
284.9048 -25.0259    8.9  45.6 -165.3  -0.6543  -1.3    9.5	HT1900.1-2455
263.0084 -34.0321  153.0  27.1  177.2  -0.0202  -0.1   11.9	GX 354-0
218.5750 -17.6154    2.9  39.5   96.3   3.7469   3.9 ------	UNKNOWN
145.7294 -45.3628    2.8  55.5    3.7   4.2354   4.1 ------	UNKNOWN
141.2178 -48.6605    2.7  55.3   -1.8   3.4889   4.3 ------	UNKNOWN
132.6466 -60.2148    3.2  50.8  -16.5   1.7877   3.6 ------	UNKNOWN
313.0835 -50.5329    4.5  44.1 -117.1   2.9640   2.6 ------	UNKNOWN
Pre-slew background subtracted image of 15-350 keV band
Time interval of the image:
-0.532000 140.780600

# RAcent  DECcent POSerr Theta    Phi  PeakCts   SNR AngSep     Name
#  [deg]    [deg]    ['] [deg]  [deg]                   [']
170.1663 -60.6305    3.1  35.0   -2.8  -0.7530  -3.8    4.4	Cen X-3
186.8140 -62.7401    7.5  26.9   -3.4  -0.2907  -1.5    4.7	GX 301-2
245.0964 -15.5601    2.5  39.2  137.1  -1.8886  -4.7    8.3	Sco X-1
255.9554 -37.9211    4.5  20.7  170.5  -0.4384  -2.6    4.8	4U 1700-377
256.4437 -36.6247    0.0  22.0  169.6   0.2995   1.8   12.1	GX 349+2
263.0662 -24.6599    3.0  35.3  168.3  -0.8927  -3.9    6.0	GX 1+4
264.9390 -44.4925    7.0  20.3 -162.4  -0.2643  -1.6    8.8	4U 1735-44
270.4151 -25.0255    7.3  38.1  178.4   0.3994   1.6    7.8	GX 5-1
270.3913 -25.7566    5.1  37.5  179.0  -0.5499  -2.2    4.9	GRS 1758-258
273.9649 -14.0296    5.5  49.4  174.9  -0.8732  -2.1    2.4	GX 17+2
276.0804 -30.2716   56.5  36.6 -169.9   0.0430   0.2    9.9	H1820-303
285.0927 -24.7930    7.9  45.8 -165.3   0.4447   1.5    8.3	HT1900.1-2455
262.9410 -33.7693    8.3  27.3  176.8   0.2417   1.4    4.6	GX 354-0
285.9583 -52.5712    2.4  28.4 -128.1   0.8736   4.8 ------	UNKNOWN
112.4513 -58.1000    2.3  59.1  -24.5   5.0101   5.1 ------	UNKNOWN
Post-slew image of 15-350 keV band
Time interval of the image:
187.580590 962.511800

# RAcent  DECcent POSerr Theta    Phi  PeakCts   SNR AngSep     Name
#  [deg]    [deg]    ['] [deg]  [deg]                   [']
170.1714 -60.7145  461.8  52.3   24.3   0.0563   0.0    6.9	Cen X-3
186.3954 -62.8586    6.4  45.2   28.8   2.1514   1.8    8.9	GX 301-2
255.9752 -37.8480    2.0  23.4  113.8   4.5291   5.8    0.6	4U 1700-377
256.3159 -36.4003    3.7  24.4  116.5   2.5326   3.1    5.9	GX 349+2
262.8863 -24.7563    8.2  32.3  138.3  -1.3842  -1.4    6.7	GX 1+4
264.7924 -44.6227   12.3  13.9  116.8   0.5481   0.9   10.6	4U 1735-44
270.2304 -25.0581    2.6  30.2  150.6   3.5642   4.4    3.2	GX 5-1
270.3322 -25.7967    2.1  29.5  150.4   4.1572   5.4    3.6	GRS 1758-258
274.1395 -14.0290    5.0  40.6  159.7   2.7109   2.3    7.8	GX 17+2
276.0218 -30.3607    3.2  24.2  159.9   2.3015   3.6    5.0	H1820-303
285.1870 -24.8849   98.2  29.7  177.9   0.0824   0.1    8.5	HT1900.1-2455
262.9955 -33.9680   36.2  23.7  131.1   0.2336   0.3    8.0	GX 354-0
222.3120 -65.6766    2.2  29.8   33.5   3.8025   5.3 ------	UNKNOWN
277.5196 -31.5385    3.3  22.9  162.8   1.9957   3.5 ------	UNKNOWN
283.0435 -13.7761    2.8  40.6  173.0   3.6952   4.2 ------	UNKNOWN
203.1845 -86.1804    3.1  35.0   -4.6   2.9133   3.7 ------	UNKNOWN
 78.7568 -68.1977    4.7  56.4  -20.6   7.6380   2.5 ------	UNKNOWN
308.8756  -1.3654    6.0  57.9 -156.8   8.5675   1.9 ------	UNKNOWN
325.4204 -21.4316    3.2  47.2 -127.1  13.3433   3.6 ------	UNKNOWN
Plot creation:
Wed Jun  1 17:44:42 EDT 2016