Estimated redshift from machine learning (Ukwatta et al. 2016) - may take a few minute to calcaulte
Image
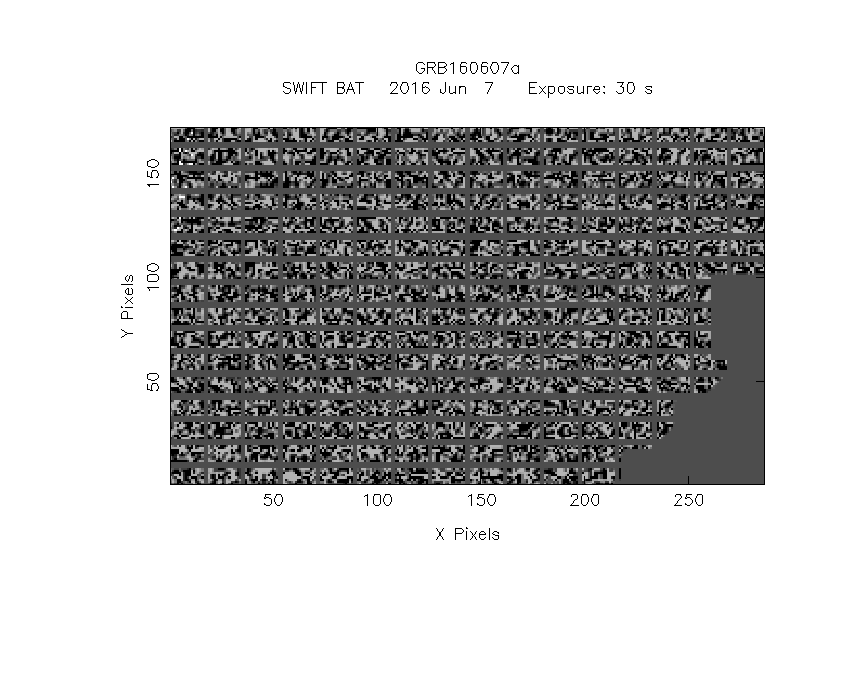
Pre-slew 15.0-350.0 keV image (Event data)

#   RAcent    DECcent   POSerr    Theta     Phi              Peak Cts       SNR   Name
   13.6617    -4.9528   0.0018    27.8057    -4.9107        24.9083839    107.089 TRIG_00689597

Foreground time interval of the image:
-14.548  15.485 (delta_t =  30.033 [sec])
Background time interval of the image:
-29.515 -14.548 (delta_t =  14.967 [sec])
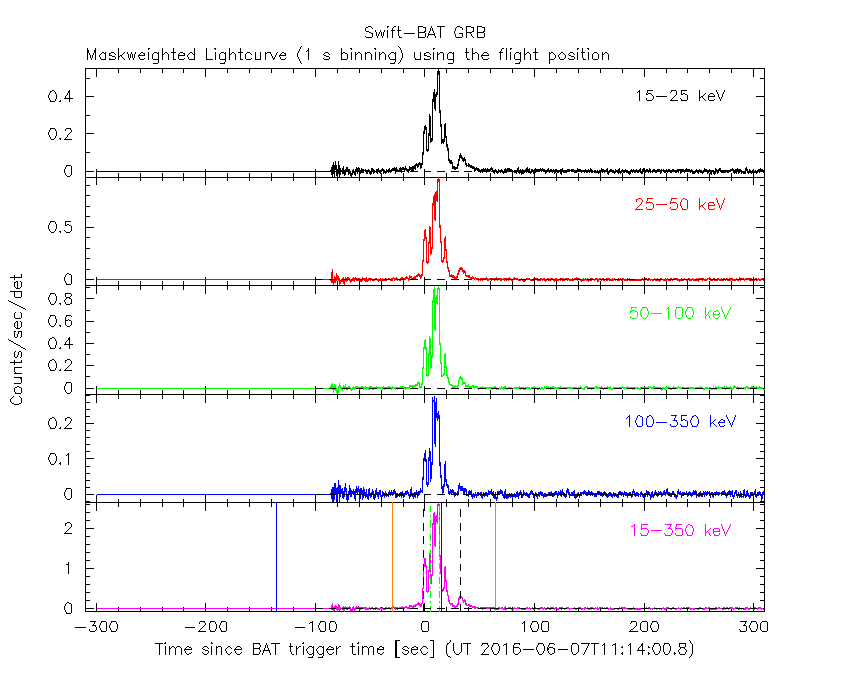
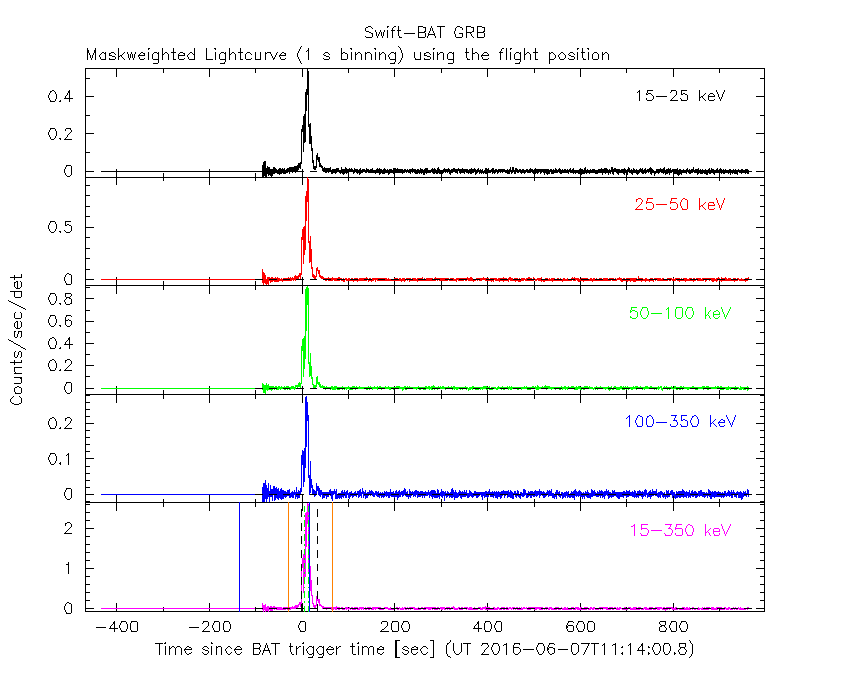
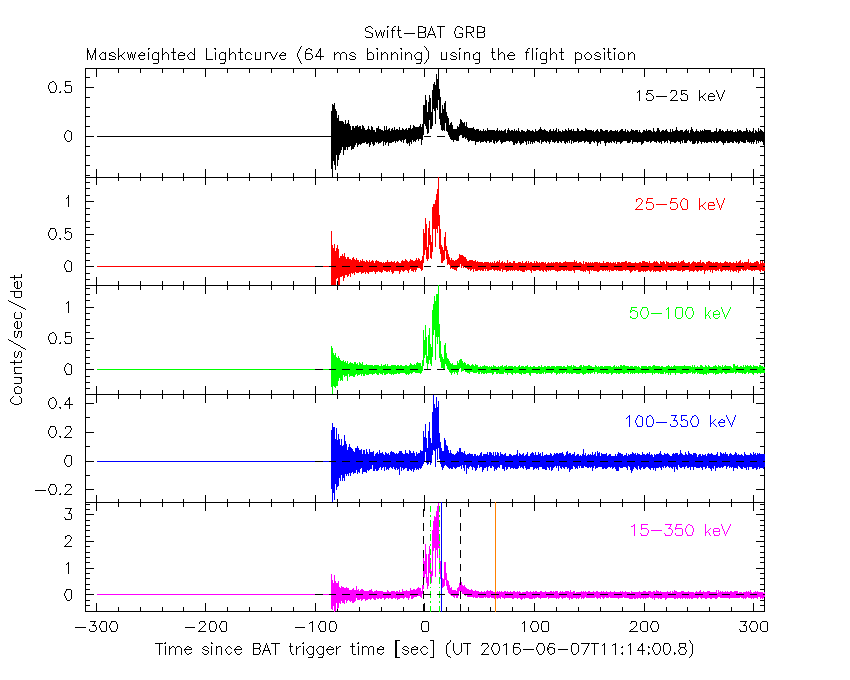
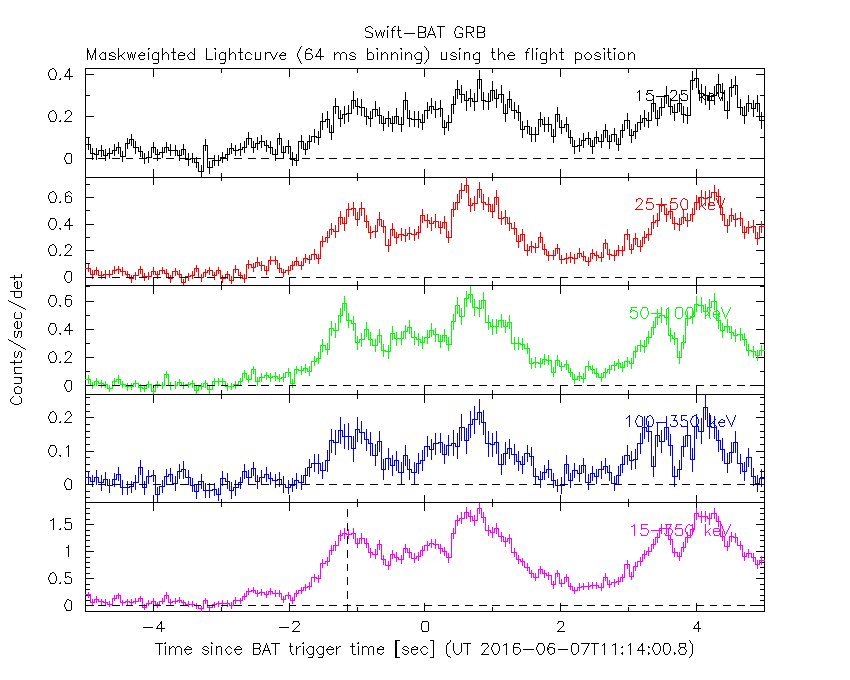
Lightcurves
Notes:
- 1) The mask-weighted light curves are using the flight position.
- 2) Multiple plots of different time binning/intervals are shown to cover all scenarios of short/long GRBs, rate/image triggers, and real/false positives.
- 3) For all the mask-weighted lightcurves, the y-axis units are counts/sec/det where a det is 0.4 x 0.4 = 0.16 sq cm.
- 4) The verticle lines correspond to following: green dotted lines are T50 interval, black dotted lines are T90 interval, blue solid line(s) is a spacecraft slew start time, and orange solid line(s) is a spacecraft slew end time.
- 5) Time of each bin is in the middle of the bin.
1 s binning
From T0-310 s to T0+310 s
From T100_start - 20 s to T100_end + 30 s

Full time interval
64 ms binning
Full time interval
From T100_start to T100_end

From T0-5 sec to T0+5 sec
16 ms binning
From T100_start-5 s to T100_start+5 s

Blue+Cyan dotted lines: Time interval of the scaled map
From 0.000000 to 1.024000
8 ms binning
From T100_start-3 s to T100_start+3 s
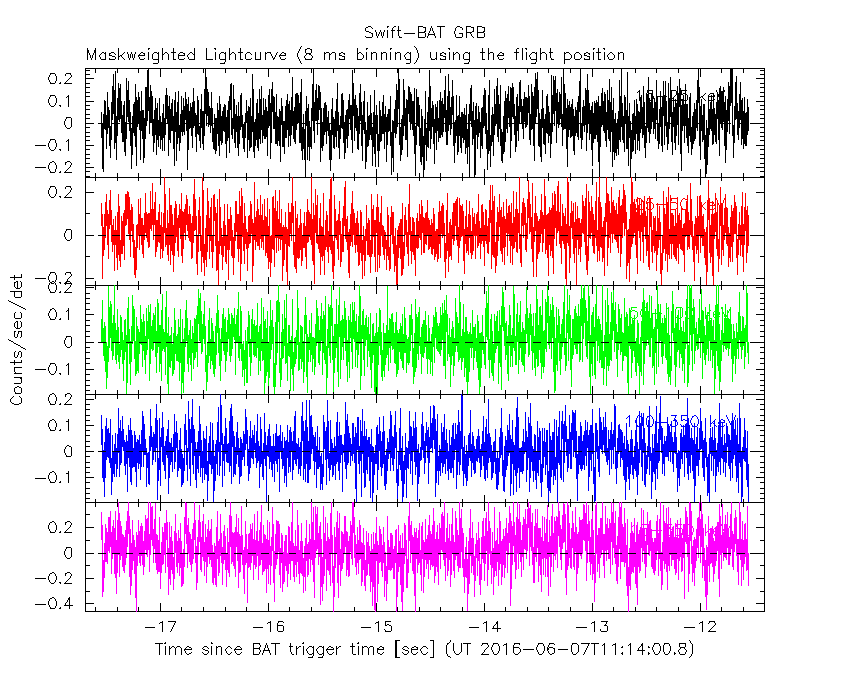
Blue+Cyan dotted lines: Time interval of the scaled map
From 0.000000 to 1.024000
2 ms binning
From T100_start-1 s to T100_start+1 s
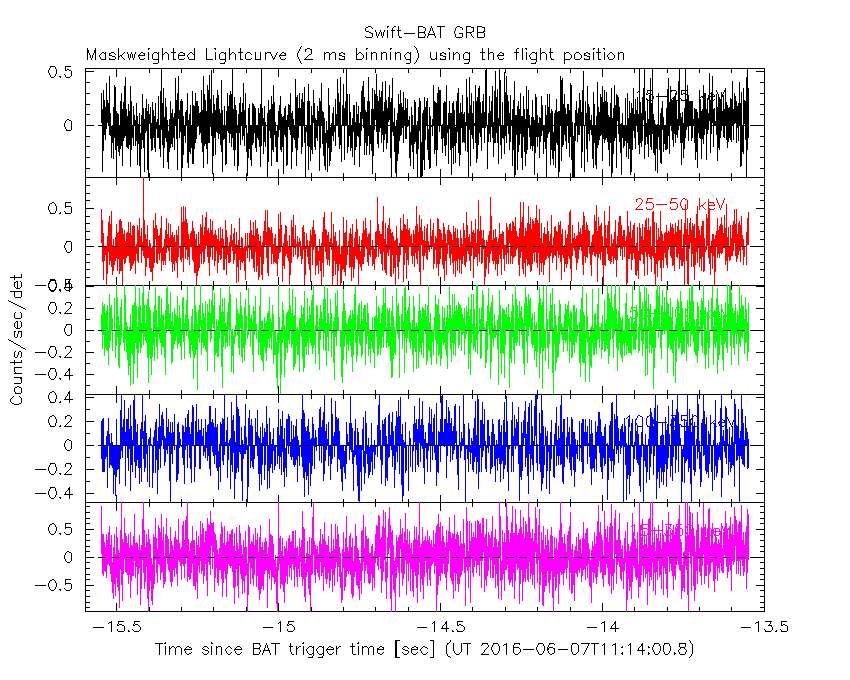
Blue+Cyan dotted lines: Time interval of the scaled map
From 0.000000 to 1.024000
SN=5 or 10 sec. binning (whichever binning is satisfied first)
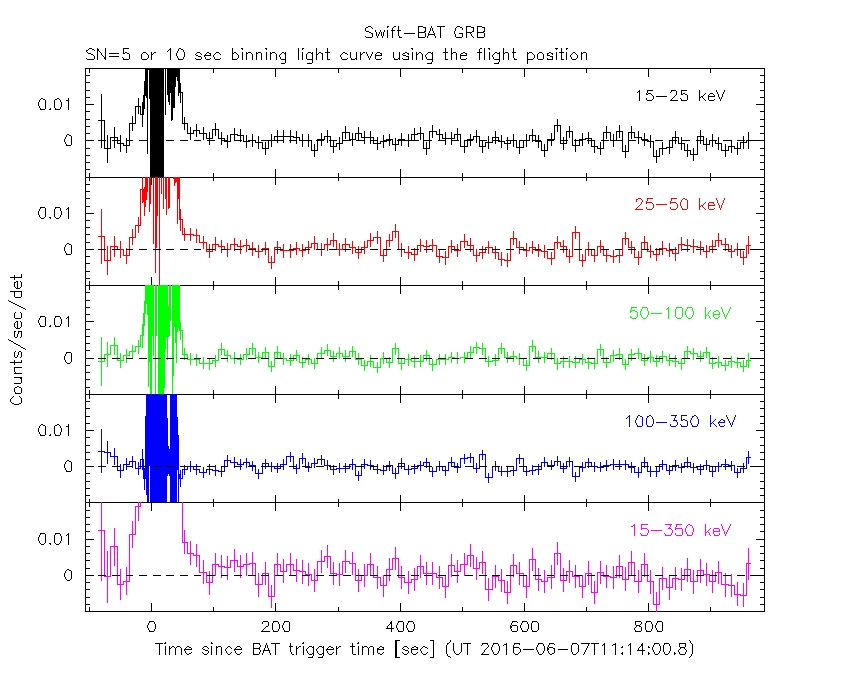
SN=5 or 10 sec. binning (T < 200 sec)

Quad-rate summed light curves (from T0-300s to T0+1000s)

Spectral Evolution
Spectra
Notes:
- 1) The fitting includes the systematic errors.
- 2) When the burst includes telescope slew time periods, the fitting uses an average response file made from multiple 5-s response files through out the slew time plus single time preiod for the non-slew times, and weighted by the total counts in the corresponding time period using addrmf. An average response file is needed becuase a spectral fit using the pre-slew DRM will introduce some errors in both a spectral shape and a normalization if the PHA file contains a lot of the slew/post-slew time interval.
- 3) For fits to more complicated models (e.g. a power-law over a cutoff power-law), the BAT team has decided to require a chi-square improvement of more than 6 for each extra dof.
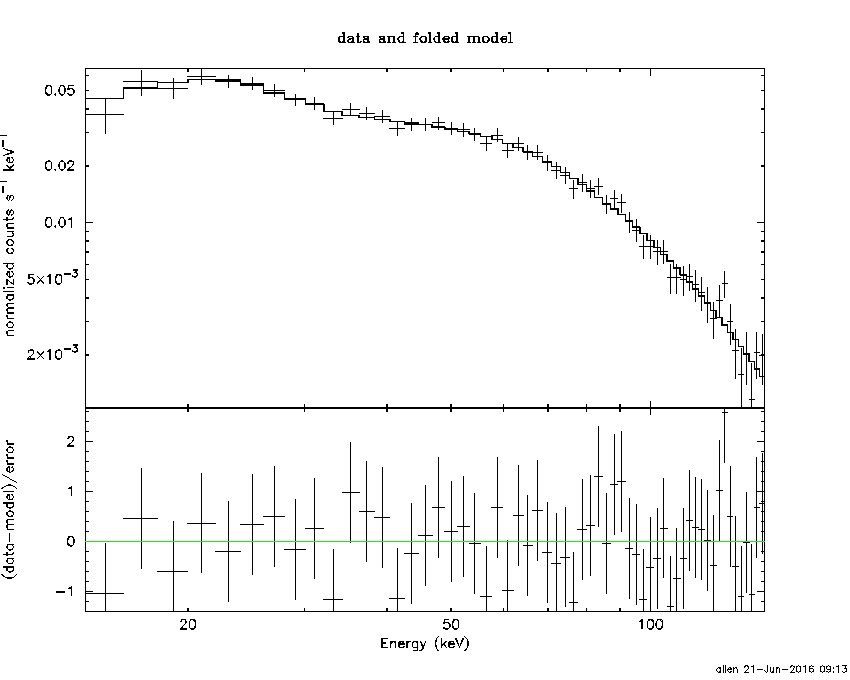
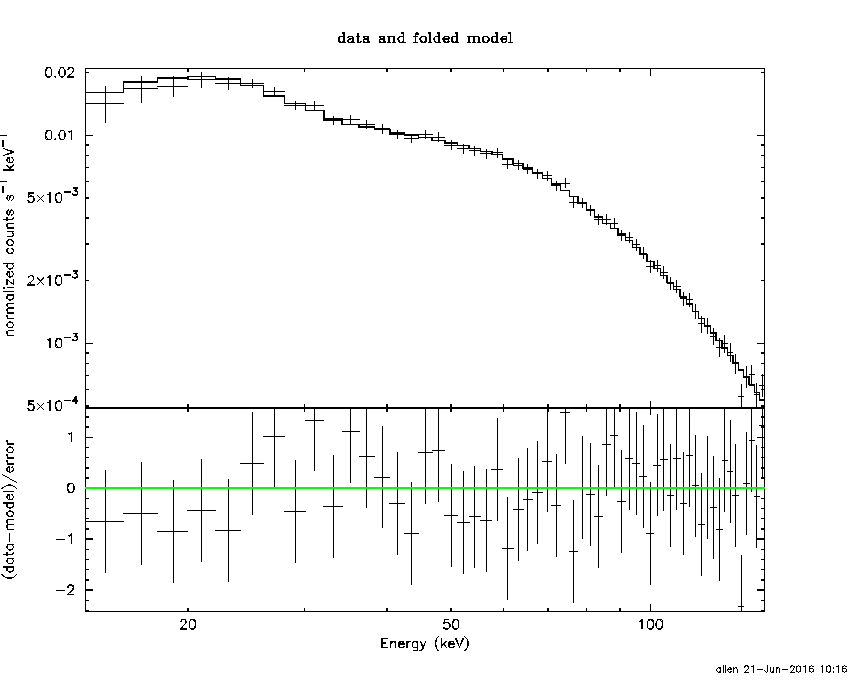
Time averaged spectrum fit using the average DRM
Power-law model
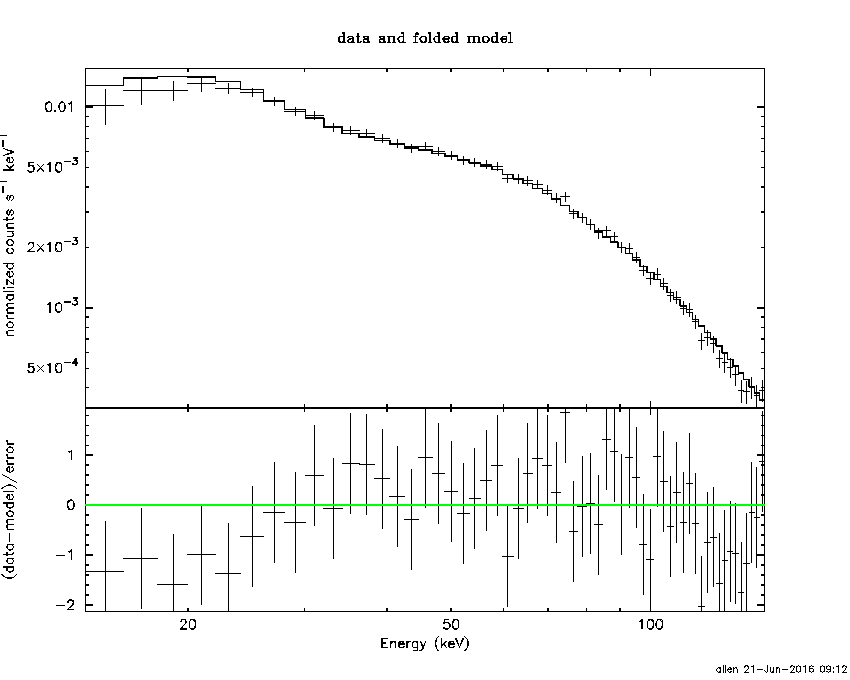
Time interval is from  -14.548 sec. to   44.080 sec.

Spectral model in power-law:
------------------------------------------------------------
Parameters  : value       lower 90%   higher 90%
Photon index: 1.36873     ( -0.0233175   0.0232367 )
Norm@50keV  : 3.65068E-02    ( -0.000493473   0.000492611 )
------------------------------------------------------------
#Fit statistic : Chi-Squared =          43.80 using 59 PHA bins.
# Reduced chi-squared =         0.7685 for     57 degrees of freedom
# Null hypothesis probability =   9.002288e-01

Photon flux (15-150 keV)    in 58.63 sec: 4.41538 ( -0.07103  0.07129 ) ph/cm2/s
Energy fluence (15-150 keV)             : 2.08209e-05 ( -2.58705e-07  2.59046e-07 ) ergs/cm2
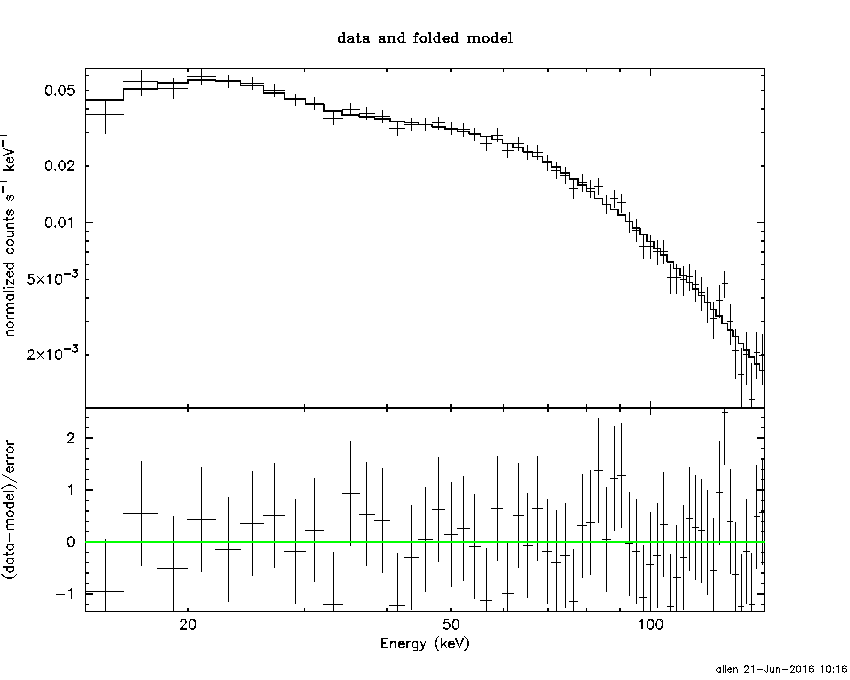
Cutoff power-law model
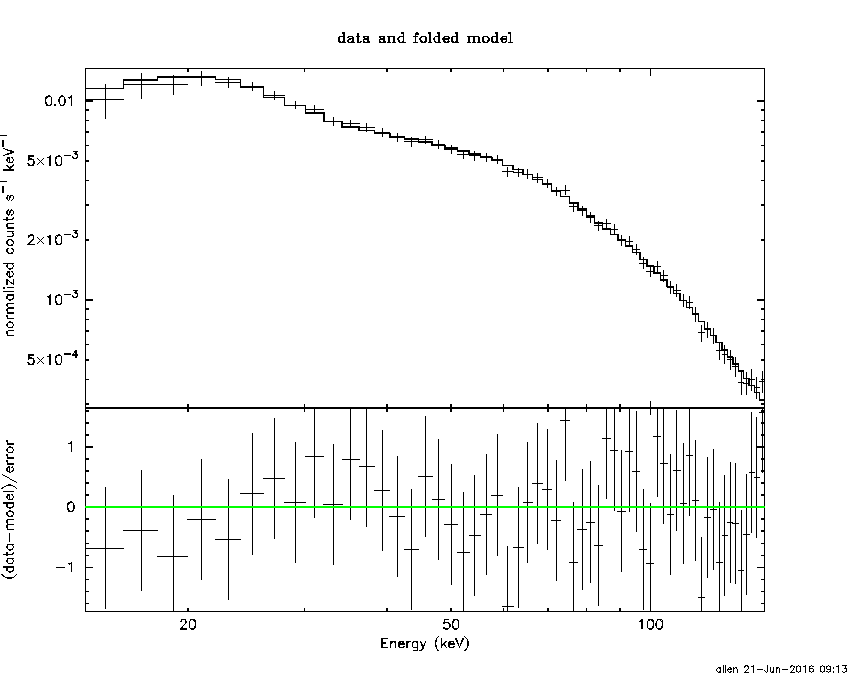
Time interval is from  -14.548 sec. to   44.080 sec.
Spectral model in the cutoff power-law:
------------------------------------------------------------
Parameters  : value       lower 90%   higher 90%
Photon index: 1.14498     ( -0.0992864   0.097366 )
Epeak [keV] : 247.050      ( -55.4048 133.812 )
Norm@50keV  : 4.45855E-02    ( -0.00364005   0.0040257 )
------------------------------------------------------------
#Fit statistic : Chi-Squared =          28.19 using 59 PHA bins.
# Reduced chi-squared =         0.5035 for     56 degrees of freedom
# Null hypothesis probability =   9.992966e-01

Photon flux (15-150 keV)    in 58.63 sec: 2.62052 (    ) ph/cm2/s
Energy fluence (15-150 keV)             : 2.06771e-05 ( -2.65837e-07  2.65947e-07 ) ergs/cm2
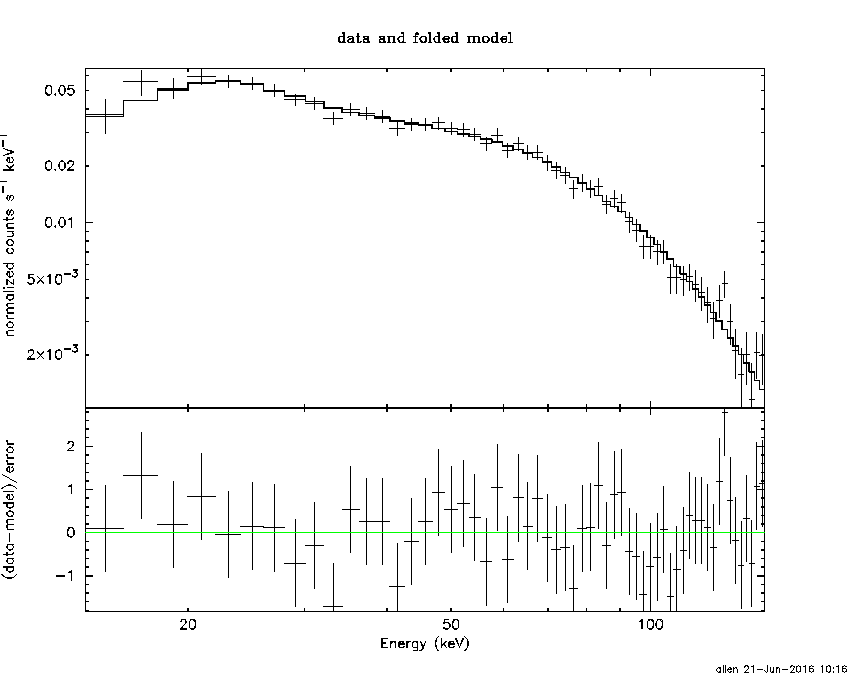
Band function
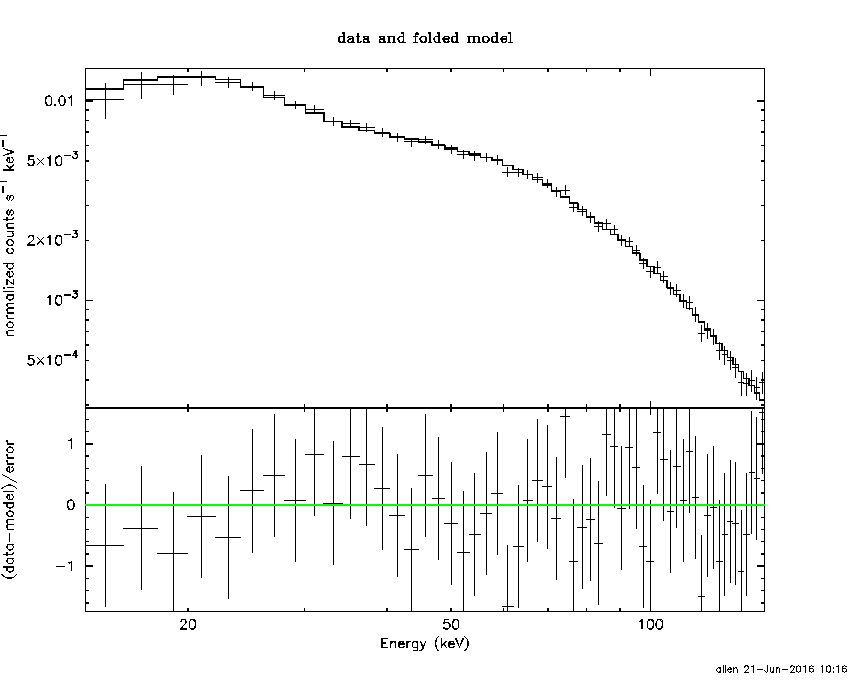
Time interval is from  -14.548 sec. to   44.080 sec.

Spectral model in the Band function:
------------------------------------------------------------
Parameters  : value       lower 90%   higher 90%
alpha       : -1.14152   ( -0.0973749   0.0611705 )
beta        : -1.60600    ( 1.61032   0.20646 )
Epeak [keV] : 241.991      ( -175.228 139.24 )
Norm@50keV   : 4.47840E-02    ( -0.0039514   0.258692 )
------------------------------------------------------------
#Fit statistic : Chi-Squared =          28.15 using 59 PHA bins.
# Reduced chi-squared =         0.5119 for     55 degrees of freedom
# Null hypothesis probability =   9.990101e-01

Photon flux (15-150 keV)    in 58.63 sec:  (    ) ph/cm2/s
Energy fluence (15-150 keV)             : 0 ( 0  0 ) ergs/cm2
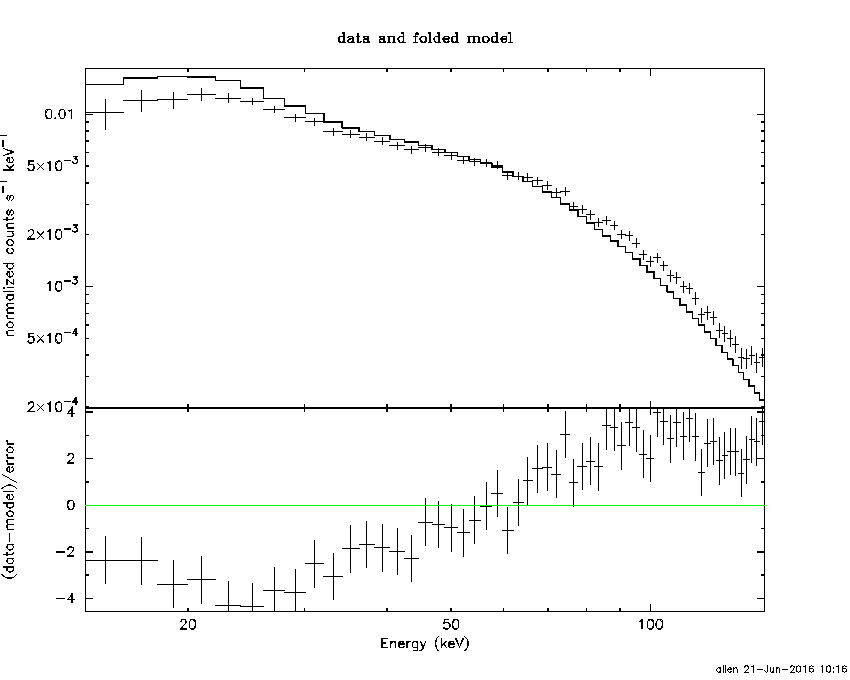
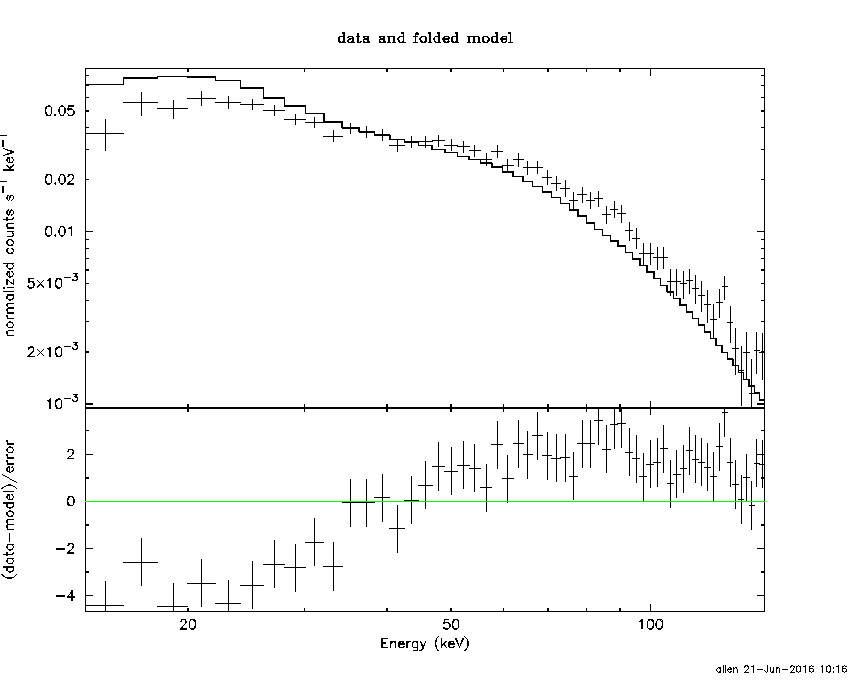
Single BB

Spectral model blackbody:
------------------------------------------------------------
Parameters  : value    Lower 90%  Upper 90%
kT [keV]    : 21.7166  (  )
R^2/D10^2   : 0.142412  (   )
(R is the radius in km and D10 is the distance to the source in units of 10 kpc)
------------------------------------------------------------
#Fit statistic : Chi-Squared =        1161.38 using 59 PHA bins.
# Reduced chi-squared =        20.3751 for     57 degrees of freedom
# Null hypothesis probability =  1.202720e-205

Energy  Fluence     90% Error
[keV]   [erg/cm2]   [erg/cm2]
15- 25  7.331e-07   2.023e-08
25- 50  3.846e-06   7.886e-08
50-150  1.355e-05   2.140e-07
15-150  1.813e-05   2.492e-07
Thermal bremsstrahlung (OTTB)
Spectral model: thermal bremsstrahlung
------------------------------------------------------------
Parameters  : value         Lower 90%    Upper 90%
kT [keV]    : 199.363       (      )
Norm        : 19.3792       (     )
------------------------------------------------------------
#Fit statistic : Chi-Squared =         376.84 using 59 PHA bins.
# Reduced chi-squared =         6.6113 for     57 degrees of freedom
# Null hypothesis probability =   1.108914e-48

Energy  Fluence     90% Error
[keV]   [erg/cm2]   [erg/cm2]
15- 25  2.829e-06   4.280e-08
25- 50  5.442e-06   8.267e-08
50-150  1.194e-05   1.788e-07
15-150  2.021e-05   3.107e-07
Double BB

Spectral model: bbodyrad<1> + bbodyrad<2>
------------------------------------------------------------
Parameters  : value         Lower 90%    Upper 90%
kT1 [keV]   : 8.59750        (-0.463059      0.487069)
R1^2/D10^2  : 1.96530        (-0.33025      0.41133)
kT2 [keV]   : 32.4755        (-1.38783      1.60925)
R2^2/D10^2  : 3.00596E-02    (-0.00476381   0.00514087)
------------------------------------------------------------
#Fit statistic : Chi-Squared =          39.13 using 59 PHA bins.
# Reduced chi-squared =         0.7114 for     55 degrees of freedom
# Null hypothesis probability =   9.478809e-01

Energy  Fluence     90% Error
[keV]   [erg/cm2]   [erg/cm2]
15- 25  1.893e-06   1.014e-07
25- 50  4.954e-06   1.126e-07
50-150  1.372e-05   2.756e-07
15-150  2.056e-05   3.694e-07
Peak spectrum fit
Power-law model

Time interval is from   11.648 sec. to   12.648 sec.

Spectral model in power-law:
------------------------------------------------------------
Parameters  : value       lower 90%   higher 90%
Photon index: 1.22598     ( -0.0379953   0.0379366 )
Norm@50keV  : 0.185204    ( -0.00407342   0.00407177 )
------------------------------------------------------------
#Fit statistic : Chi-Squared =          66.72 using 59 PHA bins.
# Reduced chi-squared =          1.171 for     57 degrees of freedom
# Null hypothesis probability =   1.774969e-01

Photon flux (15-150 keV)    in 1 sec: 1.03905 (    ) ph/cm2/s
Energy fluence (15-150 keV)             : 1.86569e-06 ( -4.28019e-08  4.28444e-08 ) ergs/cm2
Cutoff power-law model
Time interval is from   11.648 sec. to   12.648 sec.
Spectral model in the cutoff power-law:
------------------------------------------------------------
Parameters  : value       lower 90%   higher 90%
Photon index: 0.686066     ( -0.17091   0.164959 )
Epeak [keV] : 143.818      ( -20.8076 36.7015 )
Norm@50keV  : 0.316722    ( -0.0467146   0.0567106 )
------------------------------------------------------------
#Fit statistic : Chi-Squared =          33.20 using 59 PHA bins.
# Reduced chi-squared =         0.5929 for     56 degrees of freedom
# Null hypothesis probability =   9.934203e-01

Photon flux (15-150 keV)    in 1 sec: 21.2201 ( -0.5366  0.5379 ) ph/cm2/s
Energy fluence (15-150 keV)             : 5.59049e-07 ( 0  0 ) ergs/cm2
Band function
Time interval is from   11.648 sec. to   12.648 sec.

Spectral model in the Band function:
------------------------------------------------------------
Parameters  : value       lower 90%   higher 90%
alpha       : -0.624202   ( -0.210925   0.344033 )
beta        : -1.67873    ( 1.68338   0.242973 )
Epeak [keV] : 130.954      ( -40.1951 45.0422 )
Norm@50keV   : 0.341134    ( -0.0669693   0.183891 )
------------------------------------------------------------
#Fit statistic : Chi-Squared =          32.80 using 59 PHA bins.
# Reduced chi-squared =         0.5964 for     55 degrees of freedom
# Null hypothesis probability =   9.924372e-01

Photon flux (15-150 keV)    in 1 sec:  (    ) ph/cm2/s
Energy fluence (15-150 keV)             : 0 ( 0  0 ) ergs/cm2
Single BB

Spectral model blackbody:
------------------------------------------------------------
Parameters  : value    Lower 90%  Upper 90%
kT [keV]    : 20.1772  (  )
R^2/D10^2   : 0.985931  (   )
(R is the radius in km and D10 is the distance to the source in units of 10 kpc)
------------------------------------------------------------
#Fit statistic : Chi-Squared =         310.95 using 59 PHA bins.
# Reduced chi-squared =         5.4553 for     57 degrees of freedom
# Null hypothesis probability =   1.185856e-36

Energy  Fluence     90% Error
[keV]   [erg/cm2]   [erg/cm2]
15- 25  7.711e-08   3.365e-09
25- 50  3.863e-07   1.285e-08
50-150  1.167e-06   4.000e-08
15-150  1.631e-06   3.900e-08
Thermal bremsstrahlung (OTTB)
Spectral model: thermal bremsstrahlung
------------------------------------------------------------
Parameters  : value         Lower 90%    Upper 90%
kT [keV]    : 199.363       (      )
Norm        : 92.8458       (     )
------------------------------------------------------------
#Fit statistic : Chi-Squared =         277.34 using 59 PHA bins.
# Reduced chi-squared =         4.8656 for     57 degrees of freedom
# Null hypothesis probability =   1.042041e-30

Energy  Fluence     90% Error
[keV]   [erg/cm2]   [erg/cm2]
15- 25  2.312e-07   5.350e-09
25- 50  4.447e-07   9.900e-09
50-150  9.754e-07   2.255e-08
15-150  1.651e-06   3.900e-08
Double BB
Spectral model: bbodyrad<1> + bbodyrad<2>
------------------------------------------------------------
Parameters  : value         Lower 90%    Upper 90%
kT1 [keV]   : 8.71808        (-1.00025      1.10504)
R1^2/D10^2  : 7.88364        (-2.24816      3.52462)
kT2 [keV]   : 30.1760        (-2.40363      3.29744)
R2^2/D10^2  : 0.211216    (-0.0666239   0.0761163)
------------------------------------------------------------
#Fit statistic : Chi-Squared =          38.54 using 59 PHA bins.
# Reduced chi-squared =         0.7007 for     55 degrees of freedom
# Null hypothesis probability =   9.550344e-01

Energy  Fluence     90% Error
[keV]   [erg/cm2]   [erg/cm2]
15- 25  1.446e-07   1.190e-08
25- 50  4.171e-07   2.150e-08
50-150  1.270e-06   7.100e-08
15-150  1.831e-06   9.300e-08
Pre-slew spectrum (Pre-slew PHA with pre-slew DRM)
Power-law model

Spectral model in power-law:
------------------------------------------------------------
Parameters  : value       lower 90%   higher 90%
Photon index: 1.28582     ( -0.0231794   0.0230941 )
Norm@50keV  : 5.71952E-02    ( -0.000782055   0.000780632 )
------------------------------------------------------------
#Fit statistic : Chi-Squared =          54.64 using 59 PHA bins.
# Reduced chi-squared =         0.9586 for     57 degrees of freedom
# Null hypothesis probability =   5.640743e-01

Photon flux (15-150 keV)    in 30.03 sec: 6.80603 ( -0.107151  0.107473 ) ph/cm2/s
Energy fluence (15-150 keV)             : 1.70322e-05 ( -2.1325e-07  2.1326e-07 ) ergs/cm2
Cutoff power-law model

Spectral model in the cutoff power-law:
------------------------------------------------------------
Parameters  : value       lower 90%   higher 90%
Photon index: 1.01087     ( -0.0998606   0.0979156 )
Epeak [keV] : 233.864      ( -44.4975 89.6461 )
Norm@50keV  : 7.30632E-02    ( -0.00597376   0.00660653 )
------------------------------------------------------------
#Fit statistic : Chi-Squared =          31.10 using 59 PHA bins.
# Reduced chi-squared =         0.5554 for     56 degrees of freedom
# Null hypothesis probability =   9.971875e-01

Photon flux (15-150 keV)    in 30.03 sec: 6.65368 ( -0.11727  0.11798 ) ph/cm2/s
Energy fluence (15-150 keV)             : 1.69262e-05 ( -2.17507e-07  2.17417e-07 ) ergs/cm2
Band function
Spectral model in the Band function:
------------------------------------------------------------
Parameters  : value       lower 90%   higher 90%
alpha       : -1.01080   ( -0.0299791   0.0779549 )
beta        : -10.00000    ( 10   20 )
Epeak [keV] : 233.805      ( -67.3922 89.6516 )
Norm@50keV   : 7.30595E-02    ( -0.00326875   0.00661509 )
------------------------------------------------------------
#Fit statistic : Chi-Squared =          31.10 using 59 PHA bins.
# Reduced chi-squared =         0.5655 for     55 degrees of freedom
# Null hypothesis probability =   9.961432e-01

Photon flux (15-150 keV)    in 30.03 sec:  (    ) ph/cm2/s
Energy fluence (15-150 keV)             : 0 ( 0  0 ) ergs/cm2
S(25-50 keV) vs. S(50-100 keV) plot
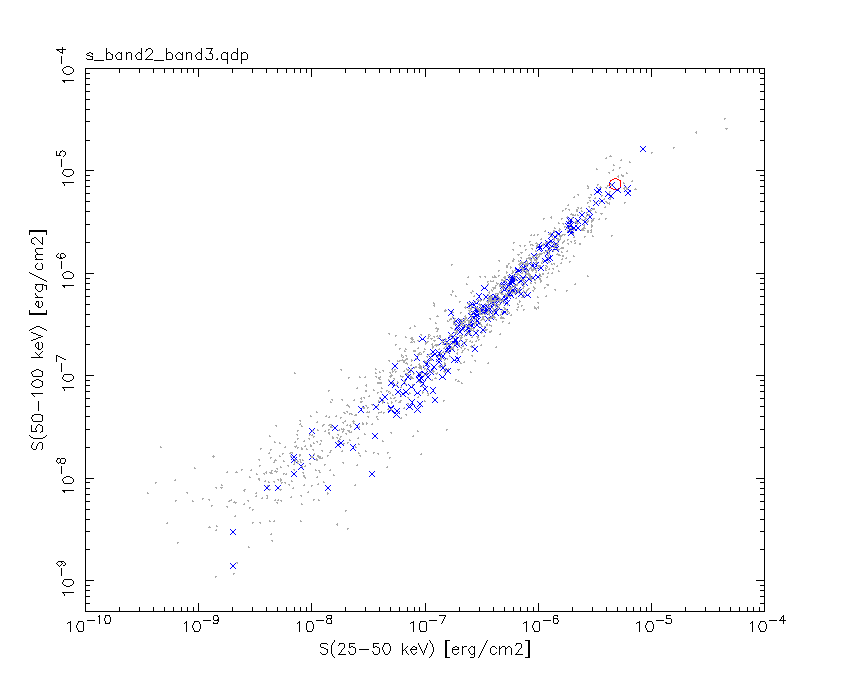
S(25-50 keV)  = 4.81e-06
S(50-100 keV) = 7.45e-06
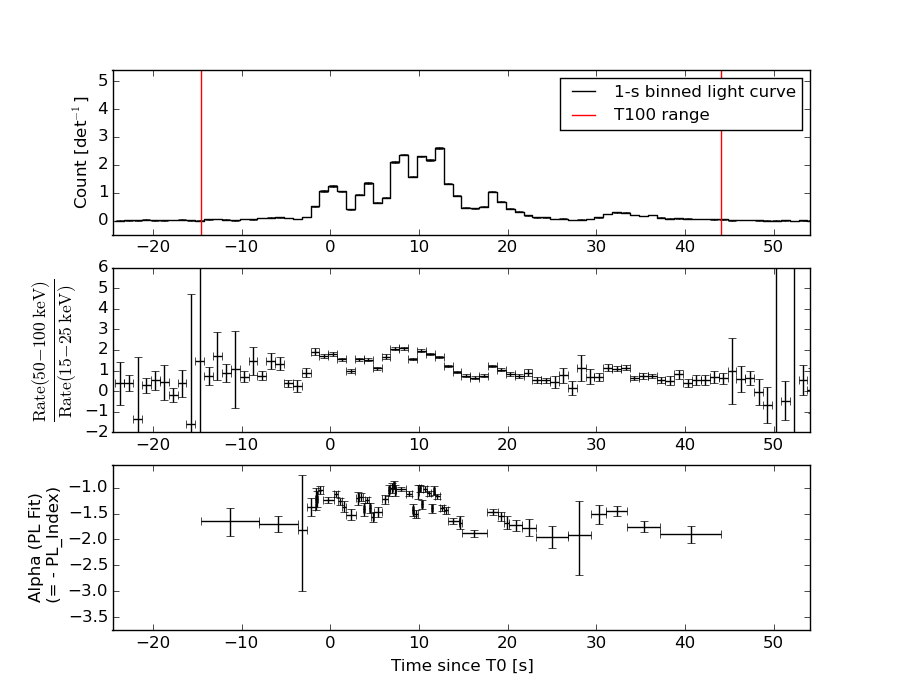
T90 vs. Hardness ratio plot
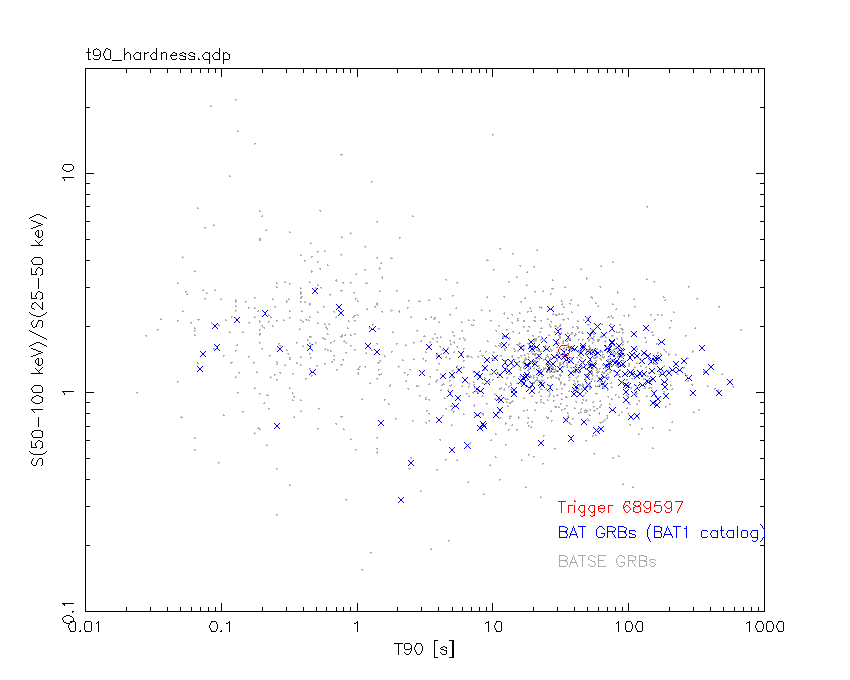
T90                                   = 33.4919999837875 sec.
Hardness ratio (energy fluence ratio) = 1.54886
Color vs. Color plot
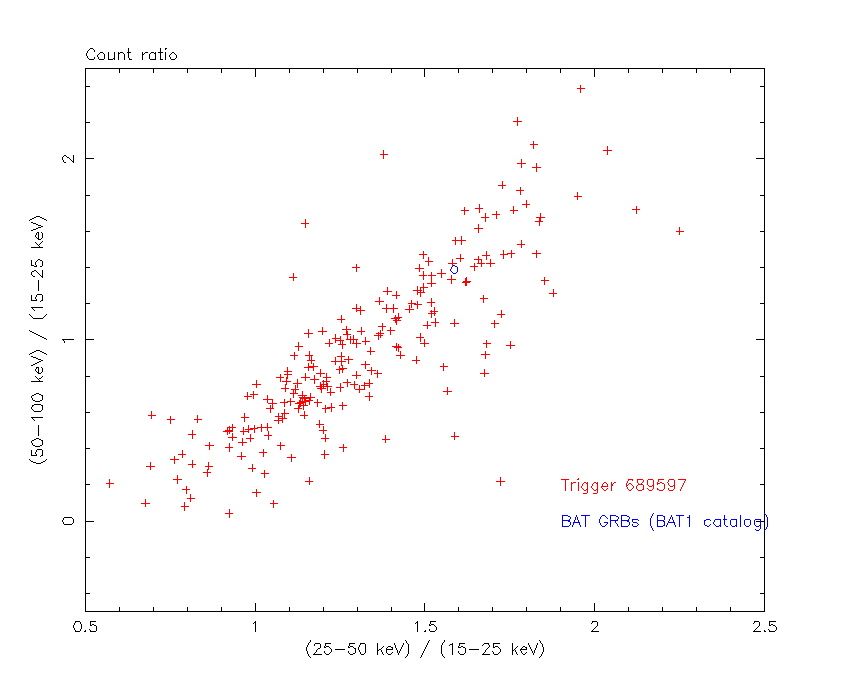
Count Ratio  (25-50 keV) / (15-25 keV) = 1.58579
Count Ratio (50-100 keV) / (15-25 keV) = 1.38861
Mask shadow pattern
IMX = 5.254311877774777E-01, IMY = 4.514434742871043E-02
TIME vs. PHA plot around the trigger time
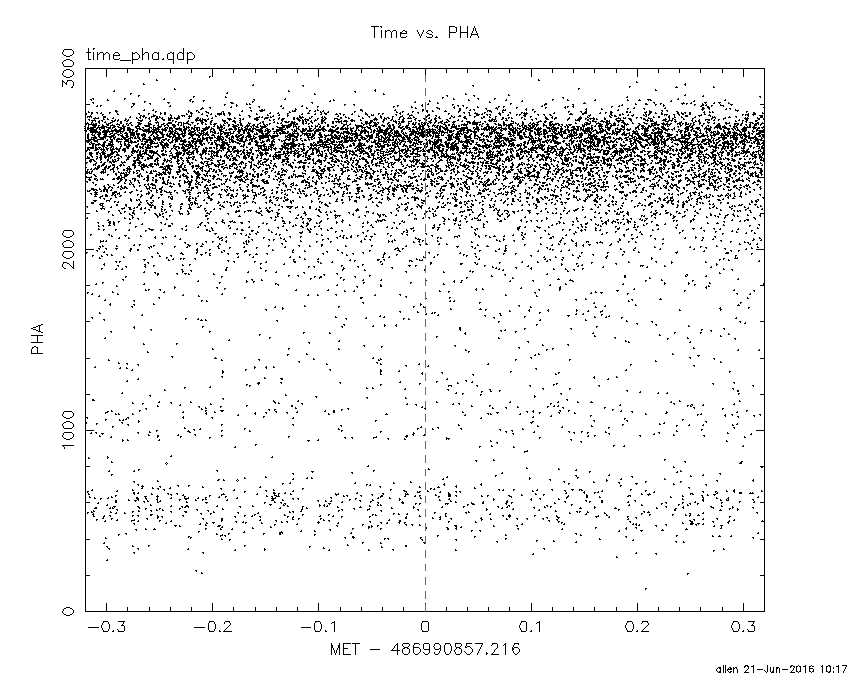
Blue+Cyan dotted lines: Time interval of the scaled map
From 0.000000 to 1.024000
TIME vs. DetID plot around the trigger time

Blue+Cyan dotted lines: Time interval of the scaled map
From 0.000000 to 1.024000
100 us light curve (15-350 keV)
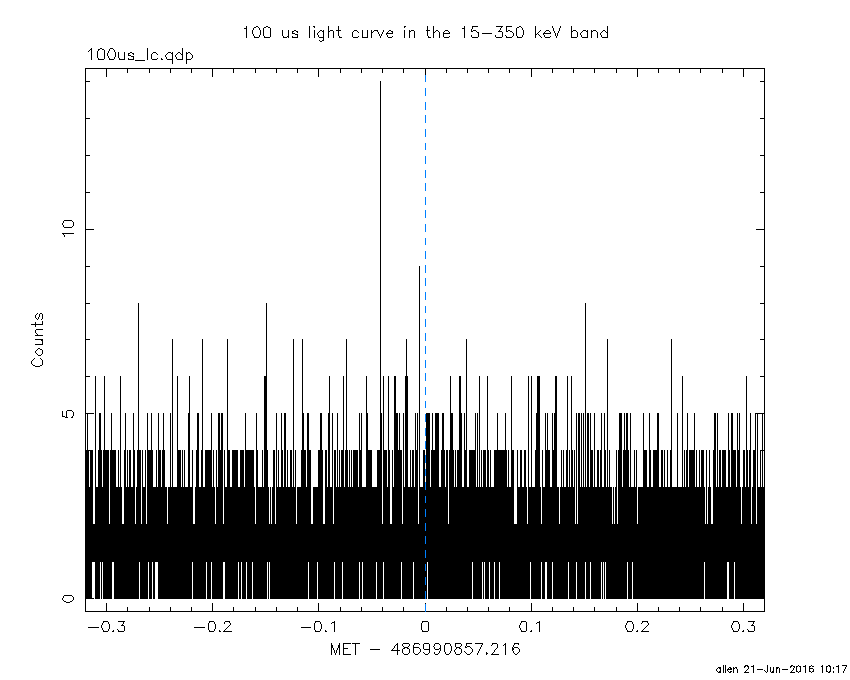
Blue+Cyan dotted lines: Time interval of the scaled map
From 0.000000 to 1.024000
Spacecraft aspect plot

Bright source in the pre-burst/pre-slew/post-slew images
Pre-burst image of 15-350 keV band
Time interval of the image:
-29.515400 -14.548000

# RAcent  DECcent POSerr Theta    Phi  PeakCts   SNR AngSep     Name
#  [deg]    [deg]    ['] [deg]  [deg]                   [']
308.1617  41.0619    5.1  49.6  148.8   0.5014   2.3    7.0	Cyg X-3
325.9505  38.3473  481.1  35.7  149.9   0.0017   0.0   10.5	Cyg X-2
332.3918  69.1870    2.2  52.1 -171.2   0.5771   5.3 ------	UNKNOWN
 34.9927  17.3658    2.1  31.7  -69.0   0.3402   5.4 ------	UNKNOWN
Pre-slew background subtracted image of 15-350 keV band
Time interval of the image:
-14.548000 15.484600

# RAcent  DECcent POSerr Theta    Phi  PeakCts   SNR AngSep     Name
#  [deg]    [deg]    ['] [deg]  [deg]                   [']
308.0372  41.1359   10.4  49.7  149.0  -1.2872  -1.1   11.5	Cyg X-3
326.0181  38.2684    4.3  35.6  149.9  -1.0566  -2.7    7.9	Cyg X-2
314.4076  37.7232    2.5  44.3  145.4   3.3237   4.6 ------	UNKNOWN
 13.6617  -4.9528    0.1  27.8   -4.9  24.9090 107.1 ------	UNKNOWN
 24.8183  65.2217    2.5  47.5 -145.5   2.4704   4.6 ------	UNKNOWN
 38.2859  63.6808    4.0  50.0 -138.2   2.5805   2.9 ------	UNKNOWN
 40.3248  65.8507    2.9  52.1 -139.5   4.4838   4.0 ------	UNKNOWN
Post-slew image of 15-350 keV band
Time interval of the image:
64.684650 962.958400

# RAcent  DECcent POSerr Theta    Phi  PeakCts   SNR AngSep     Name
#  [deg]    [deg]    ['] [deg]  [deg]                   [']
332.5155  29.9140    2.5  52.6  161.7  11.4471   4.7 ------	UNKNOWN
 22.1098   5.6994    2.7  13.6 -114.0   2.1774   4.2 ------	UNKNOWN
 61.8494 -33.4955    3.3  53.0  -23.5   4.8090   3.5 ------	UNKNOWN
  7.7603  52.6775    6.0  57.9 -156.7   7.5050   1.9 ------	UNKNOWN
 47.9443  18.6381    5.8  41.2  -98.3   6.2267   2.0 ------	UNKNOWN
 36.8315  37.3061    5.6  47.5 -127.3   5.6600   2.1 ------	UNKNOWN
Plot creation:
Tue Jun 21 10:17:12 EDT 2016