Estimated redshift from machine learning (Ukwatta et al. 2016) - may take a few minute to calcaulte
Image
Pre-slew 15.0-350.0 keV image (Event data)
#   RAcent    DECcent   POSerr    Theta     Phi              Peak Cts       SNR   Name
  164.4140   -70.3978   0.0080    41.8913  -151.7595         2.9573785     23.962 TRIG_00690598

Foreground time interval of the image:
-31.384  13.512 (delta_t =  44.896 [sec])
Background time interval of the image:
-239.816 -31.384 (delta_t = 208.432 [sec])
Lightcurves
Notes:
- 1) The mask-weighted light curves are using the flight position.
- 2) Multiple plots of different time binning/intervals are shown to cover all scenarios of short/long GRBs, rate/image triggers, and real/false positives.
- 3) For all the mask-weighted lightcurves, the y-axis units are counts/sec/det where a det is 0.4 x 0.4 = 0.16 sq cm.
- 4) The verticle lines correspond to following: green dotted lines are T50 interval, black dotted lines are T90 interval, blue solid line(s) is a spacecraft slew start time, and orange solid line(s) is a spacecraft slew end time.
- 5) Time of each bin is in the middle of the bin.
1 s binning
From T0-310 s to T0+310 s

From T100_start - 20 s to T100_end + 30 s

Full time interval
64 ms binning
Full time interval

From T100_start to T100_end
From T0-5 sec to T0+5 sec
16 ms binning
From T100_start-5 s to T100_start+5 s
Blue+Cyan dotted lines: Time interval of the scaled map
From 0.000000 to 1.024000
8 ms binning
From T100_start-3 s to T100_start+3 s
Blue+Cyan dotted lines: Time interval of the scaled map
From 0.000000 to 1.024000
2 ms binning
From T100_start-1 s to T100_start+1 s
Blue+Cyan dotted lines: Time interval of the scaled map
From 0.000000 to 1.024000
SN=5 or 10 sec. binning (whichever binning is satisfied first)
SN=5 or 10 sec. binning (T < 200 sec)
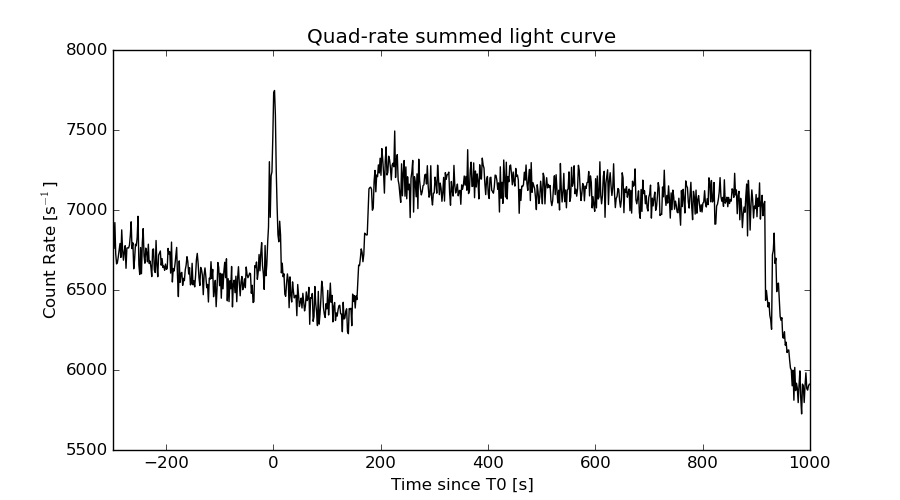
Quad-rate summed light curves (from T0-300s to T0+1000s)
Spectral Evolution

Spectra
Notes:
- 1) The fitting includes the systematic errors.
- 2) When the burst includes telescope slew time periods, the fitting uses an average response file made from multiple 5-s response files through out the slew time plus single time preiod for the non-slew times, and weighted by the total counts in the corresponding time period using addrmf. An average response file is needed becuase a spectral fit using the pre-slew DRM will introduce some errors in both a spectral shape and a normalization if the PHA file contains a lot of the slew/post-slew time interval.
- 3) For fits to more complicated models (e.g. a power-law over a cutoff power-law), the BAT team has decided to require a chi-square improvement of more than 6 for each extra dof.
Time averaged spectrum fit using the average DRM
Power-law model

Time interval is from  -31.384 sec. to   13.512 sec.

Spectral model in power-law:
------------------------------------------------------------
Parameters  : value       lower 90%   higher 90%
Photon index: 1.67611     ( -0.121268   0.122542 )
Norm@50keV  : 4.26102E-03    ( -0.000300071   0.000298398 )
------------------------------------------------------------
#Fit statistic : Chi-Squared =          54.78 using 59 PHA bins.
# Reduced chi-squared =         0.9611 for     57 degrees of freedom
# Null hypothesis probability =   5.588192e-01

Photon flux (15-150 keV)    in 44.9 sec: 0.561293 ( -0.03941  0.039495 ) ph/cm2/s
Energy fluence (15-150 keV)             : 1.7752e-06 ( -1.31029e-07  1.31871e-07 ) ergs/cm2
Cutoff power-law model
Time interval is from  -31.384 sec. to   13.512 sec.
Spectral model in the cutoff power-law:
------------------------------------------------------------
Parameters  : value       lower 90%   higher 90%
Photon index: 1.53162     ( -0.463946   0.253305 )
Epeak [keV] : 160.014      (   )
Norm@50keV  : 5.05197E-03    (     )
------------------------------------------------------------
#Fit statistic : Chi-Squared =          54.45 using 59 PHA bins.
# Reduced chi-squared =         0.9723 for     56 degrees of freedom
# Null hypothesis probability =   5.337658e-01

Photon flux (15-150 keV)    in 44.9 sec: 0.557234 ( -0.041138  0.041169 ) ph/cm2/s
Energy fluence (15-150 keV)             : 1.75581e-06 ( -1.43578e-07  1.42545e-07 ) ergs/cm2
Band function

Time interval is from  -31.384 sec. to   13.512 sec.

Spectral model in the Band function:
------------------------------------------------------------
Parameters  : value       lower 90%   higher 90%
alpha       : -0.738338   ( 1.00194   1.00194 )
beta        : -1.76846    ( 1.76471   0.181623 )
Epeak [keV] : 44.1835      ( -44.1501 371.352 )
Norm@50keV   : 1.70700E-02    ( -0.0174831   517.669 )
------------------------------------------------------------
#Fit statistic : Chi-Squared =          53.58 using 59 PHA bins.
# Reduced chi-squared =         0.9742 for     55 degrees of freedom
# Null hypothesis probability =   5.289539e-01

Photon flux (15-150 keV)    in 44.9 sec: 0.562361 ( -0.040192  0.036182 ) ph/cm2/s
Energy fluence (15-150 keV)             : 1.76761e-06 ( -1.24463e-07  1.25154e-07 ) ergs/cm2
Single BB

Spectral model blackbody:
------------------------------------------------------------
Parameters  : value    Lower 90%  Upper 90%
kT [keV]    : 13.3005  (  )
R^2/D10^2   : 9.14845E-02  (   )
(R is the radius in km and D10 is the distance to the source in units of 10 kpc)
------------------------------------------------------------
#Fit statistic : Chi-Squared =         117.50 using 59 PHA bins.
# Reduced chi-squared =         2.0614 for     57 degrees of freedom
# Null hypothesis probability =   4.343258e-06

Energy  Fluence     90% Error
[keV]   [erg/cm2]   [erg/cm2]
15- 25  1.540e-07   2.126e-08
25- 50  5.436e-07   5.164e-08
50-150  6.159e-07   8.576e-08
15-150  1.314e-06   1.073e-07
Thermal bremsstrahlung (OTTB)

Spectral model: thermal bremsstrahlung
------------------------------------------------------------
Parameters  : value         Lower 90%    Upper 90%
kT [keV]    : 154.642       (-44.6891      -152.536)
Norm        : 2.28155       (-0.177215     0.227886)
------------------------------------------------------------
#Fit statistic : Chi-Squared =          55.34 using 59 PHA bins.
# Reduced chi-squared =         0.9708 for     57 degrees of freedom
# Null hypothesis probability =   5.376931e-01

Energy  Fluence     90% Error
[keV]   [erg/cm2]   [erg/cm2]
15- 25  2.624e-07   2.663e-08
25- 50  4.885e-07   7.660e-08
50-150  9.764e-07   3.961e-07
15-150  1.727e-06   4.093e-07
Double BB

Spectral model: bbodyrad<1> + bbodyrad<2>
------------------------------------------------------------
Parameters  : value         Lower 90%    Upper 90%
kT1 [keV]   : 7.26138        (-1.1266      1.20089)
R1^2/D10^2  : 0.605590        (-0.250472      0.499751)
kT2 [keV]   : 29.3390        (-5.88008      9.91886)
R2^2/D10^2  : 4.11248E-03    (-0.00252022   0.00506121)
------------------------------------------------------------
#Fit statistic : Chi-Squared =          51.04 using 59 PHA bins.
# Reduced chi-squared =         0.9280 for     55 degrees of freedom
# Null hypothesis probability =   6.266502e-01

Energy  Fluence     90% Error
[keV]   [erg/cm2]   [erg/cm2]
15- 25  2.641e-07   6.113e-08
25- 50  5.049e-07   1.049e-07
50-150  1.011e-06   4.619e-07
15-150  1.780e-06   5.089e-07
Peak spectrum fit
Power-law model

Time interval is from    2.636 sec. to    3.636 sec.

Spectral model in power-law:
------------------------------------------------------------
Parameters  : value       lower 90%   higher 90%
Photon index: 1.71022     ( -0.239026   0.247582 )
Norm@50keV  : 1.48442E-02    ( -0.00214954   0.00211034 )
------------------------------------------------------------
#Fit statistic : Chi-Squared =          77.59 using 59 PHA bins.
# Reduced chi-squared =          1.361 for     57 degrees of freedom
# Null hypothesis probability =   3.621833e-02

Photon flux (15-150 keV)    in 1 sec: 1.97865 ( -0.2728  0.27376 ) ph/cm2/s
Energy fluence (15-150 keV)             : 1.37354e-07 ( -2.05736e-08  2.07417e-08 ) ergs/cm2
Cutoff power-law model

Time interval is from    2.636 sec. to    3.636 sec.
Spectral model in the cutoff power-law:
------------------------------------------------------------
Parameters  : value       lower 90%   higher 90%
Photon index: 1.70423     ( -0.238231   0.459754 )
Epeak [keV] : 9998.88      ( -9999.34 -9999.35 )
Norm@50keV  : 1.48873E-02    ( -0.00216514   0.0224145 )
------------------------------------------------------------
#Fit statistic : Chi-Squared =          77.59 using 59 PHA bins.
# Reduced chi-squared =          1.386 for     56 degrees of freedom
# Null hypothesis probability =   2.964243e-02

Photon flux (15-150 keV)    in 1 sec: 1.98946 (    ) ph/cm2/s
Energy fluence (15-150 keV)             : 1.37683e-07 ( -2.13294e-08  1.60616e-08 ) ergs/cm2
Band function
Time interval is from    2.636 sec. to    3.636 sec.

Spectral model in the Band function:
------------------------------------------------------------
Parameters  : value       lower 90%   higher 90%
alpha       : -1.59998   ( 1.59998   1.59998 )
beta        : -1.71020    ( 1.7102   0.2391 )
Epeak [keV] : 42.6072      ( -42.6124 -42.6124 )
Norm@50keV   : 1.94443E-02    ( -0.00658755   2.28492 )
------------------------------------------------------------
#Fit statistic : Chi-Squared =          77.59 using 59 PHA bins.
# Reduced chi-squared =          1.411 for     55 degrees of freedom
# Null hypothesis probability =   2.407903e-02

Photon flux (15-150 keV)    in 1 sec: 1.97956 ( -0.27435  0.26675 ) ph/cm2/s
Energy fluence (15-150 keV)             : 7.47894e-09 ( 0  0 ) ergs/cm2
Single BB

Spectral model blackbody:
------------------------------------------------------------
Parameters  : value    Lower 90%  Upper 90%
kT [keV]    : 14.3855  (-2.47593  2.98353)
R^2/D10^2   : 0.244775  (-0.120927   0.240766)
(R is the radius in km and D10 is the distance to the source in units of 10 kpc)
------------------------------------------------------------
#Fit statistic : Chi-Squared =          98.46 using 59 PHA bins.
# Reduced chi-squared =          1.727 for     57 degrees of freedom
# Null hypothesis probability =   5.385967e-04

Energy  Fluence     90% Error
[keV]   [erg/cm2]   [erg/cm2]
15- 25  1.067e-08   3.026e-09
25- 50  4.075e-08   8.625e-09
50-150  5.629e-08   1.522e-08
15-150  1.077e-07   2.106e-08
Thermal bremsstrahlung (OTTB)
Spectral model: thermal bremsstrahlung
------------------------------------------------------------
Parameters  : value         Lower 90%    Upper 90%
kT [keV]    : 155.755       (-69.6199      -152.122)
Norm        : 8.00459       (-1.19855     1.68458)
------------------------------------------------------------
#Fit statistic : Chi-Squared =          78.66 using 59 PHA bins.
# Reduced chi-squared =          1.380 for     57 degrees of freedom
# Null hypothesis probability =   3.019799e-02

Energy  Fluence     90% Error
[keV]   [erg/cm2]   [erg/cm2]
15- 25  2.049e-08   1.141e-08
25- 50  3.819e-08   2.054e-08
50-150  7.654e-08   4.476e-08
15-150  1.352e-07   7.515e-08
Double BB
Spectral model: bbodyrad<1> + bbodyrad<2>
------------------------------------------------------------
Parameters  : value         Lower 90%    Upper 90%
kT1 [keV]   : 4.42054        (-1.35147      2.21453)
R1^2/D10^2  : 14.5522        (-11.8217      43.6257)
kT2 [keV]   : 21.5333        (-4.76999      8.82942)
R2^2/D10^2  : 4.89992E-02    (-0.0347527   0.0412954)
------------------------------------------------------------
#Fit statistic : Chi-Squared =          76.65 using 59 PHA bins.
# Reduced chi-squared =          1.394 for     55 degrees of freedom
# Null hypothesis probability =   2.842470e-02

Energy  Fluence     90% Error
[keV]   [erg/cm2]   [erg/cm2]
15- 25  2.529e-08   1.329e-08
25- 50  3.218e-08   1.360e-08
50-150  7.694e-08   4.193e-08
15-150  1.344e-07   5.389e-08
Pre-slew spectrum (Pre-slew PHA with pre-slew DRM)
Power-law model
Spectral model in power-law:
------------------------------------------------------------
Parameters  : value       lower 90%   higher 90%
Photon index: 1.67611     ( -0.121268   0.122542 )
Norm@50keV  : 4.26102E-03    ( -0.000300071   0.000298398 )
------------------------------------------------------------
#Fit statistic : Chi-Squared =          54.78 using 59 PHA bins.
# Reduced chi-squared =         0.9611 for     57 degrees of freedom
# Null hypothesis probability =   5.588192e-01

Photon flux (15-150 keV)    in 44.9 sec: 0.561271 ( -0.0394075  0.0394912 ) ph/cm2/s
Energy fluence (15-150 keV)             : 1.77495e-06 ( -1.31147e-07  1.3187e-07 ) ergs/cm2
Cutoff power-law model

Spectral model in the cutoff power-law:
------------------------------------------------------------
Parameters  : value       lower 90%   higher 90%
Photon index: 1.53162     ( -0.463946   0.253305 )
Epeak [keV] : 160.014      (   )
Norm@50keV  : 5.05197E-03    (     )
------------------------------------------------------------
#Fit statistic : Chi-Squared =          54.45 using 59 PHA bins.
# Reduced chi-squared =         0.9723 for     56 degrees of freedom
# Null hypothesis probability =   5.337658e-01

Photon flux (15-150 keV)    in 44.9 sec: 0.557142 ( -0.041122  0.040563 ) ph/cm2/s
Energy fluence (15-150 keV)             : 1.75638e-06 ( -1.43842e-07  1.42602e-07 ) ergs/cm2
Band function

Spectral model in the Band function:
------------------------------------------------------------
Parameters  : value       lower 90%   higher 90%
alpha       : -0.738338   ( 1.00194   1.00194 )
beta        : -1.76846    ( 1.76471   0.181623 )
Epeak [keV] : 44.1835      ( -44.1501 371.352 )
Norm@50keV   : 1.70700E-02    ( -0.0174831   517.676 )
------------------------------------------------------------
#Fit statistic : Chi-Squared =          53.58 using 59 PHA bins.
# Reduced chi-squared =         0.9742 for     55 degrees of freedom
# Null hypothesis probability =   5.289539e-01

Photon flux (15-150 keV)    in 44.9 sec: 0.562361 ( -0.040192  0.036182 ) ph/cm2/s
Energy fluence (15-150 keV)             : 1.76761e-06 ( -1.24463e-07  1.25154e-07 ) ergs/cm2
S(25-50 keV) vs. S(50-100 keV) plot
S(25-50 keV)  = 4.76e-07
S(50-100 keV) = 5.97e-07
T90 vs. Hardness ratio plot
T90                                   = 35.12399995327 sec.
Hardness ratio (energy fluence ratio) = 1.2542
Color vs. Color plot
Count Ratio  (25-50 keV) / (15-25 keV) = 1.32572
Count Ratio (50-100 keV) / (15-25 keV) = 0.95234
Mask shadow pattern
IMX = -7.902066006743750E-01, IMY = 4.244252734433310E-01
TIME vs. PHA plot around the trigger time

Blue+Cyan dotted lines: Time interval of the scaled map
From 0.000000 to 1.024000
TIME vs. DetID plot around the trigger time
Blue+Cyan dotted lines: Time interval of the scaled map
From 0.000000 to 1.024000
100 us light curve (15-350 keV)

Blue+Cyan dotted lines: Time interval of the scaled map
From 0.000000 to 1.024000
Spacecraft aspect plot
Bright source in the pre-burst/pre-slew/post-slew images
Pre-burst image of 15-350 keV band
Time interval of the image:
-239.816000 -31.384000

# RAcent  DECcent POSerr Theta    Phi  PeakCts   SNR AngSep     Name
#  [deg]    [deg]    ['] [deg]  [deg]                   [']
170.3042 -60.6412    2.2  34.1 -141.4   1.2418   5.2    1.1	Cen X-3
186.7334 -62.7786    1.4  30.5 -154.9   1.9076   8.2    2.2	GX 301-2
256.1243 -37.7531   15.1  41.8  120.0  -0.6136  -0.8    8.5	4U 1700-377
 73.9754 -85.2564    2.8  58.8 -166.2   5.7818   4.1 ------	UNKNOWN
165.1521   1.1408    3.2  50.8  -44.4   3.5835   3.6 ------	UNKNOWN
Pre-slew background subtracted image of 15-350 keV band
Time interval of the image:
-31.384000 13.512000

# RAcent  DECcent POSerr Theta    Phi  PeakCts   SNR AngSep     Name
#  [deg]    [deg]    ['] [deg]  [deg]                   [']
170.4081 -60.7869   22.9  34.1 -141.7  -0.0527  -0.5   10.2	Cen X-3
186.8952 -62.6860    5.9  30.3 -155.0  -0.1787  -2.0    8.3	GX 301-2
256.0147 -37.6301    6.0  41.7  119.8   0.6214   1.9   12.9	4U 1700-377
201.5895  21.6715    2.7  56.0    6.9   2.0122   4.3 ------	UNKNOWN
164.4140 -70.3979    0.5  41.9 -151.8   2.9571  24.0 ------	UNKNOWN
149.1060 -49.6403    2.3  42.5 -118.8   1.2355   5.0 ------	UNKNOWN
150.7087 -43.3416    2.9  41.7 -109.3   1.1886   3.9 ------	UNKNOWN
Post-slew image of 15-350 keV band
Time interval of the image:
239.484600 910.784600

# RAcent  DECcent POSerr Theta    Phi  PeakCts   SNR AngSep     Name
#  [deg]    [deg]    ['] [deg]  [deg]                   [']
244.9794 -15.6425    0.4  30.6   59.4  32.7934  31.3    0.1	Sco X-1
255.9656 -37.8107    1.9  21.4    5.9   3.6961   6.1    2.2	4U 1700-377
256.4512 -36.3809    1.6  20.3    8.9   4.2961   7.2    2.6	GX 349+2
262.9967 -24.7382    9.2  11.9   46.0   0.6799   1.3    0.8	GX 1+4
264.9173 -44.4285    2.6  21.5  -20.1   2.3689   4.4    7.6	4U 1735-44
268.3557  -1.6289    5.5  24.5  118.7  -1.6473  -2.1   10.6	SW J1753.5-0127
270.3320 -25.0733    1.6   5.2   45.1   4.0634   7.3    2.6	GX 5-1
270.2662 -25.7346    3.5   5.3   38.0   1.8815   3.3    2.0	GRS 1758-258
274.0379 -14.0043    2.4  11.1  127.2   2.6425   4.7    2.7	GX 17+2
275.8681 -30.3097    4.3   5.4  -40.1   1.4422   2.7    4.5	H1820-303
285.0627 -25.1312    0.0   8.1 -129.1   0.8649   1.5   12.7	HT1900.1-2455
288.7583  11.0288    2.8  38.0  158.1   4.3663   4.1    5.5	GRS 1915+105
263.0491 -33.6937    3.0  14.3    7.1   1.9771   3.8    9.0	GX 354-0
297.3696  25.1361    3.2  54.1  161.6   9.8796   3.6 ------	UNKNOWN
273.1463 -14.4311    3.8  10.9  122.3   1.6170   3.0 ------	UNKNOWN
266.4322 -29.0285    1.7   9.5   20.2   3.9743   6.9 ------	UNKNOWN
242.3310 -49.5658    4.7  35.9   -4.4   1.8243   2.5 ------	UNKNOWN
322.2877  11.1607    4.0  57.7 -165.4   8.9296   2.9 ------	UNKNOWN
329.4930  -4.3472    5.7  55.2 -145.1   9.7619   2.1 ------	UNKNOWN
Plot creation:
Tue Jul  5 22:30:23 EDT 2016