Estimated redshift from machine learning (Ukwatta et al. 2016) - may take a few minute to calcaulte
Image
Pre-slew 15.0-350.0 keV image (Event data)

#   RAcent    DECcent   POSerr    Theta     Phi              Peak Cts       SNR   Name
  330.2145    29.6607   0.0240    17.3372     6.3478         0.0507269      8.025 TRIG_00701288

Foreground time interval of the image:
  0.048   0.304 (delta_t =   0.256 [sec])
Background time interval of the image:
-239.760   0.048 (delta_t = 239.808 [sec])
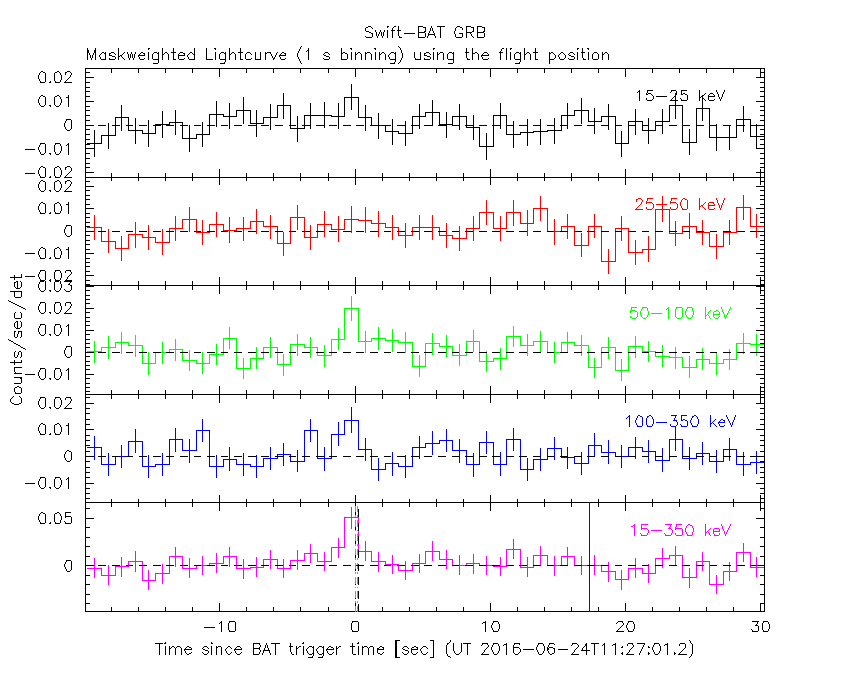
Lightcurves
Notes:
- 1) The mask-weighted light curves are using the flight position.
- 2) Multiple plots of different time binning/intervals are shown to cover all scenarios of short/long GRBs, rate/image triggers, and real/false positives.
- 3) For all the mask-weighted lightcurves, the y-axis units are counts/sec/det where a det is 0.4 x 0.4 = 0.16 sq cm.
- 4) The verticle lines correspond to following: green dotted lines are T50 interval, black dotted lines are T90 interval, blue solid line(s) is a spacecraft slew start time, and orange solid line(s) is a spacecraft slew end time.
- 5) Time of each bin is in the middle of the bin.
1 s binning
From T0-310 s to T0+310 s

From T100_start - 20 s to T100_end + 30 s
Full time interval

64 ms binning
Full time interval

From T100_start to T100_end

From T0-5 sec to T0+5 sec

16 ms binning
From T100_start-5 s to T100_start+5 s

Blue+Cyan dotted lines: Time interval of the scaled map
From 0.000000 to 0.256000
8 ms binning
From T100_start-3 s to T100_start+3 s

Blue+Cyan dotted lines: Time interval of the scaled map
From 0.000000 to 0.256000
2 ms binning
From T100_start-1 s to T100_start+1 s

Blue+Cyan dotted lines: Time interval of the scaled map
From 0.000000 to 0.256000
SN=5 or 10 sec. binning (whichever binning is satisfied first)

SN=5 or 10 sec. binning (T < 200 sec)

Quad-rate summed light curves (from T0-300s to T0+1000s)

Spectral Evolution

Spectra
Notes:
- 1) The fitting includes the systematic errors.
- 2) When the burst includes telescope slew time periods, the fitting uses an average response file made from multiple 5-s response files through out the slew time plus single time preiod for the non-slew times, and weighted by the total counts in the corresponding time period using addrmf. An average response file is needed becuase a spectral fit using the pre-slew DRM will introduce some errors in both a spectral shape and a normalization if the PHA file contains a lot of the slew/post-slew time interval.
- 3) For fits to more complicated models (e.g. a power-law over a cutoff power-law), the BAT team has decided to require a chi-square improvement of more than 6 for each extra dof.
Time averaged spectrum fit using the average DRM
Power-law model

Time interval is from    0.048 sec. to    0.304 sec.

Spectral model in power-law:
------------------------------------------------------------
Parameters  : value       lower 90%   higher 90%
Photon index: 0.333016     ( -0.532842   0.438676 )
Norm@50keV  : 1.14294E-02    ( -0.00334179   0.00294625 )
------------------------------------------------------------
#Fit statistic : Chi-Squared =          60.87 using 59 PHA bins.
# Reduced chi-squared =          1.068 for     57 degrees of freedom
# Null hypothesis probability =   3.383848e-01

Photon flux (15-150 keV)    in 0.256 sec: 1.39897 ( -0.29658  0.29752 ) ph/cm2/s
Energy fluence (15-150 keV)             : 4.29427e-08 ( -9.07858e-09  9.06885e-09 ) ergs/cm2
Cutoff power-law model

Time interval is from    0.048 sec. to    0.304 sec.
Spectral model in the cutoff power-law:
------------------------------------------------------------
Parameters  : value       lower 90%   higher 90%
Photon index: 0.323725     ( -0.669975   0.408896 )
Epeak [keV] : 1.00000E+04      ( -10000 -10000 )
Norm@50keV  : 1.15467E-02    ( -0.00336372   -0.0115466 )
------------------------------------------------------------
#Fit statistic : Chi-Squared =          60.91 using 59 PHA bins.
# Reduced chi-squared =          1.088 for     56 degrees of freedom
# Null hypothesis probability =   3.037590e-01

Photon flux (15-150 keV)    in 0.256 sec: 1.39878 ( -0.29686  0.29697 ) ph/cm2/s
Energy fluence (15-150 keV)             : 4.20311e-08 ( 0  0 ) ergs/cm2
Band function

Time interval is from    0.048 sec. to    0.304 sec.

Spectral model in the Band function:
------------------------------------------------------------
Parameters  : value       lower 90%   higher 90%
alpha       : -1.04501   ( 1.04533   1.04533 )
beta        : -0.332804    ( -0.438697   0.532911 )
Epeak [keV] : 10.5329      ( -10.5299 -10.5299 )
Norm@50keV   : 1.78404E-02    ( -0.00940882   0 )
------------------------------------------------------------
#Fit statistic : Chi-Squared =          60.87 using 59 PHA bins.
# Reduced chi-squared =          1.107 for     55 degrees of freedom
# Null hypothesis probability =   2.728681e-01

Photon flux (15-150 keV)    in 0.256 sec: 1.40710 ( -0.31453  0.29793 ) ph/cm2/s
Energy fluence (15-150 keV)             : 1.39226e-08 ( -1.15996e-08  9.79387e-09 ) ergs/cm2
Single BB

Spectral model blackbody:
------------------------------------------------------------
Parameters  : value    Lower 90%  Upper 90%
kT [keV]    : 47.4241  (-17.2465  65.8838)
R^2/D10^2   : 7.18723E-03  (-0.00716723   0.0148074)
(R is the radius in km and D10 is the distance to the source in units of 10 kpc)
------------------------------------------------------------
#Fit statistic : Chi-Squared =          65.36 using 59 PHA bins.
# Reduced chi-squared =          1.147 for     57 degrees of freedom
# Null hypothesis probability =   2.090277e-01

Energy  Fluence     90% Error
[keV]   [erg/cm2]   [erg/cm2]
15- 25  4.705e-10   2.785e-10
25- 50  3.359e-09   1.932e-09
50-150  3.892e-08   2.154e-08
15-150  4.275e-08   2.427e-08
Thermal bremsstrahlung (OTTB)

Spectral model: thermal bremsstrahlung
------------------------------------------------------------
Parameters  : value         Lower 90%    Upper 90%
kT [keV]    : 200.000       (-51.6931      -200)
Norm        : 5.00610       (-1.20139     1.20139)
------------------------------------------------------------
#Fit statistic : Chi-Squared =          82.31 using 59 PHA bins.
# Reduced chi-squared =          1.444 for     57 degrees of freedom
# Null hypothesis probability =   1.578840e-02

Energy  Fluence     90% Error
[keV]   [erg/cm2]   [erg/cm2]
15- 25  3.204e-09   1.966e-09
25- 50  6.163e-09   3.666e-09
50-150  1.352e-08   7.955e-09
15-150  2.288e-08   1.375e-08
Double BB

Spectral model: bbodyrad<1> + bbodyrad<2>
------------------------------------------------------------
Parameters  : value         Lower 90%    Upper 90%
kT1 [keV]   : 5.70911        (-3.06646      4.74501)
R1^2/D10^2  : 1.91078        (-1.87047      10.6374)
kT2 [keV]   : 76.0281        (-36.9478      -76.0633)
R2^2/D10^2  : 2.56150E-03    (-0.00233173   0.00922217)
------------------------------------------------------------
#Fit statistic : Chi-Squared =          59.16 using 59 PHA bins.
# Reduced chi-squared =          1.076 for     55 degrees of freedom
# Null hypothesis probability =   3.263579e-01

Energy  Fluence     90% Error
[keV]   [erg/cm2]   [erg/cm2]
15- 25  2.259e-09   1.460e-09
25- 50  4.044e-09   2.237e-09
50-150  3.895e-08   2.390e-08
15-150  4.525e-08   2.481e-08
Peak spectrum fit
Power-law model

Time interval is from   -0.292 sec. to    0.708 sec.

Spectral model in power-law:
------------------------------------------------------------
Parameters  : value       lower 90%   higher 90%
Photon index: 0.526356     ( -0.635841   0.512427 )
Norm@50keV  : 4.30760E-03    ( -0.00142877   0.00124466 )
------------------------------------------------------------
#Fit statistic : Chi-Squared =          53.69 using 59 PHA bins.
# Reduced chi-squared =         0.9419 for     57 degrees of freedom
# Null hypothesis probability =   6.000976e-01

Photon flux (15-150 keV)    in 1 sec: 0.508025 ( -0.130674  0.132038 ) ph/cm2/s
Energy fluence (15-150 keV)             : 5.71163e-08 ( -1.42269e-08  1.42445e-08 ) ergs/cm2
Cutoff power-law model

Time interval is from   -0.292 sec. to    0.708 sec.
Spectral model in the cutoff power-law:
------------------------------------------------------------
Parameters  : value       lower 90%   higher 90%
Photon index: 0.544691     ( -0.670245   0.490965 )
Epeak [keV] : 9999.36      ( -9999.36 -9999.36 )
Norm@50keV  : 4.38497E-03    ( -0.00147133   0.00616527 )
------------------------------------------------------------
#Fit statistic : Chi-Squared =          53.72 using 59 PHA bins.
# Reduced chi-squared =         0.9592 for     56 degrees of freedom
# Null hypothesis probability =   5.617365e-01

Photon flux (15-150 keV)    in 1 sec: 0.508194 ( -0.131029  0.131624 ) ph/cm2/s
Energy fluence (15-150 keV)             : 5.62108e-08 ( 0  0 ) ergs/cm2
Band function

Time interval is from   -0.292 sec. to    0.708 sec.

Spectral model in the Band function:
------------------------------------------------------------
Parameters  : value       lower 90%   higher 90%
alpha       : -0.743889   ( 0.745026   0.745026 )
beta        : -0.526512    ( -0.512443   0.636446 )
Epeak [keV] : 16.2636      ( -16.265 -16.265 )
Norm@50keV   : 6.29535E-03    ( -0.0032898   0 )
------------------------------------------------------------
#Fit statistic : Chi-Squared =          53.69 using 59 PHA bins.
# Reduced chi-squared =         0.9761 for     55 degrees of freedom
# Null hypothesis probability =   5.248529e-01

Photon flux (15-150 keV)    in 1 sec: 0.508024 ( -0.130677  0.13204 ) ph/cm2/s
Energy fluence (15-150 keV)             : 5.71163e-08 ( -1.42269e-08  1.42445e-08 ) ergs/cm2
Single BB

Spectral model blackbody:
------------------------------------------------------------
Parameters  : value    Lower 90%  Upper 90%
kT [keV]    : 40.0116  (-15.2096  61.0762)
R^2/D10^2   : 3.67455E-03  (-0.00365987   0.00962592)
(R is the radius in km and D10 is the distance to the source in units of 10 kpc)
------------------------------------------------------------
#Fit statistic : Chi-Squared =          57.43 using 59 PHA bins.
# Reduced chi-squared =          1.008 for     57 degrees of freedom
# Null hypothesis probability =   4.591591e-01

Energy  Fluence     90% Error
[keV]   [erg/cm2]   [erg/cm2]
15- 25  7.589e-10   4.601e-10
25- 50  5.177e-09   3.099e-09
50-150  4.950e-08   2.925e-08
15-150  5.544e-08   3.180e-08
Thermal bremsstrahlung (OTTB)

Spectral model: thermal bremsstrahlung
------------------------------------------------------------
Parameters  : value         Lower 90%    Upper 90%
kT [keV]    : 200.000       (-66.4854      -200)
Norm        : 2.02234       (-0.545253     0.545253)
------------------------------------------------------------
#Fit statistic : Chi-Squared =          65.28 using 59 PHA bins.
# Reduced chi-squared =          1.145 for     57 degrees of freedom
# Null hypothesis probability =   2.109817e-01

Energy  Fluence     90% Error
[keV]   [erg/cm2]   [erg/cm2]
15- 25  5.035e-09   3.051e-09
25- 50  9.686e-09   5.840e-09
50-150  2.124e-08   1.312e-08
15-150  3.596e-08   2.168e-08
Double BB

Spectral model: bbodyrad<1> + bbodyrad<2>
------------------------------------------------------------
Parameters  : value         Lower 90%    Upper 90%
kT1 [keV]   : 6.04069        (-3.58222      5.95794)
R1^2/D10^2  : 0.673645        (-0.660563      41.7601)
kT2 [keV]   : 65.0981        (-33.4059      -65.208)
R2^2/D10^2  : 1.14883E-03    (-0.00101753   0.00620421)
------------------------------------------------------------
#Fit statistic : Chi-Squared =          52.47 using 59 PHA bins.
# Reduced chi-squared =         0.9541 for     55 degrees of freedom
# Null hypothesis probability =   5.717246e-01

Energy  Fluence     90% Error
[keV]   [erg/cm2]   [erg/cm2]
15- 25  3.727e-09   2.622e-09
25- 50  6.608e-09   3.703e-09
50-150  5.032e-08   2.735e-08
15-150  6.065e-08   3.122e-08
Pre-slew spectrum (Pre-slew PHA with pre-slew DRM)
Power-law model

Spectral model in power-law:
------------------------------------------------------------
Parameters  : value       lower 90%   higher 90%
Photon index: 0.333016     ( -0.532842   0.438676 )
Norm@50keV  : 1.14294E-02    ( -0.00334179   0.00294625 )
------------------------------------------------------------
#Fit statistic : Chi-Squared =          60.87 using 59 PHA bins.
# Reduced chi-squared =          1.068 for     57 degrees of freedom
# Null hypothesis probability =   3.383848e-01

Photon flux (15-150 keV)    in 0.256 sec: 1.39898 ( -0.296581  0.297531 ) ph/cm2/s
Energy fluence (15-150 keV)             : 4.29402e-08 ( -9.06327e-09  9.06903e-09 ) ergs/cm2
Cutoff power-law model

Spectral model in the cutoff power-law:
------------------------------------------------------------
Parameters  : value       lower 90%   higher 90%
Photon index: 0.323888     ( -0.673328   0.406184 )
Epeak [keV] : 1.00000E+04      ( -10000 -10000 )
Norm@50keV  : 1.15475E-02    ( -0.00336444   -0.0115473 )
------------------------------------------------------------
#Fit statistic : Chi-Squared =          60.91 using 59 PHA bins.
# Reduced chi-squared =          1.088 for     56 degrees of freedom
# Null hypothesis probability =   3.037587e-01

Photon flux (15-150 keV)    in 0.256 sec: 1.40490 ( -0.30342  0.29174 ) ph/cm2/s
Energy fluence (15-150 keV)             : 4.30441e-08 ( -9.17453e-09  8.71629e-09 ) ergs/cm2
Band function

Spectral model in the Band function:
------------------------------------------------------------
Parameters  : value       lower 90%   higher 90%
alpha       : -1.04501   ( 1.04533   1.04533 )
beta        : -0.332804    ( -0.438697   0.532911 )
Epeak [keV] : 10.5329      ( -10.5299 -10.5299 )
Norm@50keV   : 1.78404E-02    ( -0.00940882   0 )
------------------------------------------------------------
#Fit statistic : Chi-Squared =          60.87 using 59 PHA bins.
# Reduced chi-squared =          1.107 for     55 degrees of freedom
# Null hypothesis probability =   2.728681e-01

Photon flux (15-150 keV)    in 0.256 sec: 1.40710 ( -0.31453  0.29793 ) ph/cm2/s
Energy fluence (15-150 keV)             : 1.39226e-08 ( -1.15996e-08  9.79387e-09 ) ergs/cm2
S(25-50 keV) vs. S(50-100 keV) plot

S(25-50 keV)  = 4.81e-09
S(50-100 keV) = 1.53e-08
T90 vs. Hardness ratio plot

T90                                   = 0.191999971866608 sec.
Hardness ratio (energy fluence ratio) = 3.18087
Color vs. Color plot

Count Ratio  (25-50 keV) / (15-25 keV) = 0.814332
Count Ratio (50-100 keV) / (15-25 keV) = 1.66976
Mask shadow pattern

IMX = 3.102636974898729E-01, IMY = -3.451520371752392E-02
TIME vs. PHA plot around the trigger time

Blue+Cyan dotted lines: Time interval of the scaled map
From 0.000000 to 0.256000
TIME vs. DetID plot around the trigger time

Blue+Cyan dotted lines: Time interval of the scaled map
From 0.000000 to 0.256000
100 us light curve (15-350 keV)

Blue+Cyan dotted lines: Time interval of the scaled map
From 0.000000 to 0.256000
Spacecraft aspect plot

Bright source in the pre-burst/pre-slew/post-slew images
Pre-burst image of 15-350 keV band
Time interval of the image:
-239.760000 0.048000

# RAcent  DECcent POSerr Theta    Phi  PeakCts   SNR AngSep     Name
#  [deg]    [deg]    ['] [deg]  [deg]                   [']
254.5587  35.3133    5.0  46.9  157.7   1.2826   2.3    5.2	Her X-1
288.7794  10.9512    3.7  38.9   99.3   2.2755   3.1    1.2	GRS 1915+105
299.5941  35.2002    0.3  14.1  120.5   7.9626  33.9    0.2	Cyg X-1
308.1119  40.9633    1.4   5.5  134.8   1.6448   8.6    0.6	Cyg X-3
326.1218  38.2333    3.0   9.1  -13.1   0.8565   3.9    5.8	Cyg X-2
233.9295  46.6831    2.3  55.6  179.7   4.9092   5.0 ------	UNKNOWN
Pre-slew background subtracted image of 15-350 keV band
Time interval of the image:
0.048000 0.304000

# RAcent  DECcent POSerr Theta    Phi  PeakCts   SNR AngSep     Name
#  [deg]    [deg]    ['] [deg]  [deg]                   [']
254.2589  35.4099    5.3  47.0  158.0   0.0397   2.2   10.5	Her X-1
288.7793  10.9513   13.0  38.9   99.3   0.0233   0.9    1.2	GRS 1915+105
299.4130  35.1064    6.2  14.2  120.5   0.0132   1.9   10.4	Cyg X-1
308.3654  40.9862    5.9   5.3  134.5   0.0117   2.0   11.7	Cyg X-3
326.1965  38.2146   16.9   9.2  -13.2   0.0041   0.7    6.5	Cyg X-2
305.3532  10.8861    2.0  32.5   73.4   0.0708   5.8 ------	UNKNOWN
280.7112  37.8158    2.0  26.7  147.3   0.0434   5.7 ------	UNKNOWN
330.2144  29.6607    1.4  17.3    6.3   0.0507   8.0 ------	UNKNOWN
Post-slew image of 15-350 keV band
Time interval of the image:
57.740600 156.619000
158.240000 602.480000

# RAcent  DECcent POSerr Theta    Phi  PeakCts   SNR AngSep     Name
#  [deg]    [deg]    ['] [deg]  [deg]                   [']
299.5890  35.2129    1.7  26.3  148.3  12.7651   6.8    0.7	Cyg X-1
307.9654  40.9572    3.3  21.3  166.2   5.4877   3.5    6.6	Cyg X-3
326.2224  38.1620    5.6   9.2 -162.0   2.9390   2.1    9.9	Cyg X-2
291.4647  29.5969    2.5  33.5  137.9  10.8948   4.7 ------	UNKNOWN
357.5808  18.3022    3.1  27.4  -33.7   6.1100   3.8 ------	UNKNOWN
  6.9497  73.8184    2.5  48.0 -129.0  30.2045   4.6 ------	UNKNOWN
Plot creation:
Fri Jul 15 14:49:25 EDT 2016