Estimated redshift from machine learning (Ukwatta et al. 2016) - may take a few minute to calcaulte
Image
Pre-slew 15.0-350.0 keV image (Event data)
#   RAcent    DECcent   POSerr    Theta     Phi              Peak Cts       SNR   Name
  176.9390   -65.1419   0.0046    32.6557    26.2261         6.2026132     41.972 TRIG_00701503

Foreground time interval of the image:
-15.036  47.412 (delta_t =  62.448 [sec])
Background time interval of the image:
-223.635 -15.036 (delta_t = 208.599 [sec])
Lightcurves
Notes:
- 1) The mask-weighted light curves are using the flight position.
- 2) Multiple plots of different time binning/intervals are shown to cover all scenarios of short/long GRBs, rate/image triggers, and real/false positives.
- 3) For all the mask-weighted lightcurves, the y-axis units are counts/sec/det where a det is 0.4 x 0.4 = 0.16 sq cm.
- 4) The verticle lines correspond to following: green dotted lines are T50 interval, black dotted lines are T90 interval, blue solid line(s) is a spacecraft slew start time, and orange solid line(s) is a spacecraft slew end time.
- 5) Time of each bin is in the middle of the bin.
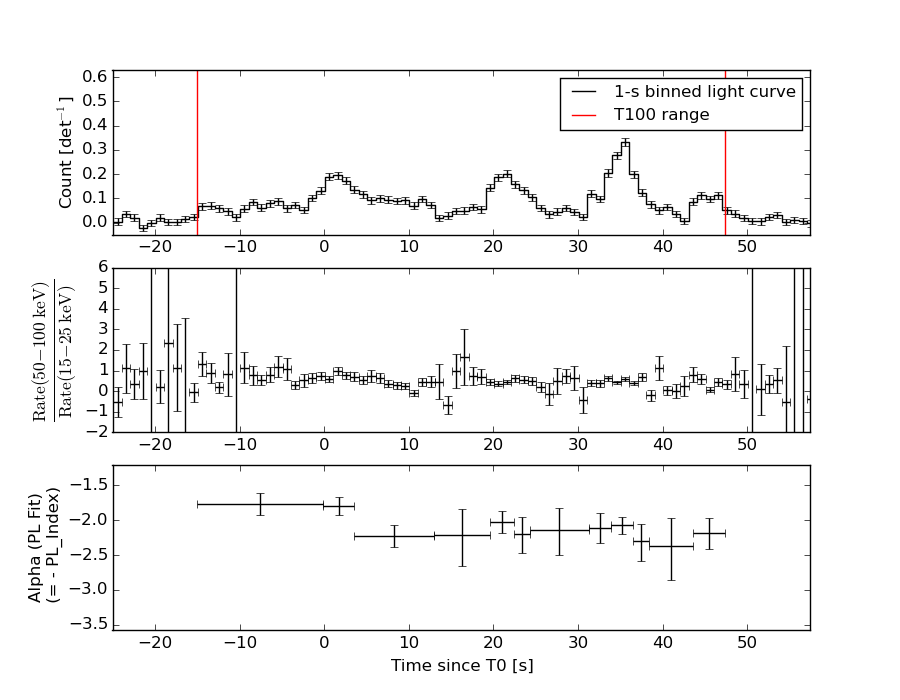
1 s binning
From T0-310 s to T0+310 s
From T100_start - 20 s to T100_end + 30 s
Full time interval
64 ms binning
Full time interval

From T100_start to T100_end
From T0-5 sec to T0+5 sec

16 ms binning
From T100_start-5 s to T100_start+5 s

Blue+Cyan dotted lines: Time interval of the scaled map
From 0.000000 to 1.024000
8 ms binning
From T100_start-3 s to T100_start+3 s
Blue+Cyan dotted lines: Time interval of the scaled map
From 0.000000 to 1.024000
2 ms binning
From T100_start-1 s to T100_start+1 s
Blue+Cyan dotted lines: Time interval of the scaled map
From 0.000000 to 1.024000
SN=5 or 10 sec. binning (whichever binning is satisfied first)
SN=5 or 10 sec. binning (T < 200 sec)

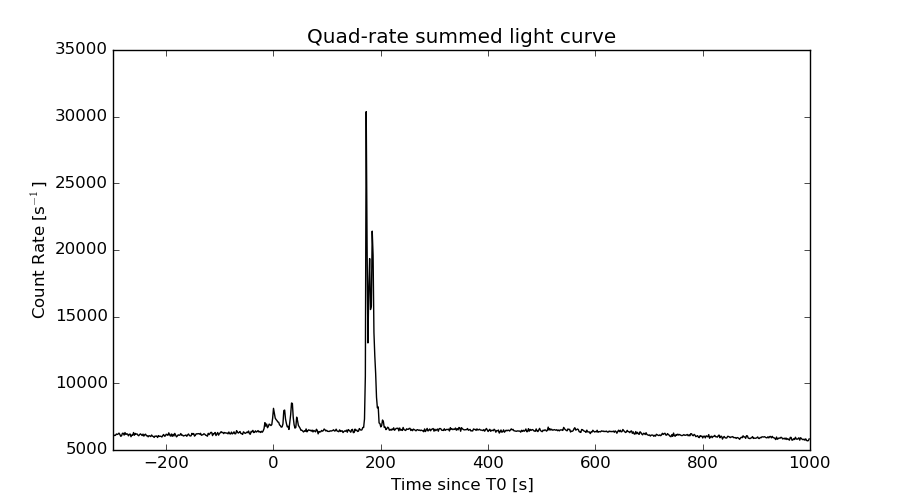
Quad-rate summed light curves (from T0-300s to T0+1000s)
Spectral Evolution
Spectra
Notes:
- 1) The fitting includes the systematic errors.
- 2) When the burst includes telescope slew time periods, the fitting uses an average response file made from multiple 5-s response files through out the slew time plus single time preiod for the non-slew times, and weighted by the total counts in the corresponding time period using addrmf. An average response file is needed becuase a spectral fit using the pre-slew DRM will introduce some errors in both a spectral shape and a normalization if the PHA file contains a lot of the slew/post-slew time interval.
- 3) For fits to more complicated models (e.g. a power-law over a cutoff power-law), the BAT team has decided to require a chi-square improvement of more than 6 for each extra dof.
Time averaged spectrum fit using the average DRM
Power-law model
Time interval is from  -15.036 sec. to   47.412 sec.

Spectral model in power-law:
------------------------------------------------------------
Parameters  : value       lower 90%   higher 90%
Photon index: 2.08572     ( -0.0738729   0.0749813 )
Norm@50keV  : 5.70478E-03    ( -0.000234604   0.000232899 )
------------------------------------------------------------
#Fit statistic : Chi-Squared =          37.66 using 59 PHA bins.
# Reduced chi-squared =         0.6607 for     57 degrees of freedom
# Null hypothesis probability =   9.775503e-01

Photon flux (15-150 keV)    in 62.45 sec: 0.891310 ( -0.034842  0.034995 ) ph/cm2/s
Energy fluence (15-150 keV)             : 3.30623e-06 ( -1.25676e-07  1.26208e-07 ) ergs/cm2
Cutoff power-law model

Time interval is from  -15.036 sec. to   47.412 sec.
Spectral model in the cutoff power-law:
------------------------------------------------------------
Parameters  : value       lower 90%   higher 90%
Photon index: 1.91665     ( -0.308917   0.17478 )
Epeak [keV] : 22.7086      ( -20.9684 27.2246 )
Norm@50keV  : 7.00540E-03    (     )
------------------------------------------------------------
#Fit statistic : Chi-Squared =          36.67 using 59 PHA bins.
# Reduced chi-squared =         0.6548 for     56 degrees of freedom
# Null hypothesis probability =   9.787289e-01

Photon flux (15-150 keV)    in 62.45 sec: 0.879768 ( -0.039735  0.037141 ) ph/cm2/s
Energy fluence (15-150 keV)             : 0 ( 0  0 ) ergs/cm2
Band function
Time interval is from  -15.036 sec. to   47.412 sec.

Spectral model in the Band function:
------------------------------------------------------------
Parameters  : value       lower 90%   higher 90%
alpha       : -1.91648   ( -6.19009   0.0910079 )
beta        : -10.00000    ( 10   2.84217e-14 )
Epeak [keV] : 22.7321      ( -12.2709 17.5023 )
Norm@50keV   : 7.00463E-03    ( -0.000249766   0.00312224 )
------------------------------------------------------------
#Fit statistic : Chi-Squared =          36.67 using 59 PHA bins.
# Reduced chi-squared =         0.6667 for     55 degrees of freedom
# Null hypothesis probability =   9.729632e-01

Photon flux (15-150 keV)    in 62.45 sec: 0.868543 ( -0.042115  0.041726 ) ph/cm2/s
Energy fluence (15-150 keV)             : 1.11097e-06 ( 0  0 ) ergs/cm2
Single BB

Spectral model blackbody:
------------------------------------------------------------
Parameters  : value    Lower 90%  Upper 90%
kT [keV]    : 10.6800  (  )
R^2/D10^2   : 0.293940  (   )
(R is the radius in km and D10 is the distance to the source in units of 10 kpc)
------------------------------------------------------------
#Fit statistic : Chi-Squared =         202.31 using 59 PHA bins.
# Reduced chi-squared =         3.5492 for     57 degrees of freedom
# Null hypothesis probability =   3.833682e-18

Energy  Fluence     90% Error
[keV]   [erg/cm2]   [erg/cm2]
15- 25  4.347e-07   2.767e-08
25- 50  1.183e-06   5.058e-08
50-150  7.445e-07   7.432e-08
15-150  2.362e-06   9.555e-08
Thermal bremsstrahlung (OTTB)
Spectral model: thermal bremsstrahlung
------------------------------------------------------------
Parameters  : value         Lower 90%    Upper 90%
kT [keV]    : 65.7358       (-7.2263      8.64502)
Norm        : 4.31756       (-0.294238     0.321034)
------------------------------------------------------------
#Fit statistic : Chi-Squared =          45.93 using 59 PHA bins.
# Reduced chi-squared =         0.8057 for     57 degrees of freedom
# Null hypothesis probability =   8.530168e-01

Energy  Fluence     90% Error
[keV]   [erg/cm2]   [erg/cm2]
15- 25  6.867e-07   3.778e-08
25- 50  1.074e-06   4.090e-08
50-150  1.315e-06   1.168e-07
15-150  3.075e-06   1.261e-07
Double BB
Spectral model: bbodyrad<1> + bbodyrad<2>
------------------------------------------------------------
Parameters  : value         Lower 90%    Upper 90%
kT1 [keV]   : 6.56355        (-0.771257      0.77174)
R1^2/D10^2  : 1.50914        (-0.492896      0.887411)
kT2 [keV]   : 23.1374        (-3.7305      5.49061)
R2^2/D10^2  : 1.01523E-02    (-0.00553982   0.0104367)
------------------------------------------------------------
#Fit statistic : Chi-Squared =          45.42 using 59 PHA bins.
# Reduced chi-squared =         0.8258 for     55 degrees of freedom
# Null hypothesis probability =   8.181600e-01

Energy  Fluence     90% Error
[keV]   [erg/cm2]   [erg/cm2]
15- 25  6.684e-07   5.880e-08
25- 50  1.065e-06   8.212e-08
50-150  1.430e-06   2.676e-07
15-150  3.164e-06   3.307e-07
Peak spectrum fit
Power-law model

Time interval is from   35.072 sec. to   36.072 sec.

Spectral model in power-law:
------------------------------------------------------------
Parameters  : value       lower 90%   higher 90%
Photon index: 1.97037     ( -0.145685   0.151224 )
Norm@50keV  : 2.02823E-02    ( -0.00197016   0.00193653 )
------------------------------------------------------------
#Fit statistic : Chi-Squared =          53.89 using 59 PHA bins.
# Reduced chi-squared =         0.9455 for     57 degrees of freedom
# Null hypothesis probability =   5.923430e-01

Photon flux (15-150 keV)    in 1 sec: 3.00186 ( -0.24693  0.24711 ) ph/cm2/s
Energy fluence (15-150 keV)             : 1.86819e-07 ( -1.72994e-08  1.74865e-08 ) ergs/cm2
Cutoff power-law model
Time interval is from   35.072 sec. to   36.072 sec.
Spectral model in the cutoff power-law:
------------------------------------------------------------
Parameters  : value       lower 90%   higher 90%
Photon index: 1.63316     ( -0.638772   0.55225 )
Epeak [keV] : 47.6538      (   )
Norm@50keV  : 3.13839E-02    (     )
------------------------------------------------------------
#Fit statistic : Chi-Squared =          52.85 using 59 PHA bins.
# Reduced chi-squared =         0.9437 for     56 degrees of freedom
# Null hypothesis probability =   5.949192e-01

Photon flux (15-150 keV)    in 1 sec: 2.96580 ( -0.25431  0.25412 ) ph/cm2/s
Energy fluence (15-150 keV)             : 0 ( 0  0 ) ergs/cm2
Band function
Time interval is from   35.072 sec. to   36.072 sec.

Spectral model in the Band function:
------------------------------------------------------------
Parameters  : value       lower 90%   higher 90%
alpha       : 8.54025E-02   ( -2.33575   -0.0825126 )
beta        : -2.17214    ( 2.1706   0.247027 )
Epeak [keV] : 30.4427      ( -11.4207 32.8635 )
Norm@50keV   : 0.507089    ( -0.499913   2185.05 )
------------------------------------------------------------
#Fit statistic : Chi-Squared =          50.73 using 59 PHA bins.
# Reduced chi-squared =         0.9223 for     55 degrees of freedom
# Null hypothesis probability =   6.384352e-01

Photon flux (15-150 keV)    in 1 sec: 3.00186 ( -0.24693  0.24711 ) ph/cm2/s
Energy fluence (15-150 keV)             : 3.17117e-14 ( 0  0 ) ergs/cm2
Single BB
Spectral model blackbody:
------------------------------------------------------------
Parameters  : value    Lower 90%  Upper 90%
kT [keV]    : 9.94620  (-1.00509  1.15581)
R^2/D10^2   : 1.40808  (-0.484973   0.721007)
(R is the radius in km and D10 is the distance to the source in units of 10 kpc)
------------------------------------------------------------
#Fit statistic : Chi-Squared =          88.46 using 59 PHA bins.
# Reduced chi-squared =          1.552 for     57 degrees of freedom
# Null hypothesis probability =   4.774733e-03

Energy  Fluence     90% Error
[keV]   [erg/cm2]   [erg/cm2]
15- 25  2.832e-08   4.190e-09
25- 50  6.987e-08   6.585e-09
50-150  3.590e-08   8.585e-09
15-150  1.341e-07   1.390e-08
Thermal bremsstrahlung (OTTB)

Spectral model: thermal bremsstrahlung
------------------------------------------------------------
Parameters  : value         Lower 90%    Upper 90%
kT [keV]    : 72.8751       (-16.6204      24.865)
Norm        : 14.5073       (-1.8437     2.1763)
------------------------------------------------------------
#Fit statistic : Chi-Squared =          53.53 using 59 PHA bins.
# Reduced chi-squared =         0.9391 for     57 degrees of freedom
# Null hypothesis probability =   6.061812e-01

Energy  Fluence     90% Error
[keV]   [erg/cm2]   [erg/cm2]
15- 25  3.737e-08   4.295e-09
25- 50  6.009e-08   4.830e-09
50-150  7.949e-08   1.700e-08
15-150  1.770e-07   1.940e-08
Double BB

Spectral model: bbodyrad<1> + bbodyrad<2>
------------------------------------------------------------
Parameters  : value         Lower 90%    Upper 90%
kT1 [keV]   : 6.55926        (-1.20554      1.26678)
R1^2/D10^2  : 5.36967        (-2.46255      3.43071)
kT2 [keV]   : 24.0944        (-6.27903      13.9746)
R2^2/D10^2  : 3.21066E-02    (-0.0256185   0.0754936)
------------------------------------------------------------
#Fit statistic : Chi-Squared =          50.71 using 59 PHA bins.
# Reduced chi-squared =         0.9220 for     55 degrees of freedom
# Null hypothesis probability =   6.390849e-01

Energy  Fluence     90% Error
[keV]   [erg/cm2]   [erg/cm2]
15- 25  3.781e-08   1.123e-08
25- 50  5.990e-08   1.487e-08
50-150  8.483e-08   4.267e-08
15-150  1.826e-07   5.978e-08
Pre-slew spectrum (Pre-slew PHA with pre-slew DRM)
Power-law model

Spectral model in power-law:
------------------------------------------------------------
Parameters  : value       lower 90%   higher 90%
Photon index: 2.08572     ( -0.0738729   0.0749813 )
Norm@50keV  : 5.70478E-03    ( -0.000234604   0.000232899 )
------------------------------------------------------------
#Fit statistic : Chi-Squared =          37.66 using 59 PHA bins.
# Reduced chi-squared =         0.6607 for     57 degrees of freedom
# Null hypothesis probability =   9.775503e-01

Photon flux (15-150 keV)    in 62.45 sec: 0.891239 ( -0.0348362  0.0349877 ) ph/cm2/s
Energy fluence (15-150 keV)             : 3.30564e-06 ( -1.25747e-07  1.26191e-07 ) ergs/cm2
Cutoff power-law model

Spectral model in the cutoff power-law:
------------------------------------------------------------
Parameters  : value       lower 90%   higher 90%
Photon index: 1.91681     ( -0.309079   0.175064 )
Epeak [keV] : 22.6857      ( -20.9439 27.2498 )
Norm@50keV  : 7.00399E-03    (     )
------------------------------------------------------------
#Fit statistic : Chi-Squared =          36.67 using 59 PHA bins.
# Reduced chi-squared =         0.6548 for     56 degrees of freedom
# Null hypothesis probability =   9.787289e-01

Photon flux (15-150 keV)    in 62.45 sec: 0.879518 ( -0.03969  0.039765 ) ph/cm2/s
Energy fluence (15-150 keV)             : 3.2514e-06 ( -1.56687e-07  1.53271e-07 ) ergs/cm2
Band function

Spectral model in the Band function:
------------------------------------------------------------
Parameters  : value       lower 90%   higher 90%
alpha       : -1.91648   ( -6.19009   0.0910079 )
beta        : -10.00000    ( 10   20 )
Epeak [keV] : 22.7321      ( -12.2708 17.5023 )
Norm@50keV   : 7.00463E-03    ( -0.000249766   0.00312224 )
------------------------------------------------------------
#Fit statistic : Chi-Squared =          36.67 using 59 PHA bins.
# Reduced chi-squared =         0.6667 for     55 degrees of freedom
# Null hypothesis probability =   9.729632e-01

Photon flux (15-150 keV)    in 62.45 sec: 0.868543 ( -0.042115  0.041726 ) ph/cm2/s
Energy fluence (15-150 keV)             : 1.11097e-06 ( 0  0 ) ergs/cm2
S(25-50 keV) vs. S(50-100 keV) plot

S(25-50 keV)  = 1.02e-06
S(50-100 keV) = 9.62e-07
T90 vs. Hardness ratio plot
T90                                   = 53.9199999570847 sec.
Hardness ratio (energy fluence ratio) = 0.943137
Color vs. Color plot
Count Ratio  (25-50 keV) / (15-25 keV) = 1.04358
Count Ratio (50-100 keV) / (15-25 keV) = 0.509959
Mask shadow pattern
IMX = 5.749219583029950E-01, IMY = -2.832223970030819E-01
TIME vs. PHA plot around the trigger time

Blue+Cyan dotted lines: Time interval of the scaled map
From 0.000000 to 1.024000
TIME vs. DetID plot around the trigger time
Blue+Cyan dotted lines: Time interval of the scaled map
From 0.000000 to 1.024000
100 us light curve (15-350 keV)
Blue+Cyan dotted lines: Time interval of the scaled map
From 0.000000 to 1.024000
Spacecraft aspect plot
Bright source in the pre-burst/pre-slew/post-slew images
Pre-burst image of 15-350 keV band
Time interval of the image:
-223.635410 -15.036000

# RAcent  DECcent POSerr Theta    Phi  PeakCts   SNR AngSep     Name
#  [deg]    [deg]    ['] [deg]  [deg]                   [']
135.6279 -40.5209    4.4  39.0  -32.7   0.7680   2.6    5.0	Vela X-1
170.5794 -60.6355    6.4  34.2   16.9   0.4394   1.8    7.8	Cen X-3
186.6440 -62.7894    3.7  37.1   29.6   0.9524   3.1    1.2	GX 301-2
 38.3719 -29.7494    2.7  47.4 -160.9   1.6146   4.2 ------	UNKNOWN
 37.1204 -21.0731    3.2  55.9 -158.6   3.4513   3.6 ------	UNKNOWN
Pre-slew background subtracted image of 15-350 keV band
Time interval of the image:
-15.036000 47.412000

# RAcent  DECcent POSerr Theta    Phi  PeakCts   SNR AngSep     Name
#  [deg]    [deg]    ['] [deg]  [deg]                   [']
135.5975 -40.3913    0.0  39.2  -32.8  -0.1867  -1.2   10.3	Vela X-1
170.6001 -60.6056    7.7  34.3   16.9  -0.2163  -1.5    8.4	Cen X-3
186.5725 -62.7819    7.5  37.1   29.5  -0.2734  -1.5    2.4	GX 301-2
298.8094 -68.0625    2.4  40.7   96.2   2.2284   4.7 ------	UNKNOWN
184.5102 -47.8549    2.0  49.3   16.7   1.6375   5.8 ------	UNKNOWN
176.9390 -65.1419    0.3  32.7   26.2   6.2028  42.0 ------	UNKNOWN
 16.5637 -45.1538    2.6  40.8  167.0   0.8387   4.5 ------	UNKNOWN
101.1241 -66.0845    2.8   7.0  -31.1   0.4001   4.1 ------	UNKNOWN
Post-slew image of 15-350 keV band
Time interval of the image:
Plot creation:
Fri Jul 15 14:46:11 EDT 2016