Estimated redshift from machine learning (Ukwatta et al. 2016) - may take a few minutes to calcaulte
Image
Pre-slew 15-350 keV image (Event data; bkg subtracted)

#   RAcent  DECcent POSerr  Theta    Phi     Peak Cts     SNR  Name
  293.7302 +21.8871 0.0017   25.5   23.1      29.5156   109.5  TRIG_00701590
------------------------------------------

Foreground time interval of the image:
 -0.220   0.668 (delta_t =   0.888 [sec])
Background time interval of the image:
-185.159 -143.100 (delta_t =  42.059 [sec])
-142.360  -0.220 (delta_t = 142.140 [sec])
Lightcurves
Notes:
- 1) All plots contain as much data as has been downloaded to date.
- 2) The mask-weighted light curves are using the flight position.
- 3) Multiple plots of different time binning/intervals are shown to cover all scenarios of short/long GRBs, rate/image triggers, and real/false positives.
- 4) For all the mask-weighted lightcurves, the y-axis units are counts/sec/det where a det is 0.4 x 0.4 = 0.16 sq cm.
- 5) The verticle lines correspond to following: green dotted lines are T50 interval, black dotted lines are T90 interval, blue solid line(s) is a spacecraft slew start time, and orange solid line(s) is a spacecraft slew end time.
- 6) Time of each bin is in the middle of the bin.
1 s binning
From T0-310 s to T0+310 s

From T100_start - 20 s to T100_end + 30 s

Full time interval

64 ms binning
Full time interval

From T100_start to T100_end

From T0-5 sec to T0+5 sec

16 ms binning
From T100_start-5 s to T100_start+5 s

8 ms binning
From T100_start-3 s to T100_start+3 s

2 ms binning
From T100_start-1 s to T100_start+1 s

SN=5 or 10 sec. binning (whichever binning is satisfied first)

SN=5 or 10 sec. binning (T < 200 sec)

Spectra
Notes:
- 1) The fitting includes the systematic errors.
- 2) For long bursts, a spectral fit of the pre-slew DRM will introduce some errors in both a spectral shape and a normalization if the PHA file contains a lot of the slew/post-slew time interval.
- 3) For fits to more complicated models (e.g. a power-law over a cutoff power-law), the BAT team has decided to require a chi-square improvement of more than 6 for each extra dof.
- 4) For short bursts (T90<1sec), the specrtum is also fit with Blackbody, OTTB, and Double Blackbody.
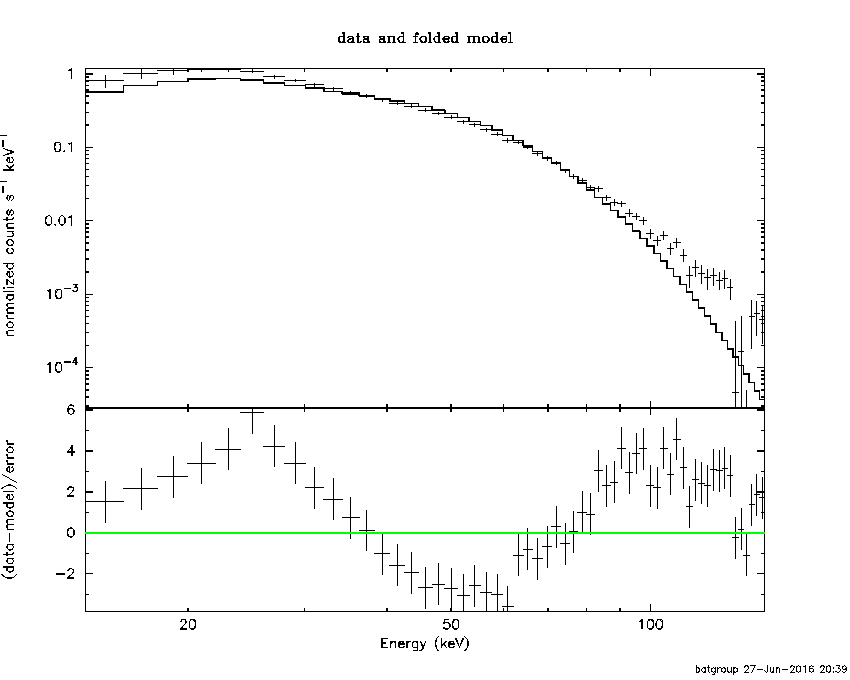
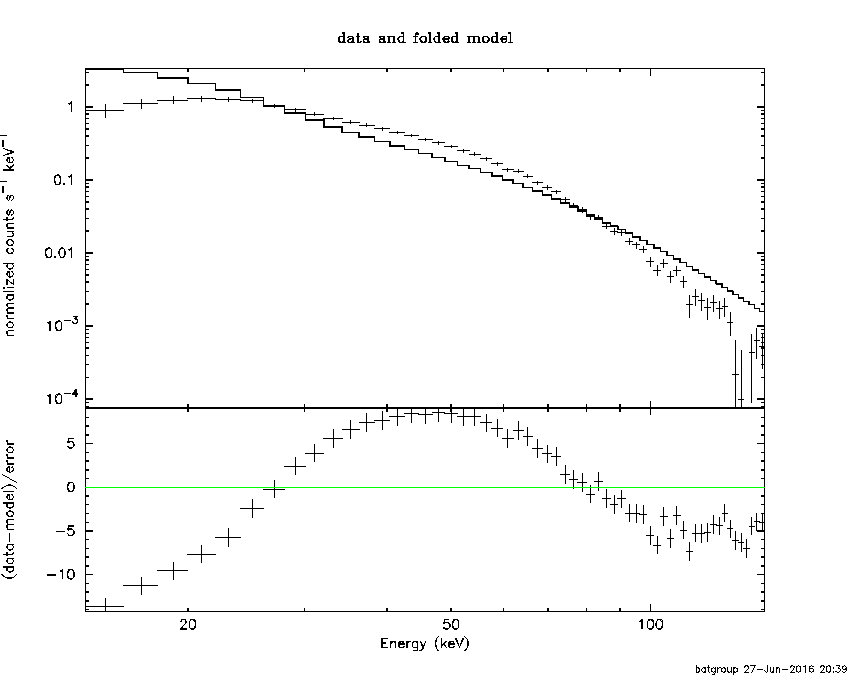
Time averaged spectrum fit using the pre-slew DRM
Power-law model

Time interval is from   -0.220 sec. to    0.668 sec.

Spectral model in power-law:
------------------------------------------------------------
Parameters  : value       lower 90%   higher 90%
Photon index: 3.09617     (     )
Norm@50keV  : 1.26054    (     )
------------------------------------------------------------
#Fit statistic : Chi-Squared =        2024.57 using 59 PHA bins.
# Reduced chi-squared =        35.5187 for     57 degrees of freedom
# Null hypothesis probability =   0.000000e+00

Photon flux (15-150 keV)    in 0.888 sec: 372.120 (    ) ph/cm2/s
Energy fluence (15-150 keV)             : 1.408e-05 ( 0  0 ) ergs/cm2
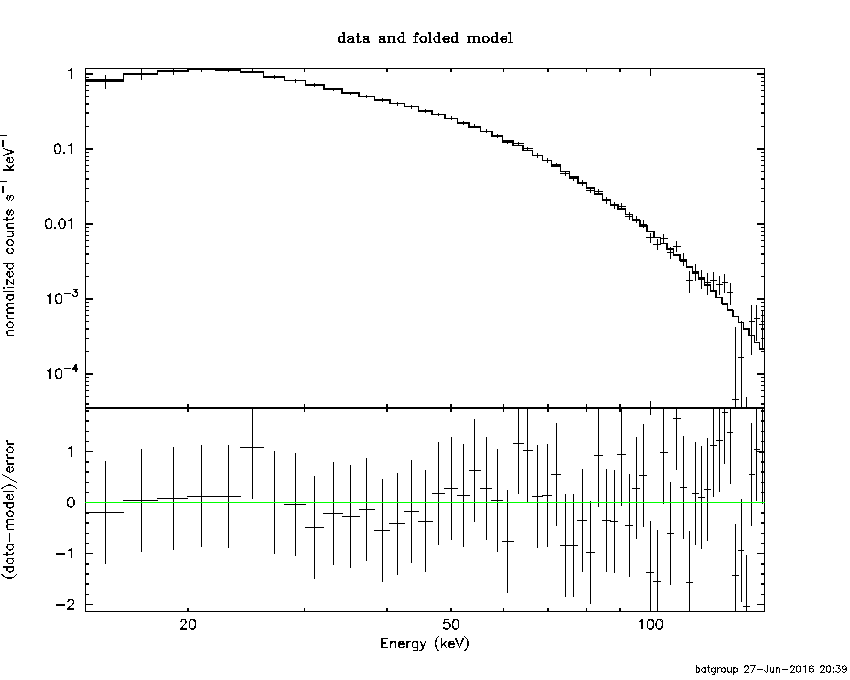
Cutoff power-law model

Time interval is from   -0.220 sec. to    0.668 sec.
Spectral model in the cutoff power-law:
------------------------------------------------------------
Parameters  : value       lower 90%   higher 90%
Photon index: 0.171094     ( -0.146257   0.142603 )
Epeak [keV] : 32.4553      ( -1.07011 1.00802 )
Norm@50keV  : 34.1964    ( -4.88587   5.85479 )
------------------------------------------------------------
#Fit statistic : Chi-Squared =          60.44 using 59 PHA bins.
# Reduced chi-squared =          1.079 for     56 degrees of freedom
# Null hypothesis probability =   3.185512e-01

Photon flux (15-150 keV)    in 0.888 sec: 286.364 ( -7.64  7.715 ) ph/cm2/s
Energy fluence (15-150 keV)             : 1.2807e-05 ( 0  0 ) ergs/cm2
Band function

Time interval is from   -0.220 sec. to    0.668 sec.

Spectral model in the Band function:
------------------------------------------------------------
Parameters  : value       lower 90%   higher 90%
alpha       : 0.125366   ( -0.236355   0.235409 )
beta        : -5.16722    ( -0.502269   0.28662 )
Epeak [keV] : 33.5365      ( -1.13906 0.985975 )
Norm@50keV   : 49.4527    ( -11.5769   16.6583 )
------------------------------------------------------------
#Fit statistic : Chi-Squared =          48.62 using 59 PHA bins.
# Reduced chi-squared =         0.8839 for     55 degrees of freedom
# Null hypothesis probability =   7.155482e-01

Photon flux (15-150 keV)    in 0.888 sec:  (    ) ph/cm2/s
Energy fluence (15-150 keV)             : 0 ( 0  0 ) ergs/cm2
Single BB

Spectral model blackbody:
------------------------------------------------------------
Parameters  : value    Lower 90%  Upper 90%
kT [keV]    : 10.2689  (  )
R^2/D10^2   : 116.507  (   )
(R is the radius in km and D10 is the distance to the source in units of 10 kpc)
------------------------------------------------------------
#Fit statistic : Chi-Squared =         407.73 using 59 PHA bins.
# Reduced chi-squared =         7.1531 for     57 degrees of freedom
# Null hypothesis probability =   1.880482e-54

Energy  Fluence     90% Error
[keV]   [erg/cm2]   [erg/cm2]
15- 25  2.241e-06   6.172e-08
25- 50  5.782e-06   1.150e-07
50-150  3.257e-06   5.861e-08
15-150  1.128e-05   1.909e-07
Thermal bremsstrahlung (OTTB)

Spectral model: thermal bremsstrahlung
------------------------------------------------------------
Parameters  : value         Lower 90%    Upper 90%
kT [keV]    : 30.4502       (      )
Norm        : 2719.14       (     )
------------------------------------------------------------
#Fit statistic : Chi-Squared =         290.10 using 59 PHA bins.
# Reduced chi-squared =         5.0895 for     57 degrees of freedom
# Null hypothesis probability =   6.009499e-33

Energy  Fluence     90% Error
[keV]   [erg/cm2]   [erg/cm2]
15- 25  4.952e-06   1.083e-07
25- 50  5.704e-06   9.946e-08
50-150  3.185e-06   5.506e-08
15-150  1.384e-05   2.264e-07
Double BB

Spectral model: bbodyrad<1> + bbodyrad<2>
------------------------------------------------------------
Parameters  : value         Lower 90%    Upper 90%
kT1 [keV]   : 7.59201        (-0.430038      0.403849)
R1^2/D10^2  : 309.243        (-43.282      57.1769)
kT2 [keV]   : 14.2373        (-0.790781      0.985929)
R2^2/D10^2  : 11.7488    (-4.52179   6.11535)
------------------------------------------------------------
#Fit statistic : Chi-Squared =          40.50 using 59 PHA bins.
# Reduced chi-squared =         0.7364 for     55 degrees of freedom
# Null hypothesis probability =   9.280602e-01

Energy  Fluence     90% Error
[keV]   [erg/cm2]   [erg/cm2]
15- 25  3.191e-06   1.696e-07
25- 50  6.065e-06   1.736e-07
50-150  3.235e-06   1.661e-07
15-150  1.249e-05   4.085e-07
Peak spectrum fit
Power-law model

Time interval is from   -0.274 sec. to    0.726 sec.

Spectral model in power-law:
------------------------------------------------------------
Parameters  : value       lower 90%   higher 90%
Photon index: 3.08950     (     )
Norm@50keV  : 1.12377    (     )
------------------------------------------------------------
#Fit statistic : Chi-Squared =        1991.86 using 59 PHA bins.
# Reduced chi-squared =        34.9448 for     57 degrees of freedom
# Null hypothesis probability =   0.000000e+00

Photon flux (15-150 keV)    in 1 sec: 330.102 (    ) ph/cm2/s
Energy fluence (15-150 keV)             : 1.40892e-05 ( 0  0 ) ergs/cm2
Cutoff power-law model

Time interval is from   -0.274 sec. to    0.726 sec.
Spectral model in the cutoff power-law:
------------------------------------------------------------
Parameters  : value       lower 90%   higher 90%
Photon index: 0.172957     ( -0.146835   0.143165 )
Epeak [keV] : 32.4472      ( -1.07318 1.01044 )
Norm@50keV  : 30.2977    ( -4.34939   5.21607 )
------------------------------------------------------------
#Fit statistic : Chi-Squared =          59.68 using 59 PHA bins.
# Reduced chi-squared =          1.066 for     56 degrees of freedom
# Null hypothesis probability =   3.433840e-01

Photon flux (15-150 keV)    in 1 sec: 254.332 ( -6.789  6.857 ) ph/cm2/s
Energy fluence (15-150 keV)             : 1.28086e-05 ( 0  0 ) ergs/cm2
Band function

Time interval is from   -0.274 sec. to    0.726 sec.

Spectral model in the Band function:
------------------------------------------------------------
Parameters  : value       lower 90%   higher 90%
alpha       : 7.18520E-02   ( -0.225159   0.261152 )
beta        : -5.20230    ( -0.467052   0.292834 )
Epeak [keV] : 33.3183      ( -1.0883 1.01934 )
Norm@50keV   : 41.2177    ( -10.1454   15.5215 )
------------------------------------------------------------
#Fit statistic : Chi-Squared =          47.15 using 59 PHA bins.
# Reduced chi-squared =         0.8572 for     55 degrees of freedom
# Null hypothesis probability =   7.653048e-01

Photon flux (15-150 keV)    in 1 sec:  (    ) ph/cm2/s
Energy fluence (15-150 keV)             : 1.27123e-05 ( 0  0 ) ergs/cm2
Single BB
Spectral model blackbody:
------------------------------------------------------------
Parameters  : value    Lower 90%  Upper 90%
kT [keV]    : 10.2637  (  )
R^2/D10^2   : 103.704  (   )
(R is the radius in km and D10 is the distance to the source in units of 10 kpc)
------------------------------------------------------------
#Fit statistic : Chi-Squared =         405.10 using 59 PHA bins.
# Reduced chi-squared =         7.1071 for     57 degrees of freedom
# Null hypothesis probability =   5.849247e-54

Energy  Fluence     90% Error
[keV]   [erg/cm2]   [erg/cm2]
15- 25  2.244e-06   6.300e-08
25- 50  5.785e-06   1.100e-07
50-150  3.254e-06   6.100e-08
15-150  1.128e-05   1.850e-07
Thermal bremsstrahlung (OTTB)

Spectral model: thermal bremsstrahlung
------------------------------------------------------------
Parameters  : value         Lower 90%    Upper 90%
kT [keV]    : 30.4966       (      )
Norm        : 2409.96       (     )
------------------------------------------------------------
#Fit statistic : Chi-Squared =         286.49 using 59 PHA bins.
# Reduced chi-squared =         5.0261 for     57 degrees of freedom
# Null hypothesis probability =   2.601527e-32

Energy  Fluence     90% Error
[keV]   [erg/cm2]   [erg/cm2]
15- 25  4.946e-06   1.190e-07
25- 50  5.703e-06   9.900e-08
50-150  3.191e-06   5.600e-08
15-150  1.384e-05   2.200e-07
Double BB
Spectral model: bbodyrad<1> + bbodyrad<2>
------------------------------------------------------------
Parameters  : value         Lower 90%    Upper 90%
kT1 [keV]   : 7.59992        (-0.431418      0.404823)
R1^2/D10^2  : 274.149        (-38.385      50.7176)
kT2 [keV]   : 14.2695        (-0.803923      1.00549)
R2^2/D10^2  : 10.2833    (-4.00043   5.43628)
------------------------------------------------------------
#Fit statistic : Chi-Squared =          39.57 using 59 PHA bins.
# Reduced chi-squared =         0.7195 for     55 degrees of freedom
# Null hypothesis probability =   9.419201e-01

Energy  Fluence     90% Error
[keV]   [erg/cm2]   [erg/cm2]
15- 25  3.190e-06   1.435e-07
25- 50  6.065e-06   1.660e-07
50-150  3.236e-06   1.845e-07
15-150  1.249e-05   3.950e-07
Pre-slew spectrum (Pre-slew PHA with pre-slew DRM)
Power-law model
Spectral model in power-law:
------------------------------------------------------------
Parameters  : value       lower 90%   higher 90%
Photon index: 3.09617     (     )
Norm@50keV  : 1.26054    (     )
------------------------------------------------------------
#Fit statistic : Chi-Squared =        2024.57 using 59 PHA bins.
# Reduced chi-squared =        35.5187 for     57 degrees of freedom
# Null hypothesis probability =   0.000000e+00

Photon flux (15-150 keV)    in 0.888 sec: 372.120 (    ) ph/cm2/s
Energy fluence (15-150 keV)             : 1.408e-05 ( 0  0 ) ergs/cm2
Cutoff power-law model

Spectral model in the cutoff power-law:
------------------------------------------------------------
Parameters  : value       lower 90%   higher 90%
Photon index: 0.171094     ( -0.146257   0.142603 )
Epeak [keV] : 32.4553      ( -1.07011 1.00802 )
Norm@50keV  : 34.1964    ( -4.88587   5.85479 )
------------------------------------------------------------
#Fit statistic : Chi-Squared =          60.44 using 59 PHA bins.
# Reduced chi-squared =          1.079 for     56 degrees of freedom
# Null hypothesis probability =   3.185512e-01

Photon flux (15-150 keV)    in 0.888 sec: 286.364 ( -7.64  7.715 ) ph/cm2/s
Energy fluence (15-150 keV)             : 1.2807e-05 ( 0  0 ) ergs/cm2
Band function

Spectral model in the Band function:
------------------------------------------------------------
Parameters  : value       lower 90%   higher 90%
alpha       : 0.125366   ( -0.236355   0.235409 )
beta        : -5.16722    ( -0.502269   0.28662 )
Epeak [keV] : 33.5365      ( -1.13906 0.985975 )
Norm@50keV   : 49.4527    ( -11.5769   16.6583 )
------------------------------------------------------------
#Fit statistic : Chi-Squared =          48.62 using 59 PHA bins.
# Reduced chi-squared =         0.8839 for     55 degrees of freedom
# Null hypothesis probability =   7.155482e-01

Photon flux (15-150 keV)    in 0.888 sec:  (    ) ph/cm2/s
Energy fluence (15-150 keV)             : 0 ( 0  0 ) ergs/cm2
S(25-50 keV) vs. S(50-100 keV) plot

S(25-50 keV)  = 4.65e-06
S(50-100 keV) = 2.18e-06
T90 vs. Hardness ratio plot

T90                                   = 0.679999947547913 sec.
Hardness ratio (energy fluence ratio) = 0.468817
Color vs. Color plot

Count Ratio  (25-50 keV) / (15-25 keV) = 1.26792
Count Ratio (50-100 keV) / (15-25 keV) = 0.349878
Mask shadow pattern

IMX = 4.390105012517670E-01, IMY = -1.869986706501898E-01
TIME vs. PHA plot around the trigger time

TIME vs. DetID plot around the trigger time

100 us light curve (15-350 keV)

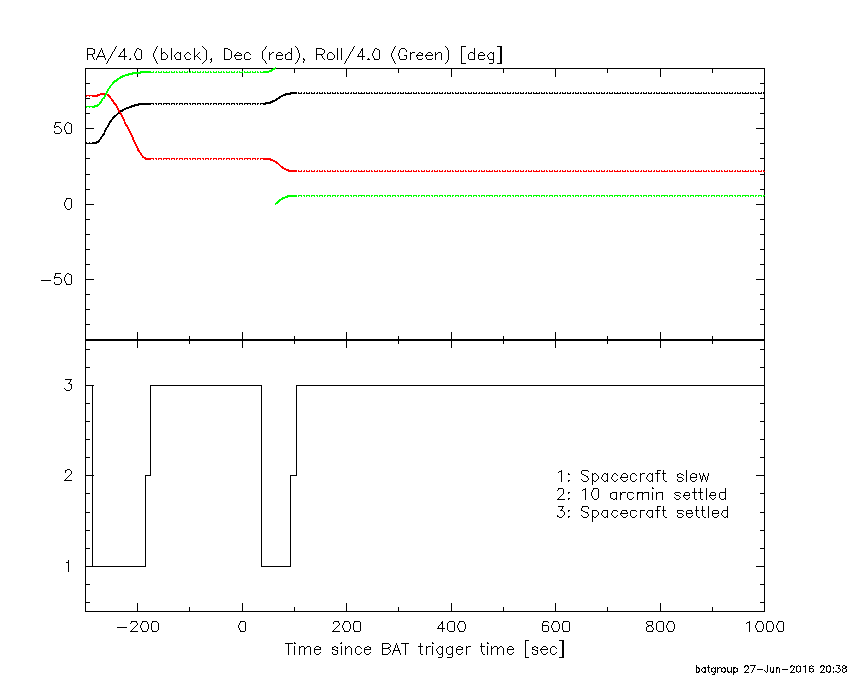
Spacecraft aspect plot
Bright source in the pre-burst/pre-slew/post-slew images
Pre-burst image of 15-350 keV band
Time interval of the image:
-185.159400 -143.100000
-142.360000 -0.220000

# RAcent  DECcent POSerr Theta    Phi  PeakCts   SNR AngSep     Name
#  [deg]    [deg]    ['] [deg]  [deg]                   [']
254.3402  35.4675   14.0  11.7 -139.7   0.1324   0.8    9.4	Her X-1
268.2534  -1.4923  429.5  31.7   97.7  -0.0090  -0.0    7.3	SW J1753.5-0127
288.6913  10.9931    3.4  28.0   49.2   0.7832   3.4    6.9	GRS 1915+105
299.5960  35.1869    0.4  27.9   -8.5   5.6638  31.7    0.9	Cyg X-1
308.1101  40.9357    1.6  34.9  -18.9   1.5128   7.4    1.0	Cyg X-3
326.1572  38.4416    7.2  48.9  -16.1   0.5866   1.6    7.2	Cyg X-2
256.9186  -4.5216    2.9  36.0  117.4   1.5224   4.0 ------	UNKNOWN
321.4011  20.0890    3.1  50.0    8.7   1.6274   3.7 ------	UNKNOWN
305.9743  58.6857    2.7  38.9  -48.1   1.2661   4.3 ------	UNKNOWN
330.8671  52.8576    3.0  51.0  -35.2   2.2523   3.8 ------	UNKNOWN
Pre-slew background subtracted image of 15-350 keV band
Time interval of the image:
-0.220000 0.668000

# RAcent  DECcent POSerr Theta    Phi  PeakCts   SNR AngSep     Name
#  [deg]    [deg]    ['] [deg]  [deg]                   [']
254.6817  35.2450    6.5  11.4 -140.1  -0.4174  -1.8   12.4	Her X-1
268.5016  -1.4964   18.9  31.8   97.2  -0.2759  -0.6    8.4	SW J1753.5-0127
288.8898  10.8482    3.5  28.2   49.1   1.0367   3.3    7.9	GRS 1915+105
299.4840  35.2198    6.1  27.8   -8.6  -0.5046  -1.9    5.3	Cyg X-1
308.0609  40.9849    5.7  34.9  -19.0   0.5390   2.0    3.0	Cyg X-3
326.0125  38.4080    8.2  48.8  -16.0  -0.6833  -1.4    9.1	Cyg X-2
293.7302  21.8871    0.1  25.5   23.1  29.5138 109.5 ------	UNKNOWN
328.2562  18.5651    1.9  56.5    7.2   7.1944   5.9 ------	UNKNOWN
259.5994  48.0454    2.9  18.7  -94.8   1.0479   3.9 ------	UNKNOWN
Post-slew image of 15-350 keV band
Time interval of the image:
92.440600 621.340000
622.640000 962.734200

# RAcent  DECcent POSerr Theta    Phi  PeakCts   SNR AngSep     Name
#  [deg]    [deg]    ['] [deg]  [deg]                   [']
254.3023  35.4639    4.1  36.9 -171.5   1.9038   2.8   10.5	Her X-1
268.2458  -1.4171   71.5  34.1  118.2  -0.2072  -0.2    7.6	SW J1753.5-0127
274.1304 -14.0345    5.9  40.7   98.0   4.6416   1.9    7.3	GX 17+2
288.8117  10.9585    1.2  11.9   92.2   5.1600   9.5    1.1	GRS 1915+105
299.5839  35.1929    0.3  14.3  -92.2  25.0645  40.7    0.6	Cyg X-1
308.0736  40.9430    1.3  22.6  -82.8   6.0019   8.9    1.8	Cyg X-3
326.0583  38.2103    5.5  32.1  -59.8   1.9980   2.1    8.6	Cyg X-2
275.6229 -14.6875    2.5  40.7   95.6  10.3657   4.6 ------	UNKNOWN
240.8115  10.4330    2.9  51.9  154.2  11.6387   4.0 ------	UNKNOWN
318.8479  -3.2351    2.2  35.1   20.7   3.8220   5.3 ------	UNKNOWN
333.1417  -6.5105    3.3  47.9    9.9   3.9150   3.4 ------	UNKNOWN
Plot creation:
Mon Jun 27 20:40:01 EDT 2016