Estimated redshift from machine learning (Ukwatta et al. 2016) - may take a few minute to calcaulte
Image
Pre-slew 15.0-350.0 keV image (Event data)
#   RAcent    DECcent   POSerr    Theta     Phi              Peak Cts       SNR   Name
  287.4137    36.9121   0.0047    22.0448   153.9929         5.2410007     41.020 TRIG_00702699

Foreground time interval of the image:
-26.428  12.069 (delta_t =  38.497 [sec])
Background time interval of the image:
-48.331 -26.428 (delta_t =  21.903 [sec])
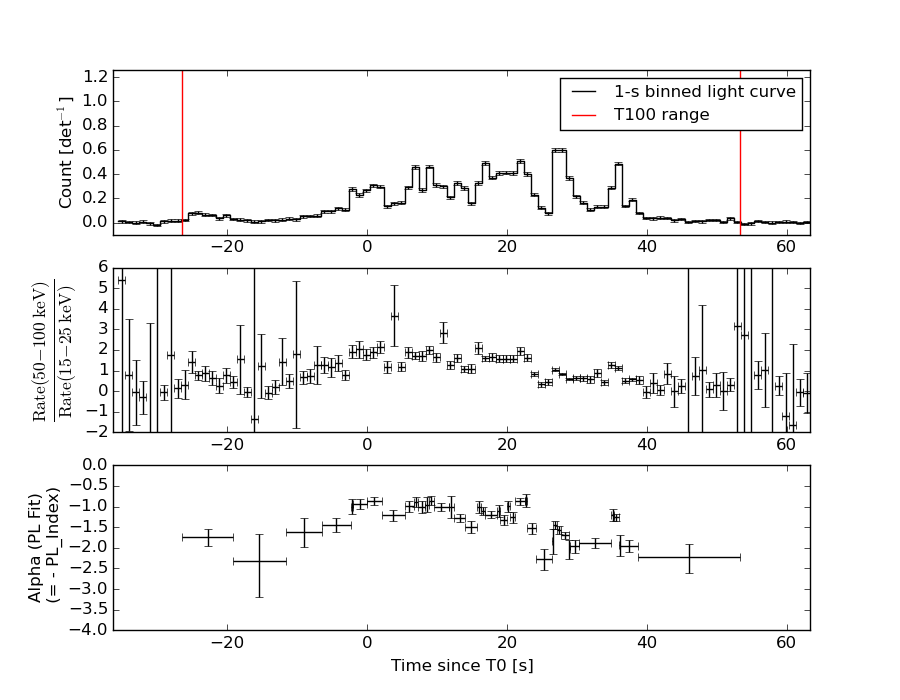
Lightcurves
Notes:
- 1) The mask-weighted light curves are using the flight position.
- 2) Multiple plots of different time binning/intervals are shown to cover all scenarios of short/long GRBs, rate/image triggers, and real/false positives.
- 3) For all the mask-weighted lightcurves, the y-axis units are counts/sec/det where a det is 0.4 x 0.4 = 0.16 sq cm.
- 4) The verticle lines correspond to following: green dotted lines are T50 interval, black dotted lines are T90 interval, blue solid line(s) is a spacecraft slew start time, and orange solid line(s) is a spacecraft slew end time.
- 5) Time of each bin is in the middle of the bin.
1 s binning
From T0-310 s to T0+310 s

From T100_start - 20 s to T100_end + 30 s

Full time interval

64 ms binning
Full time interval
From T100_start to T100_end
From T0-5 sec to T0+5 sec
16 ms binning
From T100_start-5 s to T100_start+5 s

Blue+Cyan dotted lines: Time interval of the scaled map
From 0.000000 to 1.024000
8 ms binning
From T100_start-3 s to T100_start+3 s
Blue+Cyan dotted lines: Time interval of the scaled map
From 0.000000 to 1.024000
2 ms binning
From T100_start-1 s to T100_start+1 s
Blue+Cyan dotted lines: Time interval of the scaled map
From 0.000000 to 1.024000
SN=5 or 10 sec. binning (whichever binning is satisfied first)

SN=5 or 10 sec. binning (T < 200 sec)

Quad-rate summed light curves (from T0-300s to T0+1000s)

Spectral Evolution
Spectra
Notes:
- 1) The fitting includes the systematic errors.
- 2) When the burst includes telescope slew time periods, the fitting uses an average response file made from multiple 5-s response files through out the slew time plus single time preiod for the non-slew times, and weighted by the total counts in the corresponding time period using addrmf. An average response file is needed becuase a spectral fit using the pre-slew DRM will introduce some errors in both a spectral shape and a normalization if the PHA file contains a lot of the slew/post-slew time interval.
- 3) For fits to more complicated models (e.g. a power-law over a cutoff power-law), the BAT team has decided to require a chi-square improvement of more than 6 for each extra dof.
Time averaged spectrum fit using the average DRM
Power-law model

Time interval is from  -26.428 sec. to   53.304 sec.

Spectral model in power-law:
------------------------------------------------------------
Parameters  : value       lower 90%   higher 90%
Photon index: 1.32776     ( -0.0354689   0.0353028 )
Norm@50keV  : 1.14638E-02    ( -0.000208246   0.000207911 )
------------------------------------------------------------
#Fit statistic : Chi-Squared =          39.36 using 59 PHA bins.
# Reduced chi-squared =         0.6905 for     57 degrees of freedom
# Null hypothesis probability =   9.639220e-01

Photon flux (15-150 keV)    in 79.73 sec: 1.37492 ( -0.02863  0.02879 ) ph/cm2/s
Energy fluence (15-150 keV)             : 8.97353e-06 ( -1.62601e-07  1.62588e-07 ) ergs/cm2
Cutoff power-law model

Time interval is from  -26.428 sec. to   53.304 sec.
Spectral model in the cutoff power-law:
------------------------------------------------------------
Parameters  : value       lower 90%   higher 90%
Photon index: 1.32494     ( -0.0369414   0.0345604 )
Epeak [keV] : 9999.36      ( -9999.36 -9999.36 )
Norm@50keV  : 1.14949E-02    ( -0.000207077   0.000901745 )
------------------------------------------------------------
#Fit statistic : Chi-Squared =          39.47 using 59 PHA bins.
# Reduced chi-squared =         0.7048 for     56 degrees of freedom
# Null hypothesis probability =   9.539607e-01

Photon flux (15-150 keV)    in 79.73 sec: 1.38370 (    ) ph/cm2/s
Energy fluence (15-150 keV)             : 8.97146e-06 ( -1.62557e-07  1.58562e-07 ) ergs/cm2
Band function
Time interval is from  -26.428 sec. to   53.304 sec.

Spectral model in the Band function:
------------------------------------------------------------
Parameters  : value       lower 90%   higher 90%
alpha       : 4.57411   ( -4.57411   -4.57411 )
beta        : -1.33190    ( -0.0358779   0.0357732 )
Epeak [keV] : 21.0747      ( -21.0747 4.20622 )
Norm@50keV   : 1305.17    ( -23.05   3.09136e+06 )
------------------------------------------------------------
#Fit statistic : Chi-Squared =          39.08 using 59 PHA bins.
# Reduced chi-squared =         0.7105 for     55 degrees of freedom
# Null hypothesis probability =   9.484891e-01

Photon flux (15-150 keV)    in 79.73 sec: 1.37444 ( -0.02863  0.01644 ) ph/cm2/s
Energy fluence (15-150 keV)             : 1.26488e-14 ( 0  0 ) ergs/cm2
Single BB

Spectral model blackbody:
------------------------------------------------------------
Parameters  : value    Lower 90%  Upper 90%
kT [keV]    : 20.3656  (  )
R^2/D10^2   : 5.48888E-02  (   )
(R is the radius in km and D10 is the distance to the source in units of 10 kpc)
------------------------------------------------------------
#Fit statistic : Chi-Squared =         698.86 using 59 PHA bins.
# Reduced chi-squared =         12.261 for     57 degrees of freedom
# Null hypothesis probability =  2.912042e-111

Energy  Fluence     90% Error
[keV]   [erg/cm2]   [erg/cm2]
15- 25  3.474e-07   1.304e-08
25- 50  1.751e-06   5.262e-08
50-150  5.396e-06   1.551e-07
15-150  7.494e-06   1.539e-07
Thermal bremsstrahlung (OTTB)
Spectral model: thermal bremsstrahlung
------------------------------------------------------------
Parameters  : value         Lower 90%    Upper 90%
kT [keV]    : 199.363       (      )
Norm        : 5.89434       (     )
------------------------------------------------------------
#Fit statistic : Chi-Squared =         224.72 using 59 PHA bins.
# Reduced chi-squared =         3.9425 for     57 degrees of freedom
# Null hypothesis probability =   9.029191e-22

Energy  Fluence     90% Error
[keV]   [erg/cm2]   [erg/cm2]
15- 25  1.170e-06   2.511e-08
25- 50  2.251e-06   4.465e-08
50-150  4.937e-06   9.767e-08
15-150  8.358e-06   1.754e-07
Double BB

Spectral model: bbodyrad<1> + bbodyrad<2>
------------------------------------------------------------
Parameters  : value         Lower 90%    Upper 90%
kT1 [keV]   : 7.99940        (-0.586504      0.624139)
R1^2/D10^2  : 0.821165        (-0.185587      0.254693)
kT2 [keV]   : 33.6628        (-2.2819      2.80867)
R2^2/D10^2  : 8.84205E-03    (-0.00203441   0.00234289)
------------------------------------------------------------
#Fit statistic : Chi-Squared =          53.20 using 59 PHA bins.
# Reduced chi-squared =         0.9673 for     55 degrees of freedom
# Null hypothesis probability =   5.436361e-01

Energy  Fluence     90% Error
[keV]   [erg/cm2]   [erg/cm2]
15- 25  8.737e-07   6.167e-08
25- 50  2.074e-06   8.412e-08
50-150  6.027e-06   2.113e-07
15-150  8.975e-06   2.631e-07
Peak spectrum fit
Power-law model

Time interval is from   26.644 sec. to   27.644 sec.

Spectral model in power-law:
------------------------------------------------------------
Parameters  : value       lower 90%   higher 90%
Photon index: 1.49451     ( -0.0751313   0.0755105 )
Norm@50keV  : 4.56444E-02    ( -0.00193   0.00192615 )
------------------------------------------------------------
#Fit statistic : Chi-Squared =          69.70 using 59 PHA bins.
# Reduced chi-squared =          1.223 for     57 degrees of freedom
# Null hypothesis probability =   1.204613e-01

Photon flux (15-150 keV)    in 1 sec: 5.68998 ( -0.2479  0.24829 ) ph/cm2/s
Energy fluence (15-150 keV)             : 4.33451e-07 ( -1.98896e-08  1.99683e-08 ) ergs/cm2
Cutoff power-law model

Time interval is from   26.644 sec. to   27.644 sec.
Spectral model in the cutoff power-law:
------------------------------------------------------------
Parameters  : value       lower 90%   higher 90%
Photon index: 1.28628     ( -0.289415   0.240841 )
Epeak [keV] : 181.401      ( -76.0966 -181.401 )
Norm@50keV  : 5.74844E-02    ( -0.0128968   0.0209526 )
------------------------------------------------------------
#Fit statistic : Chi-Squared =          68.01 using 59 PHA bins.
# Reduced chi-squared =          1.214 for     56 degrees of freedom
# Null hypothesis probability =   1.304588e-01

Photon flux (15-150 keV)    in 1 sec: 5.62625 ( -0.26064  0.26101 ) ph/cm2/s
Energy fluence (15-150 keV)             : 4.27829e-07 ( -2.13389e-08  2.12782e-08 ) ergs/cm2
Band function

Time interval is from   26.644 sec. to   27.644 sec.

Spectral model in the Band function:
------------------------------------------------------------
Parameters  : value       lower 90%   higher 90%
alpha       : -0.594164   ( 0.9202   0.9202 )
beta        : -1.55999    ( 1.55962   0.111833 )
Epeak [keV] : 51.3718      ( -51.1847 384.769 )
Norm@50keV   : 0.171110    ( -0.174655   2921.87 )
------------------------------------------------------------
#Fit statistic : Chi-Squared =          67.69 using 59 PHA bins.
# Reduced chi-squared =          1.231 for     55 degrees of freedom
# Null hypothesis probability =   1.169930e-01

Photon flux (15-150 keV)    in 1 sec: 4.81371 (    ) ph/cm2/s
Energy fluence (15-150 keV)             : 4.33401e-07 ( -1.80455e-08  1.99557e-08 ) ergs/cm2
Single BB
Spectral model blackbody:
------------------------------------------------------------
Parameters  : value    Lower 90%  Upper 90%
kT [keV]    : 15.9893  (  )
R^2/D10^2   : 0.507255  (   )
(R is the radius in km and D10 is the distance to the source in units of 10 kpc)
------------------------------------------------------------
#Fit statistic : Chi-Squared =         211.61 using 59 PHA bins.
# Reduced chi-squared =         3.7125 for     57 degrees of freedom
# Null hypothesis probability =   1.240500e-19

Energy  Fluence     90% Error
[keV]   [erg/cm2]   [erg/cm2]
15- 25  2.682e-08   2.075e-09
25- 50  1.128e-07   6.450e-09
50-150  2.015e-07   1.725e-08
15-150  3.411e-07   1.750e-08
Thermal bremsstrahlung (OTTB)
Spectral model: thermal bremsstrahlung
------------------------------------------------------------
Parameters  : value         Lower 90%    Upper 90%
kT [keV]    : 200.000       (-19.051      -200)
Norm        : 23.3253       (-0.971393     0.971393)
------------------------------------------------------------
#Fit statistic : Chi-Squared =          71.28 using 59 PHA bins.
# Reduced chi-squared =          1.251 for     57 degrees of freedom
# Null hypothesis probability =   9.662722e-02

Energy  Fluence     90% Error
[keV]   [erg/cm2]   [erg/cm2]
15- 25  5.809e-08   2.660e-09
25- 50  1.117e-07   5.550e-09
50-150  2.450e-07   1.240e-08
15-150  4.149e-07   1.930e-08
Double BB
Spectral model: bbodyrad<1> + bbodyrad<2>
------------------------------------------------------------
Parameters  : value         Lower 90%    Upper 90%
kT1 [keV]   : 7.13286        (-0.861267      0.934995)
R1^2/D10^2  : 5.50466        (-1.88667      3.19169)
kT2 [keV]   : 28.1192        (-3.22965      4.38614)
R2^2/D10^2  : 5.80699E-02    (-0.0229918   0.0319627)
------------------------------------------------------------
#Fit statistic : Chi-Squared =          61.99 using 59 PHA bins.
# Reduced chi-squared =          1.127 for     55 degrees of freedom
# Null hypothesis probability =   2.410284e-01

Energy  Fluence     90% Error
[keV]   [erg/cm2]   [erg/cm2]
15- 25  5.333e-08   7.025e-09
25- 50  1.099e-07   1.361e-08
50-150  2.675e-07   3.765e-08
15-150  4.308e-07   4.445e-08
Pre-slew spectrum (Pre-slew PHA with pre-slew DRM)
Power-law model

Spectral model in power-law:
------------------------------------------------------------
Parameters  : value       lower 90%   higher 90%
Photon index: 1.12255     ( -0.0524844   0.0521993 )
Norm@50keV  : 9.24586E-03    ( -0.000251933   0.000250997 )
------------------------------------------------------------
#Fit statistic : Chi-Squared =          47.94 using 59 PHA bins.
# Reduced chi-squared =         0.8411 for     57 degrees of freedom
# Null hypothesis probability =   7.980616e-01

Photon flux (15-150 keV)    in 38.5 sec: 1.07492 ( -0.0311578  0.0313264 ) ph/cm2/s
Energy fluence (15-150 keV)             : 3.69536e-06 ( -1.03586e-07  1.0384e-07 ) ergs/cm2
Cutoff power-law model

Spectral model in the cutoff power-law:
------------------------------------------------------------
Parameters  : value       lower 90%   higher 90%
Photon index: 1.11815     ( -0.0537187   0.05177 )
Epeak [keV] : 9999.35      ( -9999.36 -9999.36 )
Norm@50keV  : 9.29441E-03    ( -0.000249465   0.000805168 )
------------------------------------------------------------
#Fit statistic : Chi-Squared =          48.08 using 59 PHA bins.
# Reduced chi-squared =         0.8586 for     56 degrees of freedom
# Null hypothesis probability =   7.652041e-01

Photon flux (15-150 keV)    in 38.5 sec: 1.07449 ( -0.03115  0.03113 ) ph/cm2/s
Energy fluence (15-150 keV)             : 3.69361e-06 ( -1.0149e-07  1.02552e-07 ) ergs/cm2
Band function
Spectral model in the Band function:
------------------------------------------------------------
Parameters  : value       lower 90%   higher 90%
alpha       : -0.897359   ( 0.897359   0.897359 )
beta        : -1.12256    ( -0.0521878   0.0524975 )
Epeak [keV] : 53.5201      ( -53.5201 -53.5201 )
Norm@50keV   : 1.63100E-02    ( -0.00560119   0 )
------------------------------------------------------------
#Fit statistic : Chi-Squared =          47.94 using 59 PHA bins.
# Reduced chi-squared =         0.8717 for     55 degrees of freedom
# Null hypothesis probability =   7.388718e-01

Photon flux (15-150 keV)    in 38.5 sec: 1.07492 ( -0.03116  0.03133 ) ph/cm2/s
Energy fluence (15-150 keV)             : 3.69573e-06 ( -1.03615e-07  1.03803e-07 ) ergs/cm2
S(25-50 keV) vs. S(50-100 keV) plot
S(25-50 keV)  = 2.03e-06
S(50-100 keV) = 3.23e-06
T90 vs. Hardness ratio plot
T90                                   = 45.0079999566078 sec.
Hardness ratio (energy fluence ratio) = 1.59113
Color vs. Color plot
Count Ratio  (25-50 keV) / (15-25 keV) = 1.40218
Count Ratio (50-100 keV) / (15-25 keV) = 1.20294
Mask shadow pattern

IMX = -3.639326488189760E-01, IMY = -1.775578893147506E-01
TIME vs. PHA plot around the trigger time
Blue+Cyan dotted lines: Time interval of the scaled map
From 0.000000 to 1.024000
TIME vs. DetID plot around the trigger time

Blue+Cyan dotted lines: Time interval of the scaled map
From 0.000000 to 1.024000
100 us light curve (15-350 keV)

Blue+Cyan dotted lines: Time interval of the scaled map
From 0.000000 to 1.024000
Spacecraft aspect plot

Bright source in the pre-burst/pre-slew/post-slew images
Pre-burst image of 15-350 keV band
Time interval of the image:
-48.331400 -26.428000

# RAcent  DECcent POSerr Theta    Phi  PeakCts   SNR AngSep     Name
#  [deg]    [deg]    ['] [deg]  [deg]                   [']
254.4080  35.2273    3.9  47.0  171.2  -0.3722  -3.0    7.3	Her X-1
288.8517  11.0825   16.0  38.7  112.9  -0.1230  -0.7    8.8	GRS 1915+105
299.6024  35.1909    0.7  14.1  133.9   0.8220  16.3    0.9	Cyg X-1
307.9781  40.9131    9.6   5.6  147.8  -0.0582  -1.2    6.4	Cyg X-3
326.2246  38.4156    9.1   9.1   -0.6   0.0590   1.3    6.2	Cyg X-2
299.6995   5.7276    2.2  39.0   93.7   1.0592   5.4 ------	UNKNOWN
241.0571  43.1961    2.9  52.7 -173.4   0.6047   4.0 ------	UNKNOWN
 15.7269  16.0128    2.8  57.5  -13.7   0.8961   4.1 ------	UNKNOWN
Pre-slew background subtracted image of 15-350 keV band
Time interval of the image:
-26.428000 12.068600

# RAcent  DECcent POSerr Theta    Phi  PeakCts   SNR AngSep     Name
#  [deg]    [deg]    ['] [deg]  [deg]                   [']
254.3997  35.2308    6.8  47.0  171.2   0.4649   1.7    7.3	Her X-1
288.8048  10.9125    5.3  38.9  112.8   0.8894   2.1    2.0	GRS 1915+105
299.5449  35.2191    4.3  14.1  134.1   0.3332   2.7    2.5	Cyg X-1
308.0204  40.9622    4.9   5.6  148.2   0.2758   2.4    4.1	Cyg X-3
325.9257  38.2801   20.6   9.0    0.8  -0.0649  -0.6   11.8	Cyg X-2
287.4137  36.9121    0.3  22.0  154.0   5.2404  41.0 ------	UNKNOWN
344.1131  65.2511    2.3  28.1  -86.2   0.8948   5.1 ------	UNKNOWN
 23.6144  47.9684    2.8  47.0  -53.2   2.0924   4.1 ------	UNKNOWN
 20.1172  61.5058    2.3  42.2  -71.5   2.4530   5.0 ------	UNKNOWN
 16.4450  69.3716    2.3  41.0  -83.4   2.3784   5.0 ------	UNKNOWN
Post-slew image of 15-350 keV band
Time interval of the image:
55.268600 962.542300

# RAcent  DECcent POSerr Theta    Phi  PeakCts   SNR AngSep     Name
#  [deg]    [deg]    ['] [deg]  [deg]                   [']
254.2849  35.4423   11.4  26.6 -177.6   0.7131   1.0   10.4	Her X-1
288.8141  10.9231    4.3  26.0   82.4   2.3041   2.7    1.6	GRS 1915+105
299.5903  35.2038    0.2  10.0    1.7  39.2631  63.1    0.1	Cyg X-1
308.1133  40.9565    2.1  16.6  -25.0   3.4296   5.6    0.3	Cyg X-3
326.0353  38.4393    7.5  30.4  -19.3   1.0941   1.5    9.5	Cyg X-2
284.7226   4.9123    2.7  32.1   90.6   4.8500   4.3 ------	UNKNOWN
244.3751  10.8598    3.3  46.6  152.8   6.7163   3.5 ------	UNKNOWN
315.4684  15.3960    2.7  32.9   28.9   3.6252   4.3 ------	UNKNOWN
291.3022  65.1209    3.2  28.3  -91.0   3.2320   3.6 ------	UNKNOWN
253.6314  75.9506    2.7  41.9 -106.1  14.0132   4.4 ------	UNKNOWN
Plot creation:
Fri Jul 22 14:21:09 EDT 2016