Estimated redshift from machine learning (Ukwatta et al. 2016) - may take a few minute to calcaulte
Image
Pre-slew 15.0-350.0 keV image (Event data)
#   RAcent    DECcent   POSerr    Theta     Phi              Peak Cts       SNR   Name
  190.5024   -61.3645   0.0174    19.1094    69.1526         0.3857947     11.023 TRIG_00704572

Foreground time interval of the image:
 -0.432   6.728 (delta_t =   7.160 [sec])
Background time interval of the image:
-239.592  -0.432 (delta_t = 239.160 [sec])
Lightcurves
Notes:
- 1) The mask-weighted light curves are using the flight position.
- 2) Multiple plots of different time binning/intervals are shown to cover all scenarios of short/long GRBs, rate/image triggers, and real/false positives.
- 3) For all the mask-weighted lightcurves, the y-axis units are counts/sec/det where a det is 0.4 x 0.4 = 0.16 sq cm.
- 4) The verticle lines correspond to following: green dotted lines are T50 interval, black dotted lines are T90 interval, blue solid line(s) is a spacecraft slew start time, and orange solid line(s) is a spacecraft slew end time.
- 5) Time of each bin is in the middle of the bin.
1 s binning
From T0-310 s to T0+310 s
From T100_start - 20 s to T100_end + 30 s

Full time interval
64 ms binning
Full time interval
From T100_start to T100_end

From T0-5 sec to T0+5 sec
16 ms binning
From T100_start-5 s to T100_start+5 s
Blue+Cyan dotted lines: Time interval of the scaled map
From 0.000000 to 2.048000
8 ms binning
From T100_start-3 s to T100_start+3 s

Blue+Cyan dotted lines: Time interval of the scaled map
From 0.000000 to 2.048000
2 ms binning
From T100_start-1 s to T100_start+1 s
Blue+Cyan dotted lines: Time interval of the scaled map
From 0.000000 to 2.048000
SN=5 or 10 sec. binning (whichever binning is satisfied first)

SN=5 or 10 sec. binning (T < 200 sec)
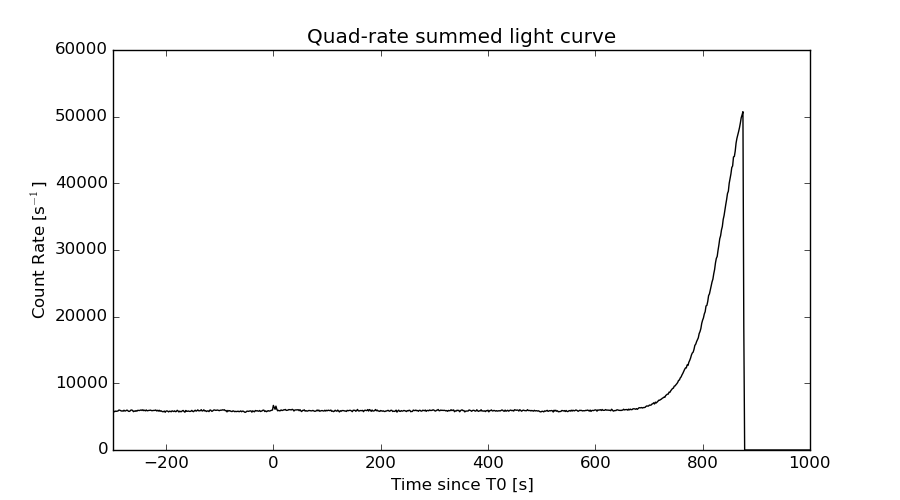
Quad-rate summed light curves (from T0-300s to T0+1000s)
Spectral Evolution

Spectra
Notes:
- 1) The fitting includes the systematic errors.
- 2) When the burst includes telescope slew time periods, the fitting uses an average response file made from multiple 5-s response files through out the slew time plus single time preiod for the non-slew times, and weighted by the total counts in the corresponding time period using addrmf. An average response file is needed becuase a spectral fit using the pre-slew DRM will introduce some errors in both a spectral shape and a normalization if the PHA file contains a lot of the slew/post-slew time interval.
- 3) For fits to more complicated models (e.g. a power-law over a cutoff power-law), the BAT team has decided to require a chi-square improvement of more than 6 for each extra dof.
Time averaged spectrum fit using the average DRM
Power-law model
Time interval is from   -0.432 sec. to    6.728 sec.

Spectral model in power-law:
------------------------------------------------------------
Parameters  : value       lower 90%   higher 90%
Photon index: 2.29500     ( -0.286641   0.321061 )
Norm@50keV  : 2.65942E-03    ( -0.000582896   0.000564534 )
------------------------------------------------------------
#Fit statistic : Chi-Squared =          55.19 using 59 PHA bins.
# Reduced chi-squared =         0.9683 for     57 degrees of freedom
# Null hypothesis probability =   5.430970e-01

Photon flux (15-150 keV)    in 7.16 sec: 0.463524 ( -0.062965  0.062955 ) ph/cm2/s
Energy fluence (15-150 keV)             : 1.81833e-07 ( -3.14487e-08  3.27634e-08 ) ergs/cm2
Cutoff power-law model
Time interval is from   -0.432 sec. to    6.728 sec.
Spectral model in the cutoff power-law:
------------------------------------------------------------
Parameters  : value       lower 90%   higher 90%
Photon index: 2.37759     ( -1.48173   0.382137 )
Epeak [keV] : 184.185      (   )
Norm@50keV  : 2.37028E-03    (     )
------------------------------------------------------------
#Fit statistic : Chi-Squared =          55.18 using 59 PHA bins.
# Reduced chi-squared =         0.9854 for     56 degrees of freedom
# Null hypothesis probability =   5.058794e-01

Photon flux (15-150 keV)    in 7.16 sec: 0.463903 (    ) ph/cm2/s
Energy fluence (15-150 keV)             : 0 ( 0  0 ) ergs/cm2
Band function
Time interval is from   -0.432 sec. to    6.728 sec.

Spectral model in the Band function:
------------------------------------------------------------
Parameters  : value       lower 90%   higher 90%
alpha       : -9.91202   ( 9.91202   9.91202 )
beta        : -2.29500    ( -0.321059   0.287031 )
Epeak [keV] : 6.92912      ( -6.92912 -6.92912 )
Norm@50keV   : 0.361452    ( -0.0792232   0.0767285 )
------------------------------------------------------------
#Fit statistic : Chi-Squared =          55.19 using 59 PHA bins.
# Reduced chi-squared =          1.004 for     55 degrees of freedom
# Null hypothesis probability =   4.672649e-01

Photon flux (15-150 keV)    in 7.16 sec: 0.463517 ( -0.062961  0.062962 ) ph/cm2/s
Energy fluence (15-150 keV)             : 3.12357e-16 ( 0  0 ) ergs/cm2
Single BB
Spectral model blackbody:
------------------------------------------------------------
Parameters  : value    Lower 90%  Upper 90%
kT [keV]    : 8.43740  (-1.39063  1.57931)
R^2/D10^2   : 0.400533  (-0.197906   0.421815)
(R is the radius in km and D10 is the distance to the source in units of 10 kpc)
------------------------------------------------------------
#Fit statistic : Chi-Squared =          68.60 using 59 PHA bins.
# Reduced chi-squared =          1.203 for     57 degrees of freedom
# Null hypothesis probability =   1.396608e-01

Energy  Fluence     90% Error
[keV]   [erg/cm2]   [erg/cm2]
15- 25  3.830e-08   9.265e-09
25- 50  7.337e-08   1.605e-08
50-150  2.288e-08   9.888e-09
15-150  1.345e-07   2.638e-08
Thermal bremsstrahlung (OTTB)
Spectral model: thermal bremsstrahlung
------------------------------------------------------------
Parameters  : value         Lower 90%    Upper 90%
kT [keV]    : 41.8996       (-13.2508      23.3907)
Norm        : 2.88377       (-0.690368     1.0104)
------------------------------------------------------------
#Fit statistic : Chi-Squared =          56.68 using 59 PHA bins.
# Reduced chi-squared =         0.9944 for     57 degrees of freedom
# Null hypothesis probability =   4.870342e-01

Energy  Fluence     90% Error
[keV]   [erg/cm2]   [erg/cm2]
15- 25  4.813e-08   7.790e-09
25- 50  6.458e-08   1.137e-08
50-150  5.253e-08   2.354e-08
15-150  1.652e-07   3.508e-08
Double BB
Spectral model: bbodyrad<1> + bbodyrad<2>
------------------------------------------------------------
Parameters  : value         Lower 90%    Upper 90%
kT1 [keV]   : 2.86127        (-1.15279      1.70828)
R1^2/D10^2  : 32.2800        (-29.138      1121.86)
kT2 [keV]   : 11.7412        (-2.5075      4.24961)
R2^2/D10^2  : 8.97919E-02    (-0.0662836   0.0483817)
------------------------------------------------------------
#Fit statistic : Chi-Squared =          54.12 using 59 PHA bins.
# Reduced chi-squared =         0.9840 for     55 degrees of freedom
# Null hypothesis probability =   5.083228e-01

Energy  Fluence     90% Error
[keV]   [erg/cm2]   [erg/cm2]
15- 25  5.071e-08   2.585e-08
25- 50  6.131e-08   3.396e-08
50-150  4.685e-08   2.955e-08
15-150  1.589e-07   8.012e-08
Peak spectrum fit
Power-law model

Time interval is from    0.948 sec. to    1.948 sec.

Spectral model in power-law:
------------------------------------------------------------
Parameters  : value       lower 90%   higher 90%
Photon index: 2.05846     ( -0.353111   0.395339 )
Norm@50keV  : 5.33889E-03    ( -0.00145209   0.00140168 )
------------------------------------------------------------
#Fit statistic : Chi-Squared =          54.97 using 59 PHA bins.
# Reduced chi-squared =         0.9643 for     57 degrees of freedom
# Null hypothesis probability =   5.517902e-01

Photon flux (15-150 keV)    in 1 sec: 0.823202 ( -0.162796  0.1628 ) ph/cm2/s
Energy fluence (15-150 keV)             : 4.94333e-08 ( -1.19817e-08  1.25422e-08 ) ergs/cm2
Cutoff power-law model

Time interval is from    0.948 sec. to    1.948 sec.
Spectral model in the cutoff power-law:
------------------------------------------------------------
Parameters  : value       lower 90%   higher 90%
Photon index: 1.19035     ( -2.43474   0.92554 )
Epeak [keV] : 34.9989      (   )
Norm@50keV  : 1.84756E-02    (     )
------------------------------------------------------------
#Fit statistic : Chi-Squared =          54.14 using 59 PHA bins.
# Reduced chi-squared =         0.9668 for     56 degrees of freedom
# Null hypothesis probability =   5.455847e-01

Photon flux (15-150 keV)    in 1 sec: 0.804142 ( -0.16493  0.16628 ) ph/cm2/s
Energy fluence (15-150 keV)             : 0 ( 0  0 ) ergs/cm2
Band function
Time interval is from    0.948 sec. to    1.948 sec.

Spectral model in the Band function:
------------------------------------------------------------
Parameters  : value       lower 90%   higher 90%
alpha       : 4.94703   ( -6.83155   -4.94703 )
beta        : -2.48621    ( -0.965043   0.538071 )
Epeak [keV] : 24.7862      ( -6.76271 4.8739 )
Norm@50keV   : 975.767    ( -188.82   7294.09 )
------------------------------------------------------------
#Fit statistic : Chi-Squared =          51.92 using 59 PHA bins.
# Reduced chi-squared =         0.9439 for     55 degrees of freedom
# Null hypothesis probability =   5.931636e-01

Photon flux (15-150 keV)    in 1 sec: 0.828065 ( -0.166243  0.157622 ) ph/cm2/s
Energy fluence (15-150 keV)             : 6.58354e-16 ( 0  0 ) ergs/cm2
Single BB
Spectral model blackbody:
------------------------------------------------------------
Parameters  : value    Lower 90%  Upper 90%
kT [keV]    : 8.36381  (-1.79254  2.43376)
R^2/D10^2   : 0.773998  (-0.488627   1.2374)
(R is the radius in km and D10 is the distance to the source in units of 10 kpc)
------------------------------------------------------------
#Fit statistic : Chi-Squared =          57.64 using 59 PHA bins.
# Reduced chi-squared =          1.011 for     57 degrees of freedom
# Null hypothesis probability =   4.515443e-01

Energy  Fluence     90% Error
[keV]   [erg/cm2]   [erg/cm2]
15- 25  1.010e-08   3.519e-09
25- 50  1.907e-08   6.843e-09
50-150  5.783e-09   3.215e-09
15-150  3.495e-08   1.267e-08
Thermal bremsstrahlung (OTTB)
Spectral model: thermal bremsstrahlung
------------------------------------------------------------
Parameters  : value         Lower 90%    Upper 90%
kT [keV]    : 54.1409       (-22.9486      57.7398)
Norm        : 4.52813       (-0.888723     2.0189)
------------------------------------------------------------
#Fit statistic : Chi-Squared =          54.13 using 59 PHA bins.
# Reduced chi-squared =         0.9497 for     57 degrees of freedom
# Null hypothesis probability =   5.833165e-01

Energy  Fluence     90% Error
[keV]   [erg/cm2]   [erg/cm2]
15- 25  1.126e-08   4.693e-09
25- 50  1.662e-08   9.067e-09
50-150  1.736e-08   1.815e-08
15-150  4.524e-08   3.182e-08
Double BB
------------------------------------------------------------
Parameters  : value         Lower 90%    Upper 90%
kT1 [keV]   : 5.80298        (-2.44751      3.08958)
R1^2/D10^2  : 2.42167        (-1.82074      12.3281)
kT2 [keV]   : 18.5745        (-15.1323      -18.5946)
R2^2/D10^2  : 2.09094E-02    (-0.0206228   0.326982)
------------------------------------------------------------
#Fit statistic : Chi-Squared =          53.17 using 59 PHA bins.
#Fit statistic : Chi-Squared =          53.03 using 59 PHA bins.
# Reduced chi-squared =         0.9668 for     55 degrees of freedom
# Reduced chi-squared =         0.9642 for     55 degrees of freedom
# Null hypothesis probability =   5.446861e-01
# Null hypothesis probability =   5.502168e-01

Energy  Fluence     90% Error
[keV]   [erg/cm2]   [erg/cm2]
15- 25  1.151e-08   7.020e-09
25- 50  1.584e-08   8.500e-09
50-150  1.545e-08   1.076e-08
15-150  4.280e-08   2.270e-08
Pre-slew spectrum (Pre-slew PHA with pre-slew DRM)
Power-law model

Spectral model in power-law:
------------------------------------------------------------
Parameters  : value       lower 90%   higher 90%
Photon index: 2.29500     ( -0.286641   0.321061 )
Norm@50keV  : 2.65942E-03    ( -0.000582896   0.000564534 )
------------------------------------------------------------
#Fit statistic : Chi-Squared =          55.19 using 59 PHA bins.
# Reduced chi-squared =         0.9683 for     57 degrees of freedom
# Null hypothesis probability =   5.430970e-01

Photon flux (15-150 keV)    in 7.16 sec: 0.463465 ( -0.0629545  0.0629549 ) ph/cm2/s
Energy fluence (15-150 keV)             : 1.81795e-07 ( -3.1433e-08  3.27634e-08 ) ergs/cm2
Cutoff power-law model
Spectral model in the cutoff power-law:
------------------------------------------------------------
Parameters  : value       lower 90%   higher 90%
Photon index: 1.96635     (     )
Epeak [keV] : 4.11603      (   )
Norm@50keV  : 4.16235E-03    (     )
------------------------------------------------------------
#Fit statistic : Chi-Squared =          55.45 using 59 PHA bins.
# Reduced chi-squared =         0.9901 for     56 degrees of freedom
# Null hypothesis probability =   4.957879e-01

Photon flux (15-150 keV)    in 7.16 sec: 0.463247 ( -0.06406  0.062957 ) ph/cm2/s
Energy fluence (15-150 keV)             : 1.81543e-07 ( -3.77096e-08  3.25895e-08 ) ergs/cm2
Band function

Spectral model in the Band function:
------------------------------------------------------------
Parameters  : value       lower 90%   higher 90%
alpha       : -9.91202   ( 9.91202   9.91202 )
beta        : -2.29500    ( -0.321059   0.287031 )
Epeak [keV] : 6.92912      ( -6.92912 -6.92912 )
Norm@50keV   : 0.361452    ( -0.0792232   0.0767285 )
------------------------------------------------------------
#Fit statistic : Chi-Squared =          55.19 using 59 PHA bins.
# Reduced chi-squared =          1.004 for     55 degrees of freedom
# Null hypothesis probability =   4.672649e-01

Photon flux (15-150 keV)    in 7.16 sec: 0.463517 ( -0.062961  0.062962 ) ph/cm2/s
Energy fluence (15-150 keV)             : 3.12357e-16 ( 0  0 ) ergs/cm2
S(25-50 keV) vs. S(50-100 keV) plot

S(25-50 keV)  = 5.86e-08
S(50-100 keV) = 4.78e-08
T90 vs. Hardness ratio plot
T90                                   = 6.39199995994568 sec.
Hardness ratio (energy fluence ratio) = 0.8157
Color vs. Color plot
Count Ratio  (25-50 keV) / (15-25 keV) = 0.818009
Count Ratio (50-100 keV) / (15-25 keV) = 0.331355
Mask shadow pattern
IMX = 1.233001940051703E-01, IMY = -3.237821380274112E-01
TIME vs. PHA plot around the trigger time
Blue+Cyan dotted lines: Time interval of the scaled map
From 0.000000 to 2.048000
TIME vs. DetID plot around the trigger time

Blue+Cyan dotted lines: Time interval of the scaled map
From 0.000000 to 2.048000
100 us light curve (15-350 keV)
Blue+Cyan dotted lines: Time interval of the scaled map
From 0.000000 to 2.048000
Spacecraft aspect plot
Bright source in the pre-burst/pre-slew/post-slew images
Pre-burst image of 15-350 keV band
Time interval of the image:
-239.592000 -0.432000

# RAcent  DECcent POSerr Theta    Phi  PeakCts   SNR AngSep     Name
#  [deg]    [deg]    ['] [deg]  [deg]                   [']
135.5530 -40.5615    0.6  20.7  -84.8   4.7719  19.2    1.2	Vela X-1
170.6166 -60.6673   14.4   9.5   65.9   0.1814   0.8    9.2	Cen X-3
186.9093 -62.6552    3.7  17.3   72.8   0.7242   3.1    9.8	GX 301-2
160.2440 -18.7106    3.3  40.0  -34.7   1.0915   3.5 ------	UNKNOWN
103.8764 -29.2457    2.5  44.0 -116.6   4.2974   4.7 ------	UNKNOWN
Pre-slew background subtracted image of 15-350 keV band
Time interval of the image:
-0.432000 6.728000

# RAcent  DECcent POSerr Theta    Phi  PeakCts   SNR AngSep     Name
#  [deg]    [deg]    ['] [deg]  [deg]                   [']
135.6408 -40.5008    2.5  20.7  -84.6   0.1652   4.6    6.1	Vela X-1
170.6748 -60.5559    9.8   9.5   65.3  -0.0359  -1.2   11.3	Cen X-3
186.6019 -62.6121    4.7  17.2   72.7  -0.0819  -2.5    9.6	GX 301-2
190.5015 -61.3648    1.0  19.1   69.2   0.3859  11.2 ------	UNKNOWN
170.3790 -30.1017    2.7  30.8  -14.8   0.1395   4.2 ------	UNKNOWN
Post-slew image of 15-350 keV band
Time interval of the image:
69.708590 772.208590

# RAcent  DECcent POSerr Theta    Phi  PeakCts   SNR AngSep     Name
#  [deg]    [deg]    ['] [deg]  [deg]                   [']
135.4973 -40.5537    0.9  38.8 -106.8  20.8662  13.1    1.4	Vela X-1
170.2406 -60.6034    3.5   9.8 -117.8   1.6842   3.3    2.5	Cen X-3
186.4200 -62.6525   21.9   2.3 -149.0   0.2936   0.5    9.6	GX 301-2
214.4625 -28.7850    2.6  36.2   13.7   2.9458   4.4 ------	UNKNOWN
 39.9454 -59.6702    2.9  56.9  174.0  15.1668   4.0 ------	UNKNOWN
187.7613  -3.9415    2.9  57.5  -26.5  13.2305   4.0 ------	UNKNOWN
111.9358 -43.1335    2.9  48.0 -129.0  10.6776   4.0 ------	UNKNOWN
Plot creation:
Sun Jul 31 21:40:54 EDT 2016