Estimated redshift from machine learning (Ukwatta et al. 2016) - may take a few minutes to calcaulte
Image
Pre-slew 15-350 keV image (Event data; bkg subtracted)

#   RAcent  DECcent POSerr  Theta    Phi     Peak Cts     SNR  Name
  169.8867 -61.4599 0.0363   14.0  -30.1       0.1705     5.3  TRIG_00706396
------------------------------------------

Foreground time interval of the image:
  0.000   8.529 (delta_t =   8.529 [sec])
Background time interval of the image:
-42.671   0.000 (delta_t =  42.671 [sec])
Lightcurves
Notes:
- 1) All plots contain as much data as has been downloaded to date.
- 2) The mask-weighted light curves are using the flight position.
- 3) Multiple plots of different time binning/intervals are shown to cover all scenarios of short/long GRBs, rate/image triggers, and real/false positives.
- 4) For all the mask-weighted lightcurves, the y-axis units are counts/sec/det where a det is 0.4 x 0.4 = 0.16 sq cm.
- 5) The verticle lines correspond to following: green dotted lines are T50 interval, black dotted lines are T90 interval, blue solid line(s) is a spacecraft slew start time, and orange solid line(s) is a spacecraft slew end time.
- 6) Time of each bin is in the middle of the bin.
1 s binning
From T0-310 s to T0+310 s

From T100_start - 20 s to T100_end + 30 s

Full time interval

64 ms binning
Full time interval

From T100_start to T100_end

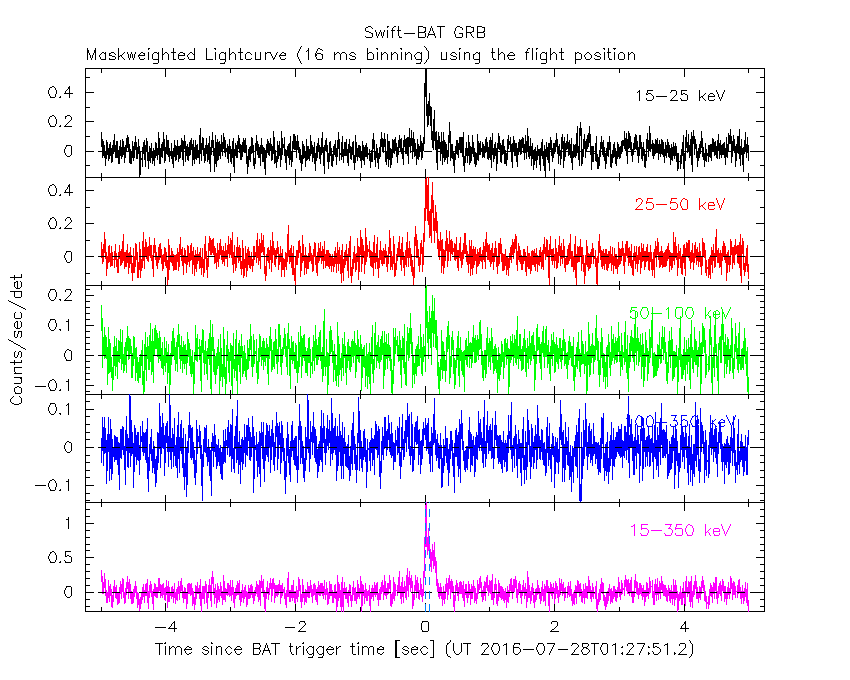
From T0-5 sec to T0+5 sec

16 ms binning
From T100_start-5 s to T100_start+5 s
Blue+Cyan dotted lines: Time interval of the scaled map
From 0.000000 to 0.064000
8 ms binning
From T100_start-3 s to T100_start+3 s

Blue+Cyan dotted lines: Time interval of the scaled map
From 0.000000 to 0.064000
2 ms binning
From T100_start-1 s to T100_start+1 s

Blue+Cyan dotted lines: Time interval of the scaled map
From 0.000000 to 0.064000
SN=5 or 10 sec. binning (whichever binning is satisfied first)

SN=5 or 10 sec. binning (T < 200 sec)

Spectra
Notes:
- 1) The fitting includes the systematic errors.
- 2) For long bursts, a spectral fit of the pre-slew DRM will introduce some errors in both a spectral shape and a normalization if the PHA file contains a lot of the slew/post-slew time interval.
- 3) For fits to more complicated models (e.g. a power-law over a cutoff power-law), the BAT team has decided to require a chi-square improvement of more than 6 for each extra dof.
- 4) For short bursts (T90<1sec), the specrtum is also fit with Blackbody, OTTB, and Double Blackbody.
Time averaged spectrum fit using the pre-slew DRM
Power-law model

Multiple GTIs in the spectrum
tstart tstop
0.000000 68.228000
69.128000 81.428000
82.128000 96.000000

Spectral model in power-law:
------------------------------------------------------------
Parameters  : value       lower 90%   higher 90%
Photon index: 3.31301     ( -1.35854   -3.31301 )
Norm@50keV  : 5.84146E-05    ( -5.84147e-05   0.000116531 )
------------------------------------------------------------
#Fit statistic : Chi-Squared =          50.59 using 59 PHA bins.
# Reduced chi-squared =         0.8875 for     57 degrees of freedom
# Null hypothesis probability =   7.128102e-01

Photon flux (15-150 keV)    in 94.4 sec: 2.03526E-02 ( -0.0203526  0.0129834 ) ph/cm2/s
Energy fluence (15-150 keV)             : 7.77531e-08 ( -6.76006e-08  8.00031e-08 ) ergs/cm2
Cutoff power-law model

Multiple GTIs in the spectrum
tstart tstop
0.000000 68.228000
69.128000 81.428000
82.128000 96.000000
Spectral model in the cutoff power-law:
------------------------------------------------------------
Parameters  : value       lower 90%   higher 90%
Photon index: 1.04649     (     )
Epeak [keV] : 16.9980      (   )
Norm@50keV  : 1.44201E-03    (     )
------------------------------------------------------------
#Fit statistic : Chi-Squared =          50.52 using 59 PHA bins.
# Reduced chi-squared =         0.9022 for     56 degrees of freedom
# Null hypothesis probability =   6.815188e-01

Photon flux (15-150 keV)    in 94.4 sec: 2.13172E-02 ( -0.0213172  0.012672 ) ph/cm2/s
Energy fluence (15-150 keV)             : 8.1702e-08 ( -8.1702e-08  7.43837e-08 ) ergs/cm2
Band function

Multiple GTIs in the spectrum
tstart tstop
0.000000 68.228000
69.128000 81.428000
82.128000 96.000000

Spectral model in the Band function:
------------------------------------------------------------
Parameters  : value       lower 90%   higher 90%
alpha       : -1.59198   ( 1.59217   1.59217 )
beta        : -9.37149    ( 9.37165   19.3716 )
Epeak [keV] : 9.86792      ( -9.84562 -9.84562 )
Norm@50keV   : 6.59014E-04    ( -0.000659305   380351 )
------------------------------------------------------------
#Fit statistic : Chi-Squared =          50.49 using 59 PHA bins.
# Reduced chi-squared =         0.9180 for     55 degrees of freedom
# Null hypothesis probability =   6.474399e-01

Photon flux (15-150 keV)    in 94.4 sec: 2.09538E-02 ( 6.97905  -0.0109108 ) ph/cm2/s
Energy fluence (15-150 keV)             : 0 ( 0  0 ) ergs/cm2
Single BB

Spectral model blackbody:
------------------------------------------------------------
Parameters  : value    Lower 90%  Upper 90%
kT [keV]    : 7.22929  (-7.23076  5.23128)
R^2/D10^2   : 3.84046E-02  (-0.0383726   -0.0383726)
(R is the radius in km and D10 is the distance to the source in units of 10 kpc)
------------------------------------------------------------
#Fit statistic : Chi-Squared =          50.98 using 59 PHA bins.
# Reduced chi-squared =         0.8944 for     57 degrees of freedom
# Null hypothesis probability =   6.991633e-01

Energy  Fluence     90% Error
[keV]   [erg/cm2]   [erg/cm2]
15- 25  3.144e-08   2.087e-08
25- 50  4.579e-08   3.356e-08
50-150  8.514e-09   7.864e-09
15-150  8.574e-08   6.070e-08
Thermal bremsstrahlung (OTTB)

Spectral model: thermal bremsstrahlung
------------------------------------------------------------
Parameters  : value         Lower 90%    Upper 90%
kT [keV]    : 21.0553       (-21.1591      57.6872)
Norm        : 0.251506       (-0.250505     -0.250505)
------------------------------------------------------------
#Fit statistic : Chi-Squared =          50.51 using 59 PHA bins.
# Reduced chi-squared =         0.8861 for     57 degrees of freedom
# Null hypothesis probability =   7.155877e-01

Energy  Fluence     90% Error
[keV]   [erg/cm2]   [erg/cm2]
15- 25  3.841e-08   2.506e-08
25- 50  3.497e-08   2.565e-08
50-150  1.140e-08   1.367e-08
15-150  8.479e-08   5.909e-08
Double BB

------------------------------------------------------------
Parameters  : value         Lower 90%    Upper 90%
kT1 [keV]   : 0.213738        (-0.213666      3.05548)
R1^2/D10^2  : 1.03095E+23        (-1.27509e+22      -9.95089e+22)
kT2 [keV]   : 8.49626        (-4.39549      6.28182)
R2^2/D10^2  : 1.75060E-02    (-0.0163268   0.0793354)
------------------------------------------------------------
#Fit statistic : Chi-Squared =          47.51 using 59 PHA bins.
#Fit statistic : Chi-Squared =          47.28 using 59 PHA bins.
# Reduced chi-squared =         0.8639 for     55 degrees of freedom
# Reduced chi-squared =         0.8596 for     55 degrees of freedom
# Null hypothesis probability =   7.532366e-01
# Null hypothesis probability =   7.609129e-01

Energy  Fluence     90% Error
[keV]   [erg/cm2]   [erg/cm2]
15- 25  3.054e-08   1.445e-08
25- 50  4.038e-08   2.727e-08
50-150  1.545e-08   1.563e-08
15-150  8.637e-08   5.074e-08
Peak spectrum fit
Power-law model

Time interval is from   -0.020 sec. to    0.980 sec.

Spectral model in power-law:
------------------------------------------------------------
Parameters  : value       lower 90%   higher 90%
Photon index: 2.14011     ( -0.228353   0.247281 )
Norm@50keV  : 7.14516E-03    ( -0.00129185   0.00126725 )
------------------------------------------------------------
#Fit statistic : Chi-Squared =          67.77 using 59 PHA bins.
# Reduced chi-squared =          1.189 for     57 degrees of freedom
# Null hypothesis probability =   1.555457e-01

Photon flux (15-150 keV)    in 1 sec: 1.14690 ( -0.15291  0.15291 ) ph/cm2/s
Energy fluence (15-150 keV)             : 6.66655e-08 ( -1.06565e-08  1.096e-08 ) ergs/cm2
Cutoff power-law model

Time interval is from   -0.020 sec. to    0.980 sec.
Spectral model in the cutoff power-law:
------------------------------------------------------------
Parameters  : value       lower 90%   higher 90%
Photon index: -0.467555     ( -2.22839   1.52954 )
Epeak [keV] : 35.1738      ( -5.65905 5.96279 )
Norm@50keV  : 0.289974    ( -0.312196   7.53553 )
------------------------------------------------------------
#Fit statistic : Chi-Squared =          57.48 using 59 PHA bins.
# Reduced chi-squared =          1.026 for     56 degrees of freedom
# Null hypothesis probability =   4.201066e-01

Photon flux (15-150 keV)    in 1 sec: 1.09861 ( -0.151711  0.15256 ) ph/cm2/s
Energy fluence (15-150 keV)             : 5.6519e-08 ( -9.0744e-09  1.02868e-08 ) ergs/cm2
Band function

Time interval is from   -0.020 sec. to    0.980 sec.

Spectral model in the Band function:
------------------------------------------------------------
Parameters  : value       lower 90%   higher 90%
alpha       : 1.06434   ( -2.0215   -1.0442 )
beta        : -3.68518    ( 3.68483   1.143 )
Epeak [keV] : 34.0923      ( -6.05365 6.23459 )
Norm@50keV   : 0.738073    ( -0.692716   171.634 )
------------------------------------------------------------
#Fit statistic : Chi-Squared =          57.28 using 59 PHA bins.
# Reduced chi-squared =          1.042 for     55 degrees of freedom
# Null hypothesis probability =   3.904075e-01

Photon flux (15-150 keV)    in 1 sec:  (    ) ph/cm2/s
Energy fluence (15-150 keV)             : 5.87454e-08 ( -5.87384e-08  -1.08265e-08 ) ergs/cm2
Single BB

Spectral model blackbody:
------------------------------------------------------------
Parameters  : value    Lower 90%  Upper 90%
kT [keV]    : 9.00170  (-1.04818  1.18653)
R^2/D10^2   : 0.865034  (-0.336582   0.540209)
(R is the radius in km and D10 is the distance to the source in units of 10 kpc)
------------------------------------------------------------
#Fit statistic : Chi-Squared =          58.29 using 59 PHA bins.
# Reduced chi-squared =          1.023 for     57 degrees of freedom
# Null hypothesis probability =   4.277979e-01

Energy  Fluence     90% Error
[keV]   [erg/cm2]   [erg/cm2]
15- 25  1.365e-08   3.045e-09
25- 50  2.902e-08   4.630e-09
50-150  1.108e-08   3.873e-09
15-150  5.374e-08   1.004e-08
Thermal bremsstrahlung (OTTB)

Spectral model: thermal bremsstrahlung
------------------------------------------------------------
Parameters  : value         Lower 90%    Upper 90%
kT [keV]    : 48.1087       (-12.9895      21.0861)
Norm        : 6.82325       (-1.34049     1.73542)
------------------------------------------------------------
#Fit statistic : Chi-Squared =          61.49 using 59 PHA bins.
# Reduced chi-squared =          1.079 for     57 degrees of freedom
# Null hypothesis probability =   3.183348e-01

Energy  Fluence     90% Error
[keV]   [erg/cm2]   [erg/cm2]
15- 25  1.653e-08   2.565e-09
25- 50  2.341e-08   3.830e-09
50-150  2.191e-08   7.940e-09
15-150  6.185e-08   1.202e-08
Double BB

R1^2/D10^2  : 3150.35        (-3177.64      -3177.64)
kT2 [keV]   : 9.33170        (-1.18243      -9.33169)
R2^2/D10^2  : 0.731321    (-0.731351   0.479028)
------------------------------------------------------------
#Fit statistic : Chi-Squared =          57.01 using 59 PHA bins.
#Fit statistic : Chi-Squared =          56.97 using 59 PHA bins.
#Fit statistic : Chi-Squared =          56.95 using 59 PHA bins.
# Reduced chi-squared =          1.037 for     55 degrees of freedom
# Reduced chi-squared =          1.036 for     55 degrees of freedom
# Reduced chi-squared =          1.035 for     55 degrees of freedom
# Null hypothesis probability =   4.001256e-01
# Null hypothesis probability =   4.018275e-01
# Null hypothesis probability =   4.023775e-01

Energy  Fluence     90% Error
[keV]   [erg/cm2]   [erg/cm2]
15- 25  1.417e-08   4.463e-09
25- 50  2.824e-08   7.940e-09
50-150  1.225e-08   5.345e-09
15-150  5.465e-08   1.416e-08
Pre-slew spectrum (Pre-slew PHA with pre-slew DRM)
Power-law model

Spectral model in power-law:
------------------------------------------------------------
Parameters  : value       lower 90%   higher 90%
Photon index: 2.52493     ( -0.47691   0.619452 )
Norm@50keV  : 9.67236E-04    ( -0.000416423   0.000415562 )
------------------------------------------------------------
#Fit statistic : Chi-Squared =          53.78 using 59 PHA bins.
# Reduced chi-squared =         0.9435 for     57 degrees of freedom
# Null hypothesis probability =   5.966590e-01

Photon flux (15-150 keV)    in 8.529 sec: 0.192947 ( -0.0451259  0.0452223 ) ph/cm2/s
Energy fluence (15-150 keV)             : 8.30572e-08 ( -2.53096e-08  2.76277e-08 ) ergs/cm2
Cutoff power-law model

Spectral model in the cutoff power-law:
------------------------------------------------------------
Parameters  : value       lower 90%   higher 90%
Photon index: 1.78844     (     )
Epeak [keV] : 11.3267      (   )
Norm@50keV  : 2.73871E-03    (     )
------------------------------------------------------------
#Fit statistic : Chi-Squared =          53.29 using 59 PHA bins.
# Reduced chi-squared =         0.9515 for     56 degrees of freedom
# Null hypothesis probability =   5.782453e-01

Photon flux (15-150 keV)    in 8.529 sec: 0.191664 ( -0.044411  0.044903 ) ph/cm2/s
Energy fluence (15-150 keV)             : 7.94826e-08 ( -2.40059e-08  2.84212e-08 ) ergs/cm2
Band function

Spectral model in the Band function:
------------------------------------------------------------
Parameters  : value       lower 90%   higher 90%
alpha       : -1.84353   ( -5.74291   1.89425 )
beta        : -10.0000    ( 10   1.77636e-15 )
Epeak [keV] : 8.56141      ( -7.00309 27.4977 )
Norm@50keV   : 2.58781E-03    ( -0.00128315   0.0865661 )
------------------------------------------------------------
#Fit statistic : Chi-Squared =          53.27 using 59 PHA bins.
# Reduced chi-squared =         0.9685 for     55 degrees of freedom
# Null hypothesis probability =   5.410334e-01

Photon flux (15-150 keV)    in 8.529 sec: 0.192085 ( 6.80792  -0.044765 ) ph/cm2/s
Energy fluence (15-150 keV)             : 7.96119e-08 ( -7.95522e-08  -2.43465e-08 ) ergs/cm2
S(25-50 keV) vs. S(50-100 keV) plot

S(25-50 keV)  = 2.50e-08
S(50-100 keV) = 1.01e-08
T90 vs. Hardness ratio plot

T90                                   = 96.0000000596046 sec.
Hardness ratio (energy fluence ratio) = 0.404
Color vs. Color plot

Count Ratio  (25-50 keV) / (15-25 keV) = 1.09569
Count Ratio (50-100 keV) / (15-25 keV) = -0.075604
Mask shadow pattern

IMX = 2.155323175532926E-01, IMY = 1.251393619132249E-01
TIME vs. PHA plot around the trigger time

Blue+Cyan dotted lines: Time interval of the scaled map
From 0.000000 to 0.064000
TIME vs. DetID plot around the trigger time

Blue+Cyan dotted lines: Time interval of the scaled map
From 0.000000 to 0.064000
100 us light curve (15-350 keV)

Blue+Cyan dotted lines: Time interval of the scaled map
From 0.000000 to 0.064000
Spacecraft aspect plot

Bright source in the pre-burst/pre-slew/post-slew images
Pre-burst image of 15-350 keV band
Time interval of the image:
-42.671400 0.000000

# RAcent  DECcent POSerr Theta    Phi  PeakCts   SNR AngSep     Name
#  [deg]    [deg]    ['] [deg]  [deg]                   [']
135.4991 -40.5716    2.3  36.0  -82.9   0.8806   5.1    1.7	Vela X-1
169.9907 -60.5810    5.5  14.9  -30.6  -0.1479  -2.1    9.9	Cen X-3
186.6776 -62.7822    0.8  15.4    1.1   0.9719  13.7    0.9	GX 301-2
174.8629 -48.8769    2.2  26.9  -28.5   0.3939   5.3 ------	UNKNOWN
112.2353 -45.7695    2.5  35.3 -113.5   0.6389   4.6 ------	UNKNOWN
Pre-slew background subtracted image of 15-350 keV band
Time interval of the image:
0.000000 8.528600

# RAcent  DECcent POSerr Theta    Phi  PeakCts   SNR AngSep     Name
#  [deg]    [deg]    ['] [deg]  [deg]                   [']
135.3576 -40.5511    2.9  36.1  -83.1  -0.3253  -3.9    7.8	Vela X-1
170.3515 -60.4426    4.8  15.0  -30.1   0.0786   2.4   10.9	Cen X-3
186.8845 -62.8875    5.5  15.3    1.6  -0.0712  -2.1    9.4	GX 301-2
231.1879 -45.9506    1.9  41.4   36.5   0.4550   6.1 ------	UNKNOWN
109.9732 -54.1364    2.1  28.1 -122.0   0.2612   5.6 ------	UNKNOWN
Post-slew image of 15-350 keV band
Time interval of the image:
45.628590 68.228000
69.128000 81.428000
82.128000 962.194300

# RAcent  DECcent POSerr Theta    Phi  PeakCts   SNR AngSep     Name
#  [deg]    [deg]    ['] [deg]  [deg]                   [']
135.5191 -40.5684    0.8  29.4 -111.1  15.0500  13.6    0.9	Vela X-1
170.2595 -60.6232   12.0   0.9  -38.2   0.6114   1.0    1.7	Cen X-3
186.6650 -62.7831    0.6   7.9   56.4  12.1526  19.8    0.8	GX 301-2
286.3216 -77.5767    3.0  35.7  110.3   6.1758   3.9 ------	UNKNOWN
223.2219 -40.8143    3.2  37.8   31.6   4.2028   3.6 ------	UNKNOWN
196.0424 -58.1915    3.5  13.5   37.2   2.1848   3.3 ------	UNKNOWN
188.4592 -26.6833    3.3  37.0  -22.1   2.9123   3.5 ------	UNKNOWN
149.7135 -44.9565    2.6  20.3  -95.1   3.1626   4.5 ------	UNKNOWN
164.4567 -16.0882    3.1  45.6  -57.7  14.2205   3.7 ------	UNKNOWN
Plot creation:
Fri Jul 29 02:50:01 EDT 2016