Estimated redshift from machine learning (Ukwatta et al. 2016) - may take a few minute to calcaulte
Image
Pre-slew 15.0-350.0 keV image (Event data)

# RAcent DECcent POSerr Theta Phi Peak Cts SNR Name
212.7663 13.4827 0.0143 29.5146 20.4480 0.3242621 13.521 TRIG_00706871
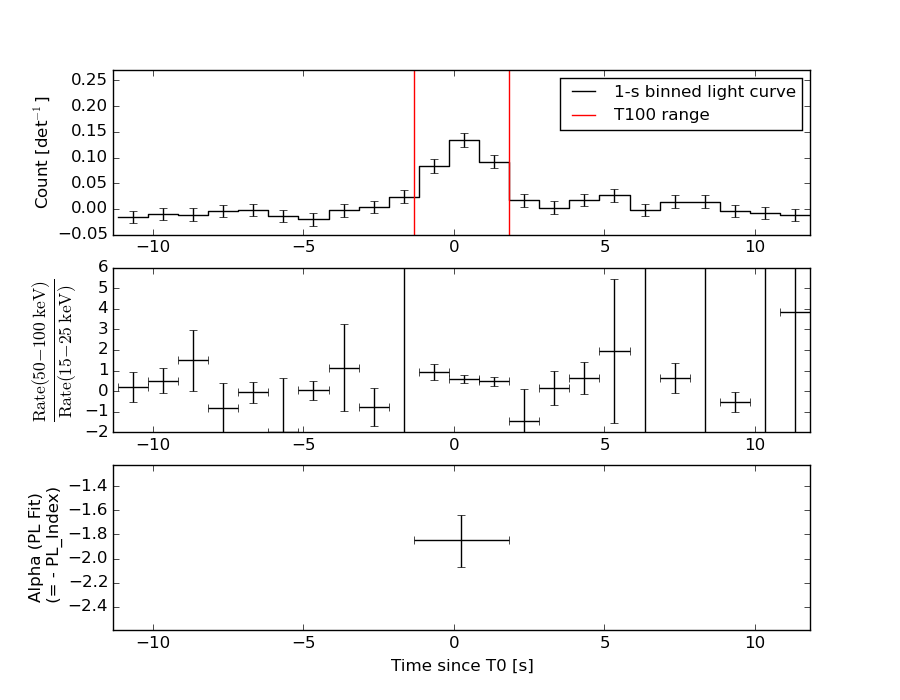
Foreground time interval of the image:
-1.344 1.828 (delta_t = 3.172 [sec])
Background time interval of the image:
-239.168 -1.344 (delta_t = 237.824 [sec])
Lightcurves
Notes:
- 1) The mask-weighted light curves are using the flight position.
- 2) Multiple plots of different time binning/intervals are shown to cover all scenarios of short/long GRBs, rate/image triggers, and real/false positives.
- 3) For all the mask-weighted lightcurves, the y-axis units are counts/sec/det where a det is 0.4 x 0.4 = 0.16 sq cm.
- 4) The verticle lines correspond to following: green dotted lines are T50 interval, black dotted lines are T90 interval, blue solid line(s) is a spacecraft slew start time, and orange solid line(s) is a spacecraft slew end time.
- 5) Time of each bin is in the middle of the bin.
1 s binning
From T0-310 s to T0+310 s

From T100_start - 20 s to T100_end + 30 s

Full time interval

64 ms binning
Full time interval

From T100_start to T100_end

From T0-5 sec to T0+5 sec

16 ms binning
From T100_start-5 s to T100_start+5 s

8 ms binning
From T100_start-3 s to T100_start+3 s

2 ms binning
From T100_start-1 s to T100_start+1 s

SN=5 or 10 sec. binning (whichever binning is satisfied first)

SN=5 or 10 sec. binning (T < 200 sec)

Quad-rate summed light curves (from T0-300s to T0+1000s)

Spectral Evolution
Spectra
Notes:
- 1) The fitting includes the systematic errors.
- 2) When the burst includes telescope slew time periods, the fitting uses an average response file made from multiple 5-s response files through out the slew time plus single time preiod for the non-slew times, and weighted by the total counts in the corresponding time period using addrmf. An average response file is needed becuase a spectral fit using the pre-slew DRM will introduce some errors in both a spectral shape and a normalization if the PHA file contains a lot of the slew/post-slew time interval.
- 3) For fits to more complicated models (e.g. a power-law over a cutoff power-law), the BAT team has decided to require a chi-square improvement of more than 6 for each extra dof.
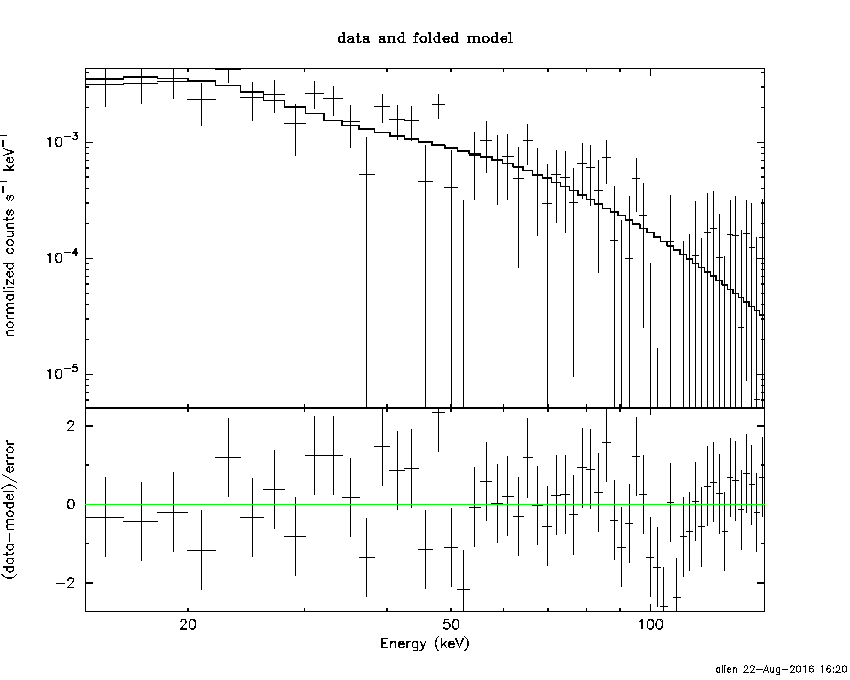
Time averaged spectrum fit using the average DRM
Power-law model

Time interval is from   -1.344 sec. to    1.828 sec.

Spectral model in power-law:
------------------------------------------------------------
Parameters  : value       lower 90%   higher 90%
Photon index: 1.84845     ( -0.212989   0.225326 )
Norm@50keV  : 5.97874E-03    ( -0.000889968   0.000869387 )
------------------------------------------------------------
#Fit statistic : Chi-Squared =          56.84 using 59 PHA bins.
# Reduced chi-squared =         0.9971 for     57 degrees of freedom
# Null hypothesis probability =   4.812263e-01

Photon flux (15-150 keV)    in 3.172 sec: 0.839892 ( -0.104718  0.104742 ) ph/cm2/s
Energy fluence (15-150 keV)             : 1.74407e-07 ( -2.56512e-08  2.61297e-08 ) ergs/cm2
Cutoff power-law model

Time interval is from   -1.344 sec. to    1.828 sec.
Spectral model in the cutoff power-law:
------------------------------------------------------------
Parameters  : value       lower 90%   higher 90%
Photon index: 1.00238     ( -1.13633   0.912072 )
Epeak [keV] : 51.3105      ( -14.2445 -51.3105 )
Norm@50keV  : 1.79401E-02    ( -0.0179401   0.0608771 )
------------------------------------------------------------
#Fit statistic : Chi-Squared =          54.39 using 59 PHA bins.
# Reduced chi-squared =         0.9712 for     56 degrees of freedom
# Null hypothesis probability =   5.361500e-01

Photon flux (15-150 keV)    in 3.172 sec: 0.819013 ( -0.107099  0.107156 ) ph/cm2/s
Energy fluence (15-150 keV)             : 1.62485e-07 ( -2.72457e-08  2.8867e-08 ) ergs/cm2
Band function

Time interval is from   -1.344 sec. to    1.828 sec.

Spectral model in the Band function:
------------------------------------------------------------
Parameters  : value       lower 90%   higher 90%
alpha       : -1.09726   ( 1.05421   5.93684 )
beta        : -2.89517    ( 2.94918   1.17938 )
Epeak [keV] : 51.9091      ( -51.4944 4503.33 )
Norm@50keV   : 1.58823E-02    ( -0.00793122   420.955 )
------------------------------------------------------------
#Fit statistic : Chi-Squared =          54.36 using 59 PHA bins.
# Reduced chi-squared =         0.9883 for     55 degrees of freedom
# Null hypothesis probability =   4.991359e-01

Photon flux (15-150 keV)    in 3.172 sec: 0.820107 ( -0.104741  0.103513 ) ph/cm2/s
Energy fluence (15-150 keV)             : 5.21823e-08 ( 0  0 ) ergs/cm2
Single BB

Spectral model blackbody:
------------------------------------------------------------
Parameters  : value    Lower 90%  Upper 90%
kT [keV]    : 11.0941  (-1.54894  1.8033)
R^2/D10^2   : 0.275939  (-0.118879   0.206894)
(R is the radius in km and D10 is the distance to the source in units of 10 kpc)
------------------------------------------------------------
#Fit statistic : Chi-Squared =          64.73 using 59 PHA bins.
# Reduced chi-squared =          1.136 for     57 degrees of freedom
# Null hypothesis probability =   2.251073e-01

Energy  Fluence     90% Error
[keV]   [erg/cm2]   [erg/cm2]
15- 25  2.255e-08   5.454e-09
25- 50  6.445e-08   1.050e-08
50-150  4.510e-08   1.408e-08
15-150  1.321e-07   2.128e-08
Thermal bremsstrahlung (OTTB)

Spectral model: thermal bremsstrahlung
------------------------------------------------------------
Parameters  : value         Lower 90%    Upper 90%
kT [keV]    : 86.1894       (-28.538      57.4417)
Norm        : 3.89474       (-0.648285     0.804046)
------------------------------------------------------------
#Fit statistic : Chi-Squared =          54.64 using 59 PHA bins.
# Reduced chi-squared =         0.9585 for     57 degrees of freedom
# Null hypothesis probability =   5.642591e-01

Energy  Fluence     90% Error
[keV]   [erg/cm2]   [erg/cm2]
15- 25  3.218e-08   5.951e-09
25- 50  5.391e-08   7.819e-09
50-150  7.990e-08   4.122e-08
15-150  1.660e-07   4.319e-08
Double BB

Spectral model: bbodyrad<1> + bbodyrad<2>
------------------------------------------------------------
Parameters  : value         Lower 90%    Upper 90%
kT1 [keV]   : 6.05014        (-2.74408      2.80947)
R1^2/D10^2  : 1.56788        (-1.06983      14.5134)
kT2 [keV]   : 18.1435        (-5.25304      15.533)
R2^2/D10^2  : 3.11402E-02    (-0.0285727   0.106411)
------------------------------------------------------------
#Fit statistic : Chi-Squared =          54.30 using 59 PHA bins.
# Reduced chi-squared =         0.9872 for     55 degrees of freedom
# Null hypothesis probability =   5.014931e-01

Energy  Fluence     90% Error
[keV]   [erg/cm2]   [erg/cm2]
15- 25  3.097e-08   1.711e-08
25- 50  5.506e-08   2.860e-08
50-150  7.469e-08   4.350e-08
15-150  1.607e-07   8.363e-08
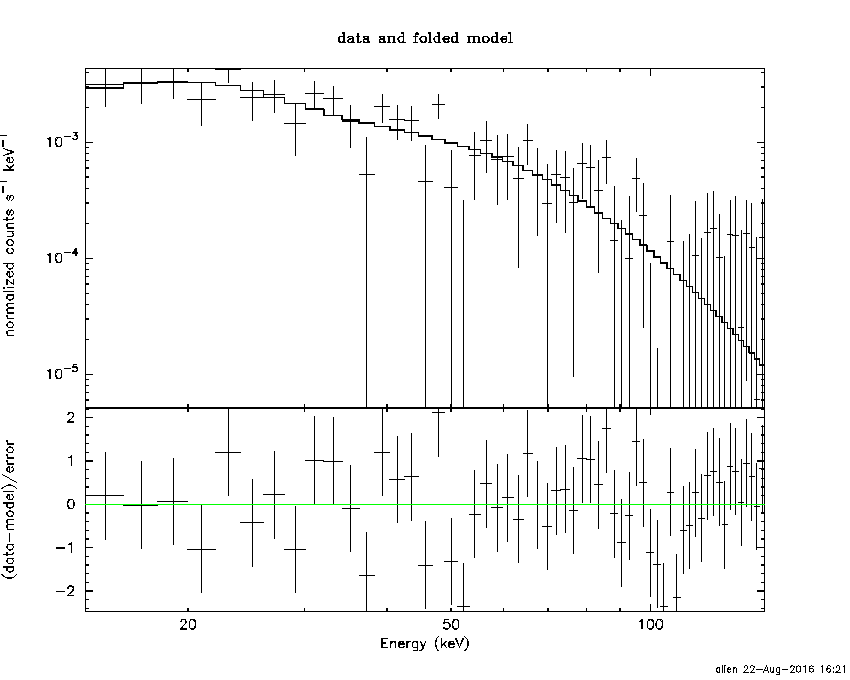
Peak spectrum fit
Power-law model

Time interval is from   -0.024 sec. to    0.976 sec.

Spectral model in power-law:
------------------------------------------------------------
Parameters  : value       lower 90%   higher 90%
Photon index: 1.97547     ( -0.247858   0.267695 )
Norm@50keV  : 7.91713E-03    ( -0.00155086   0.00151982 )
------------------------------------------------------------
#Fit statistic : Chi-Squared =          68.93 using 59 PHA bins.
# Reduced chi-squared =          1.209 for     57 degrees of freedom
# Null hypothesis probability =   1.336120e-01

Photon flux (15-150 keV)    in 1 sec: 1.17446 ( -0.185841  0.18585 ) ph/cm2/s
Energy fluence (15-150 keV)             : 7.2929e-08 ( -1.35094e-08  1.38391e-08 ) ergs/cm2
Cutoff power-law model

Time interval is from   -0.024 sec. to    0.976 sec.
Spectral model in the cutoff power-law:
------------------------------------------------------------
Parameters  : value       lower 90%   higher 90%
Photon index: -0.826273     ( -2.32607   1.59634 )
Epeak [keV] : 39.6142      ( -5.87684 8.09673 )
Norm@50keV  : 0.375409    ( -0.388101   10.1983 )
------------------------------------------------------------
#Fit statistic : Chi-Squared =          57.88 using 59 PHA bins.
# Reduced chi-squared =          1.034 for     56 degrees of freedom
# Null hypothesis probability =   4.057696e-01

Photon flux (15-150 keV)    in 1 sec: 1.13600 ( -0.182935  0.18398 ) ph/cm2/s
Energy fluence (15-150 keV)             : 6.25331e-08 ( -1.16176e-08  1.29448e-08 ) ergs/cm2
Band function

Time interval is from   -0.024 sec. to    0.976 sec.

Spectral model in the Band function:
------------------------------------------------------------
Parameters  : value       lower 90%   higher 90%
alpha       : 1.79774   ( -3.82359   -3.03099 )
beta        : -3.33356    ( 6.27101   16.2141 )
Epeak [keV] : 36.4602      ( -10.087 6.41131 )
Norm@50keV   : 1.73319    ( -1.92516   131.103 )
------------------------------------------------------------
#Fit statistic : Chi-Squared =          57.77 using 59 PHA bins.
# Reduced chi-squared =          1.050 for     55 degrees of freedom
# Null hypothesis probability =   3.733013e-01

Photon flux (15-150 keV)    in 1 sec: 1.14653 ( -0.183048  0.18554 ) ph/cm2/s
Energy fluence (15-150 keV)             : 6.23017e-08 ( -1.12394e-08  1.76983e-08 ) ergs/cm2
Single BB

Spectral model blackbody:
------------------------------------------------------------
Parameters  : value    Lower 90%  Upper 90%
kT [keV]    : 10.0277  (-1.36093  1.56164)
R^2/D10^2   : 0.610463  (-0.262627   0.450418)
(R is the radius in km and D10 is the distance to the source in units of 10 kpc)
------------------------------------------------------------
#Fit statistic : Chi-Squared =          58.34 using 59 PHA bins.
# Reduced chi-squared =          1.024 for     57 degrees of freedom
# Null hypothesis probability =   4.257438e-01

Energy  Fluence     90% Error
[keV]   [erg/cm2]   [erg/cm2]
15- 25  1.251e-08   3.492e-09
25- 50  3.123e-08   6.730e-09
50-150  1.643e-08   6.533e-09
15-150  6.018e-08   1.187e-08
Thermal bremsstrahlung (OTTB)

Spectral model: thermal bremsstrahlung
------------------------------------------------------------
Parameters  : value         Lower 90%    Upper 90%
kT [keV]    : 62.0113       (-20.1415      36.9098)
Norm        : 6.28852       (-1.34671     1.63043)
------------------------------------------------------------
#Fit statistic : Chi-Squared =          63.32 using 59 PHA bins.
# Reduced chi-squared =          1.111 for     57 degrees of freedom
# Null hypothesis probability =   2.631852e-01

Energy  Fluence     90% Error
[keV]   [erg/cm2]   [erg/cm2]
15- 25  1.589e-08   3.265e-09
25- 50  2.442e-08   4.595e-09
50-150  2.855e-08   1.222e-08
15-150  6.886e-08   1.752e-08
Double BB

------------------------------------------------------------
Parameters  : value         Lower 90%    Upper 90%
kT1 [keV]   : 8.02698        (-7.5605      -7.5605)
R1^2/D10^2  : 0.877691        (-0.886208      -0.886208)
kT2 [keV]   : 14.0894        (-13.1676      -13.1676)
R2^2/D10^2  : 7.54431E-02    (-0.0751687   0.915856)
------------------------------------------------------------
#Fit statistic : Chi-Squared =          57.74 using 59 PHA bins.
#Fit statistic : Chi-Squared =          57.72 using 59 PHA bins.
# Reduced chi-squared =          1.050 for     55 degrees of freedom
# Reduced chi-squared =          1.049 for     55 degrees of freedom
# Null hypothesis probability =   3.742835e-01
# Null hypothesis probability =   3.751252e-01

Energy  Fluence     90% Error
[keV]   [erg/cm2]   [erg/cm2]
15- 25  1.342e-08   1.884e-08
25- 50  2.985e-08   9.425e-08
50-150  1.976e-08   2.505e-07
15-150  6.303e-08   3.525e-07
Pre-slew spectrum (Pre-slew PHA with pre-slew DRM)
Power-law model
Spectral model in power-law:
------------------------------------------------------------
Parameters  : value       lower 90%   higher 90%
Photon index: 1.84845     ( -0.212989   0.225326 )
Norm@50keV  : 5.97874E-03    ( -0.000889968   0.000869387 )
------------------------------------------------------------
#Fit statistic : Chi-Squared =          56.84 using 59 PHA bins.
# Reduced chi-squared =         0.9971 for     57 degrees of freedom
# Null hypothesis probability =   4.812263e-01

Photon flux (15-150 keV)    in 3.172 sec: 0.839845 ( -0.104711  0.104734 ) ph/cm2/s
Energy fluence (15-150 keV)             : 1.74379e-07 ( -2.5641e-08  2.61369e-08 ) ergs/cm2
Cutoff power-law model
Spectral model in the cutoff power-law:
------------------------------------------------------------
Parameters  : value       lower 90%   higher 90%
Photon index: 1.00238     ( -1.13633   0.912073 )
Epeak [keV] : 51.3105      ( -14.2445 -51.3105 )
Norm@50keV  : 1.79401E-02    ( -0.0179401   0.0608771 )
------------------------------------------------------------
#Fit statistic : Chi-Squared =          54.39 using 59 PHA bins.
# Reduced chi-squared =         0.9712 for     56 degrees of freedom
# Null hypothesis probability =   5.361500e-01

Photon flux (15-150 keV)    in 3.172 sec: 0.818877 ( -0.107065  0.107122 ) ph/cm2/s
Energy fluence (15-150 keV)             : 1.62529e-07 ( -2.72538e-08  2.88931e-08 ) ergs/cm2
Band function

Spectral model in the Band function:
------------------------------------------------------------
Parameters  : value       lower 90%   higher 90%
alpha       : -1.09726   ( 1.05421   5.93686 )
beta        : -2.89517    ( 2.94918   1.17938 )
Epeak [keV] : 51.9091      ( -51.4944 4482.61 )
Norm@50keV   : 1.58823E-02    ( -0.00793122   420.955 )
------------------------------------------------------------
#Fit statistic : Chi-Squared =          54.36 using 59 PHA bins.
# Reduced chi-squared =         0.9883 for     55 degrees of freedom
# Null hypothesis probability =   4.991359e-01

Photon flux (15-150 keV)    in 3.172 sec: 0.820107 ( -0.104742  0.103513 ) ph/cm2/s
Energy fluence (15-150 keV)             : 5.21823e-08 ( 0  0 ) ergs/cm2
S(25-50 keV) vs. S(50-100 keV) plot

S(25-50 keV)  = 5.01e-08
S(50-100 keV) = 5.55e-08
T90 vs. Hardness ratio plot
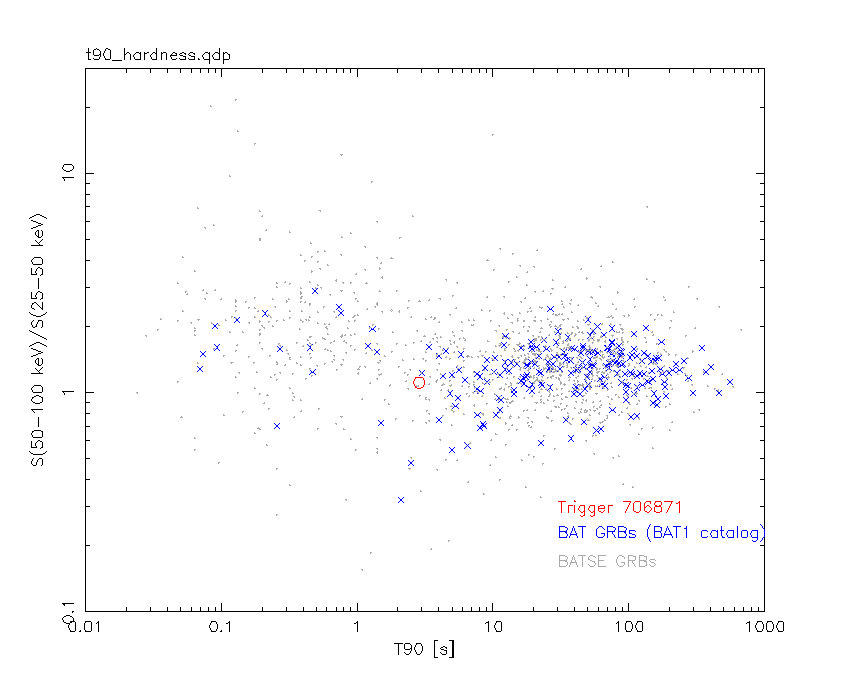
T90                                   = 2.85199993848801 sec.
Hardness ratio (energy fluence ratio) = 1.10778
Color vs. Color plot

Count Ratio  (25-50 keV) / (15-25 keV) = 1.22996
Count Ratio (50-100 keV) / (15-25 keV) = 0.685985
Mask shadow pattern

IMX = 5.304375290009572E-01, IMY = -1.977738262508182E-01
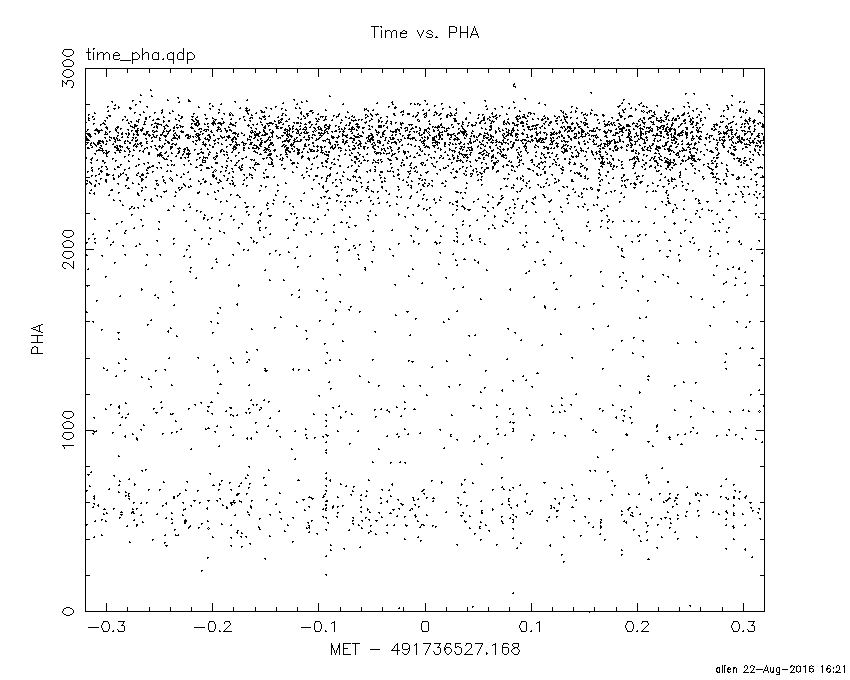
TIME vs. PHA plot around the trigger time
TIME vs. DetID plot around the trigger time

100 us light curve (15-350 keV)

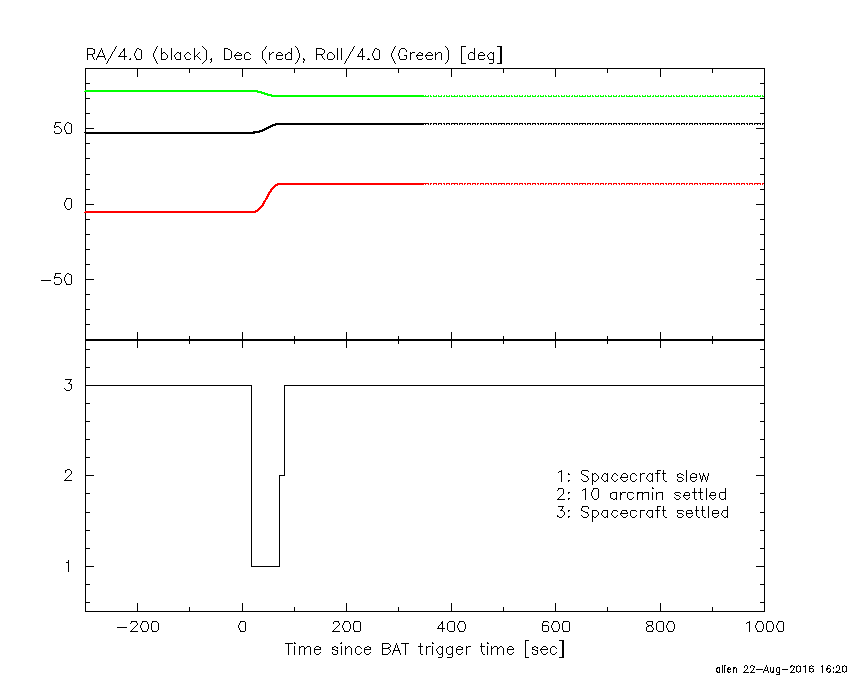
Spacecraft aspect plot
Bright source in the pre-burst/pre-slew/post-slew images
Pre-burst image of 15-350 keV band
Time interval of the image:
-239.168000 -1.344000

# RAcent  DECcent POSerr Theta    Phi  PeakCts   SNR AngSep     Name
#  [deg]    [deg]    ['] [deg]  [deg]                   [']
190.3568  51.3698    3.3  56.7  -29.4   4.3402   3.5 ------	UNKNOWN
Pre-slew background subtracted image of 15-350 keV band
Time interval of the image:
-1.344000 1.828000

# RAcent  DECcent POSerr Theta    Phi  PeakCts   SNR AngSep     Name
#  [deg]    [deg]    ['] [deg]  [deg]                   [']
200.5935 -52.3936    2.3  47.9  141.4   0.4645   5.0 ------	UNKNOWN
212.7663  13.4827    0.9  29.5   20.4   0.3242  13.5 ------	UNKNOWN
161.9596  28.2060    2.0  43.0  -67.0   0.4823   5.7 ------	UNKNOWN
Post-slew image of 15-350 keV band
Time interval of the image:
70.732600 962.965800

# RAcent  DECcent POSerr Theta    Phi  PeakCts   SNR AngSep     Name
#  [deg]    [deg]    ['] [deg]  [deg]                   [']
254.4988  35.4358    5.8  43.4   36.7   2.4963   2.0    6.0	Her X-1
239.9673  46.1150    2.8  39.8   14.2   3.2228   4.1 ------	UNKNOWN
212.0583 -25.6334    2.3  39.2  165.5   4.9441   5.0 ------	UNKNOWN
230.0749  43.5438    3.2  33.5    7.6   2.4277   3.7 ------	UNKNOWN
171.8633  12.9199    3.6  39.8 -101.4   7.5550   3.2 ------	UNKNOWN
Plot creation:
Mon Aug 22 16:21:47 EDT 2016