Estimated redshift from machine learning (Ukwatta et al. 2016) - may take a few minute to calcaulte
Image
Pre-slew 15.0-350.0 keV image (Event data)

#   RAcent    DECcent   POSerr    Theta     Phi              Peak Cts       SNR   Name
  221.6517    10.0018   0.0088    47.3747     7.9314         4.1905155     21.917 TRIG_00707231

Foreground time interval of the image:
 25.140  73.301 (delta_t =  48.161 [sec])
Background time interval of the image:
-239.000  25.140 (delta_t = 264.140 [sec])
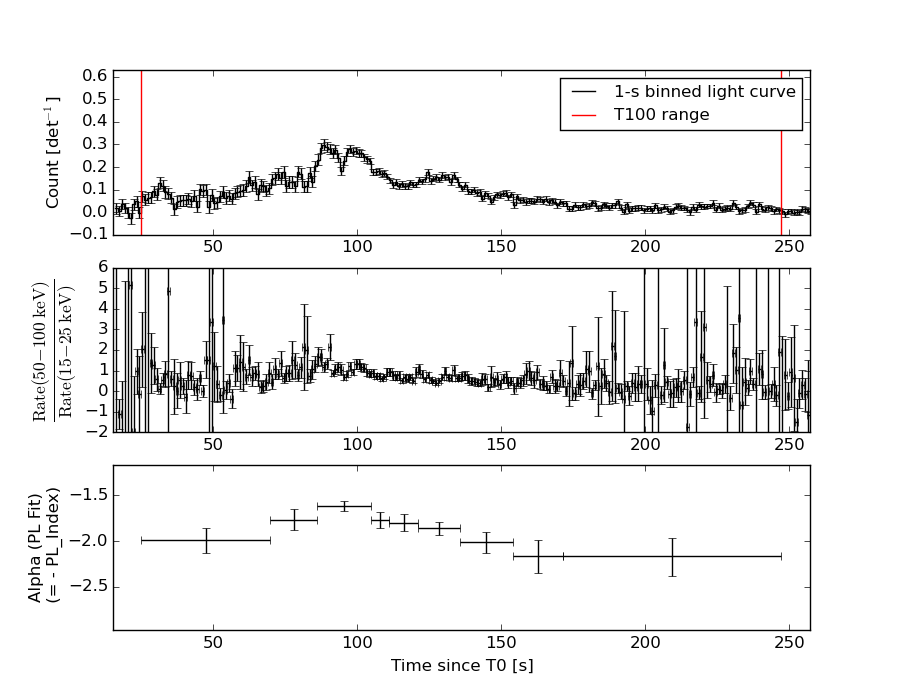
Lightcurves
Notes:
- 1) The mask-weighted light curves are using the flight position.
- 2) Multiple plots of different time binning/intervals are shown to cover all scenarios of short/long GRBs, rate/image triggers, and real/false positives.
- 3) For all the mask-weighted lightcurves, the y-axis units are counts/sec/det where a det is 0.4 x 0.4 = 0.16 sq cm.
- 4) The verticle lines correspond to following: green dotted lines are T50 interval, black dotted lines are T90 interval, blue solid line(s) is a spacecraft slew start time, and orange solid line(s) is a spacecraft slew end time.
- 5) Time of each bin is in the middle of the bin.
1 s binning
From T0-310 s to T0+310 s

From T100_start - 20 s to T100_end + 30 s
Full time interval
64 ms binning
Full time interval
From T100_start to T100_end

From T0-5 sec to T0+5 sec
16 ms binning
From T100_start-5 s to T100_start+5 s

8 ms binning
From T100_start-3 s to T100_start+3 s

2 ms binning
From T100_start-1 s to T100_start+1 s

SN=5 or 10 sec. binning (whichever binning is satisfied first)

SN=5 or 10 sec. binning (T < 200 sec)

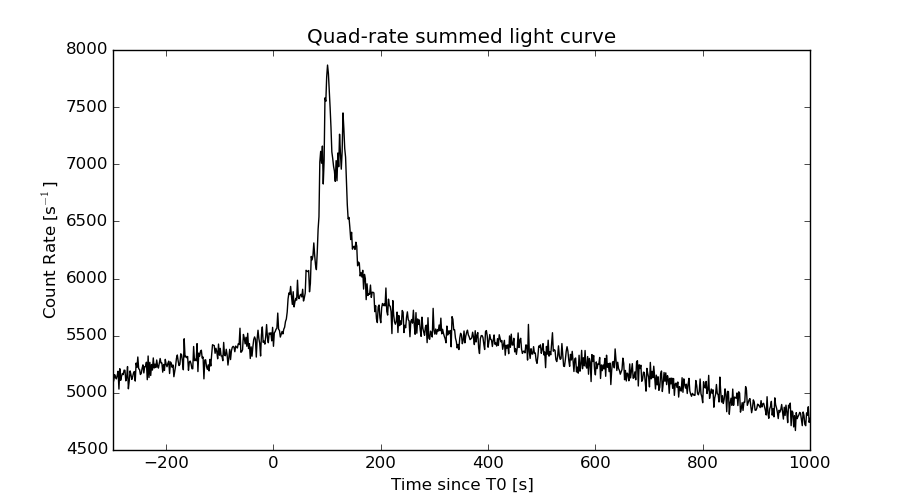
Quad-rate summed light curves (from T0-300s to T0+1000s)
Spectral Evolution
Spectra
Notes:
- 1) The fitting includes the systematic errors.
- 2) When the burst includes telescope slew time periods, the fitting uses an average response file made from multiple 5-s response files through out the slew time plus single time preiod for the non-slew times, and weighted by the total counts in the corresponding time period using addrmf. An average response file is needed becuase a spectral fit using the pre-slew DRM will introduce some errors in both a spectral shape and a normalization if the PHA file contains a lot of the slew/post-slew time interval.
- 3) For fits to more complicated models (e.g. a power-law over a cutoff power-law), the BAT team has decided to require a chi-square improvement of more than 6 for each extra dof.
Time averaged spectrum fit using the average DRM
Power-law model

Time interval is from   25.140 sec. to  247.148 sec.

Spectral model in power-law:
------------------------------------------------------------
Parameters  : value       lower 90%   higher 90%
Photon index: 1.87765     ( -0.0500786   0.0503738 )
Norm@50keV  : 5.55951E-03    ( -0.000147552   0.000147321 )
------------------------------------------------------------
#Fit statistic : Chi-Squared =          70.56 using 59 PHA bins.
# Reduced chi-squared =          1.238 for     57 degrees of freedom
# Null hypothesis probability =   1.070007e-01

Photon flux (15-150 keV)    in 222 sec: 0.790435 ( -0.023109  0.02321 ) ph/cm2/s
Energy fluence (15-150 keV)             : 1.13478e-05 ( -3.00877e-07  3.01276e-07 ) ergs/cm2
Cutoff power-law model

Time interval is from   25.140 sec. to  247.148 sec.
Spectral model in the cutoff power-law:
------------------------------------------------------------
Parameters  : value       lower 90%   higher 90%
Photon index: 1.41470     ( -0.222108   0.211593 )
Epeak [keV] : 64.2334      ( -7.20772 13.7869 )
Norm@50keV  : 9.33167E-03    ( -0.00192445   0.00257672 )
------------------------------------------------------------
#Fit statistic : Chi-Squared =          55.87 using 59 PHA bins.
# Reduced chi-squared =         0.9976 for     56 degrees of freedom
# Null hypothesis probability =   4.798245e-01

Photon flux (15-150 keV)    in 222 sec: 0.759942 ( -0.026338  0.026509 ) ph/cm2/s
Energy fluence (15-150 keV)             : 1.09266e-05 ( -3.53923e-07  3.53548e-07 ) ergs/cm2
Band function

Time interval is from   25.140 sec. to  247.148 sec.

Spectral model in the Band function:
------------------------------------------------------------
Parameters  : value       lower 90%   higher 90%
alpha       : -1.40589   ( -0.186244   1.02236 )
beta        : -2.53175    ( 2.53034   0.558933 )
Epeak [keV] : 63.7063      ( -24.5807 14.0436 )
Norm@50keV   : 9.43548E-03    ( -0.00199736   0.0309994 )
------------------------------------------------------------
#Fit statistic : Chi-Squared =          55.81 using 59 PHA bins.
# Reduced chi-squared =          1.015 for     55 degrees of freedom
# Null hypothesis probability =   4.441536e-01

Photon flux (15-150 keV)    in 222 sec: 0.759406 ( -0.029053  0.026653 ) ph/cm2/s
Energy fluence (15-150 keV)             : 1.09381e-05 ( -3.88591e-07  3.51337e-07 ) ergs/cm2
Single BB
Spectral model blackbody:
------------------------------------------------------------
Parameters  : value    Lower 90%  Upper 90%
kT [keV]    : 13.2428  (  )
R^2/D10^2   : 0.121814  (   )
(R is the radius in km and D10 is the distance to the source in units of 10 kpc)
------------------------------------------------------------
#Fit statistic : Chi-Squared =         328.95 using 59 PHA bins.
# Reduced chi-squared =         5.7710 for     57 degrees of freedom
# Null hypothesis probability =   6.805039e-40

Energy  Fluence     90% Error
[keV]   [erg/cm2]   [erg/cm2]
15- 25  1.005e-06   5.317e-08
25- 50  3.532e-06   1.132e-07
50-150  3.958e-06   2.031e-07
15-150  8.495e-06   2.287e-07
Thermal bremsstrahlung (OTTB)
Spectral model: thermal bremsstrahlung
------------------------------------------------------------
Parameters  : value         Lower 90%    Upper 90%
kT [keV]    : 97.8965       (-8.99022      10.5405)
Norm        : 3.40702       (-0.143579     0.152056)
------------------------------------------------------------
#Fit statistic : Chi-Squared =          56.53 using 59 PHA bins.
# Reduced chi-squared =         0.9917 for     57 degrees of freedom
# Null hypothesis probability =   4.927546e-01

Energy  Fluence     90% Error
[keV]   [erg/cm2]   [erg/cm2]
15- 25  1.977e-06   1.179e-07
25- 50  3.403e-06   1.299e-07
50-150  5.449e-06   1.279e-06
15-150  1.083e-05   1.267e-06
Double BB
Spectral model: bbodyrad<1> + bbodyrad<2>
------------------------------------------------------------
Parameters  : value         Lower 90%    Upper 90%
kT1 [keV]   : 6.76999        (-0.665553      0.699747)
R1^2/D10^2  : 0.995710        (-0.288812      0.459474)
kT2 [keV]   : 22.0573        (-1.9588      2.52079)
R2^2/D10^2  : 1.33575E-02    (-0.00475956   0.00632191)
------------------------------------------------------------
#Fit statistic : Chi-Squared =          62.53 using 59 PHA bins.
# Reduced chi-squared =          1.137 for     55 degrees of freedom
# Null hypothesis probability =   2.265172e-01

Energy  Fluence     90% Error
[keV]   [erg/cm2]   [erg/cm2]
15- 25  1.837e-06   1.759e-07
25- 50  3.426e-06   1.854e-07
50-150  5.429e-06   4.695e-07
15-150  1.069e-05   6.971e-07
Peak spectrum fit
Power-law model

Time interval is from   88.592 sec. to   89.592 sec.

Spectral model in power-law:
------------------------------------------------------------
Parameters  : value       lower 90%   higher 90%
Photon index: 1.66323     ( -0.18899   0.194558 )
Norm@50keV  : 2.16198E-02    ( -0.00258725   0.00256068 )
------------------------------------------------------------
#Fit statistic : Chi-Squared =          70.20 using 59 PHA bins.
# Reduced chi-squared =          1.232 for     57 degrees of freedom
# Null hypothesis probability =   1.125157e-01

Photon flux (15-150 keV)    in 1 sec: 2.83556 ( -0.32741  0.32794 ) ph/cm2/s
Energy fluence (15-150 keV)             : 2.0084e-07 ( -2.5169e-08  2.53691e-08 ) ergs/cm2
Cutoff power-law model

Time interval is from   88.592 sec. to   89.592 sec.
Spectral model in the cutoff power-law:
------------------------------------------------------------
Parameters  : value       lower 90%   higher 90%
Photon index: 1.10438     ( -0.881933   0.677773 )
Epeak [keV] : 78.9614      ( -31.241 -78.9614 )
Norm@50keV  : 4.20007E-02    ( -0.0220028   0.0758428 )
------------------------------------------------------------
#Fit statistic : Chi-Squared =          68.60 using 59 PHA bins.
# Reduced chi-squared =          1.225 for     56 degrees of freedom
# Null hypothesis probability =   1.203094e-01

Photon flux (15-150 keV)    in 1 sec: 2.78155 ( -0.3359  0.33597 ) ph/cm2/s
Energy fluence (15-150 keV)             : 1.9446e-07 ( -2.68731e-08  2.69055e-08 ) ergs/cm2
Band function
Time interval is from   88.592 sec. to   89.592 sec.

Spectral model in the Band function:
------------------------------------------------------------
Parameters  : value       lower 90%   higher 90%
alpha       : -1.12968   ( -0.492001   0.651512 )
beta        : -9.34901    ( 9.3699   19.3699 )
Epeak [keV] : 81.0034      ( -25.17 -80.9632 )
Norm@50keV   : 4.06219E-02    ( -0.0206254   0.014846 )
------------------------------------------------------------
#Fit statistic : Chi-Squared =          68.61 using 59 PHA bins.
# Reduced chi-squared =          1.247 for     55 degrees of freedom
# Null hypothesis probability =   1.027868e-01

Photon flux (15-150 keV)    in 1 sec: 2.78835 ( -0.31625  0.32417 ) ph/cm2/s
Energy fluence (15-150 keV)             : 2.0084e-07 ( -2.5169e-08  2.53691e-08 ) ergs/cm2
Single BB

Spectral model blackbody:
------------------------------------------------------------
Parameters  : value    Lower 90%  Upper 90%
kT [keV]    : 13.5871  (-1.81047  2.11856)
R^2/D10^2   : 0.451953  (-0.185032   0.307606)
(R is the radius in km and D10 is the distance to the source in units of 10 kpc)
------------------------------------------------------------
#Fit statistic : Chi-Squared =          85.05 using 59 PHA bins.
# Reduced chi-squared =          1.492 for     57 degrees of freedom
# Null hypothesis probability =   9.404969e-03

Energy  Fluence     90% Error
[keV]   [erg/cm2]   [erg/cm2]
15- 25  1.767e-08   3.780e-09
25- 50  6.374e-08   1.043e-08
50-150  7.627e-08   1.738e-08
15-150  1.577e-07   2.195e-08
Thermal bremsstrahlung (OTTB)

Spectral model: thermal bremsstrahlung
------------------------------------------------------------
Parameters  : value         Lower 90%    Upper 90%
kT [keV]    : 151.397       (-58.587      -149.849)
Norm        : 11.7235       (-1.46402     1.87329)
------------------------------------------------------------
#Fit statistic : Chi-Squared =          68.75 using 59 PHA bins.
# Reduced chi-squared =          1.206 for     57 degrees of freedom
# Null hypothesis probability =   1.368856e-01

Energy  Fluence     90% Error
[keV]   [erg/cm2]   [erg/cm2]
15- 25  3.009e-08   8.305e-09
25- 50  5.584e-08   1.916e-08
50-150  1.107e-07   6.382e-08
15-150  1.966e-07   9.288e-08
Double BB

Spectral model: bbodyrad<1> + bbodyrad<2>
------------------------------------------------------------
Parameters  : value         Lower 90%    Upper 90%
kT1 [keV]   : 6.90093        (-2.12685      2.58353)
R1^2/D10^2  : 3.22818        (-2.05462      8.65261)
kT2 [keV]   : 23.3995        (-5.97379      14.4598)
R2^2/D10^2  : 4.67898E-02    (-0.0388749   0.105093)
------------------------------------------------------------
#Fit statistic : Chi-Squared =          68.00 using 59 PHA bins.
# Reduced chi-squared =          1.236 for     55 degrees of freedom
# Null hypothesis probability =   1.120305e-01

Energy  Fluence     90% Error
[keV]   [erg/cm2]   [erg/cm2]
15- 25  2.893e-08   1.566e-08
25- 50  5.762e-08   2.936e-08
50-150  1.082e-07   5.760e-08
15-150  1.947e-07   9.872e-08
Pre-slew spectrum (Pre-slew PHA with pre-slew DRM)
Power-law model

Spectral model in power-law:
------------------------------------------------------------
Parameters  : value       lower 90%   higher 90%
Photon index: 1.97354     ( -0.121375   0.124992 )
Norm@50keV  : 5.72242E-03    ( -0.000442505   0.000437373 )
------------------------------------------------------------
#Fit statistic : Chi-Squared =          55.24 using 59 PHA bins.
# Reduced chi-squared =         0.9691 for     57 degrees of freedom
# Null hypothesis probability =   5.413800e-01

Photon flux (15-150 keV)    in 48.16 sec: 0.848088 ( -0.0590811  0.0591987 ) ph/cm2/s
Energy fluence (15-150 keV)             : 2.53833e-06 ( -1.88549e-07  1.89826e-07 ) ergs/cm2
Cutoff power-law model

Spectral model in the cutoff power-law:
------------------------------------------------------------
Parameters  : value       lower 90%   higher 90%
Photon index: 1.19879     ( -0.632367   0.547735 )
Epeak [keV] : 46.7987      ( -9.53275 13.8921 )
Norm@50keV  : 1.50489E-02    ( -0.00734896   0.0179653 )
------------------------------------------------------------
#Fit statistic : Chi-Squared =          49.13 using 59 PHA bins.
# Reduced chi-squared =         0.8773 for     56 degrees of freedom
# Null hypothesis probability =   7.304076e-01

Photon flux (15-150 keV)    in 48.16 sec: 0.817477 ( -0.062705  0.062766 ) ph/cm2/s
Energy fluence (15-150 keV)             : 2.39145e-06 ( -2.12554e-07  2.15261e-07 ) ergs/cm2
Band function

Spectral model in the Band function:
------------------------------------------------------------
Parameters  : value       lower 90%   higher 90%
alpha       : -0.894537   ( -0.757734   1.43083 )
beta        : -2.48875    ( 2.48978   0.413692 )
Epeak [keV] : 42.9242      ( -11.2957 13.6936 )
Norm@50keV   : 2.32374E-02    ( -0.00747771   0.208241 )
------------------------------------------------------------
#Fit statistic : Chi-Squared =          48.22 using 59 PHA bins.
# Reduced chi-squared =         0.8768 for     55 degrees of freedom
# Null hypothesis probability =   7.292452e-01

Photon flux (15-150 keV)    in 48.16 sec: 0.814439 ( -0.062651  0.062895 ) ph/cm2/s
Energy fluence (15-150 keV)             : 2.1567e-15 ( 0  0 ) ergs/cm2
S(25-50 keV) vs. S(50-100 keV) plot
S(25-50 keV)  = 3.29e-06
S(50-100 keV) = 3.57e-06
T90 vs. Hardness ratio plot
T90                                   = 152.743999958038 sec.
Hardness ratio (energy fluence ratio) = 1.08511
Color vs. Color plot

Count Ratio  (25-50 keV) / (15-25 keV) = 1.23573
Count Ratio (50-100 keV) / (15-25 keV) = 0.759506
Mask shadow pattern

IMX = 1.076134540255951E+00, IMY = -1.499279680944308E-01
TIME vs. PHA plot around the trigger time

TIME vs. DetID plot around the trigger time
100 us light curve (15-350 keV)
Spacecraft aspect plot

Bright source in the pre-burst/pre-slew/post-slew images
Pre-burst image of 15-350 keV band
Time interval of the image:
-239.000000 25.140000

# RAcent  DECcent POSerr Theta    Phi  PeakCts   SNR AngSep     Name
#  [deg]    [deg]    ['] [deg]  [deg]                   [']
170.2230 -60.7863   26.6  34.2 -167.3   0.1315   0.4   10.2	Cen X-3
186.4121 -62.7100    3.9  30.5  179.7   0.8832   3.0    7.6	GX 301-2
244.9946 -15.6392    0.8  41.3   57.5  14.3566  14.4    0.9	Sco X-1
229.3222  10.0490    2.6  50.5   17.1   3.3226   4.4 ------	UNKNOWN
132.1176 -48.1912    2.5  53.7 -144.3   7.3125   4.6 ------	UNKNOWN
181.8078  11.7370    2.9  50.6  -44.6   5.2453   3.9 ------	UNKNOWN
173.0762  -1.4844    2.6  43.6  -64.1   4.9762   4.4 ------	UNKNOWN
153.4070 -28.3513    2.5  43.1 -112.6   5.1620   4.6 ------	UNKNOWN
Pre-slew background subtracted image of 15-350 keV band
Time interval of the image:
25.140000 73.300590

# RAcent  DECcent POSerr Theta    Phi  PeakCts   SNR AngSep     Name
#  [deg]    [deg]    ['] [deg]  [deg]                   [']
170.3178 -60.6218   47.7  34.1 -167.1  -0.0272  -0.2    0.1	Cen X-3
186.8245 -62.8971    6.8  30.5  179.2  -0.1787  -1.7    8.9	GX 301-2
244.9016 -15.5073    4.1  41.3   57.2   0.9400   2.8    9.2	Sco X-1
245.4948 -28.9040    2.3  35.6   76.9   1.0089   5.1 ------	UNKNOWN
221.6517  10.0018    0.5  47.4    7.9   4.1908  21.9 ------	UNKNOWN
112.6839 -77.1742    2.2  57.0  179.2   2.7195   5.1 ------	UNKNOWN
Post-slew image of 15-350 keV band
Time interval of the image:
136.500590 838.953600
841.000000 963.160000

# RAcent  DECcent POSerr Theta    Phi  PeakCts   SNR AngSep     Name
#  [deg]    [deg]    ['] [deg]  [deg]                   [']
244.9831 -15.6489    0.4  34.6  121.4  44.4238  28.5    0.6	Sco X-1
254.4154  35.4031    4.7  39.2   28.1   2.8130   2.4    4.2	Her X-1
269.9377  34.8153    3.3  50.4   36.4  12.0966   3.5 ------	UNKNOWN
247.4134 -23.2847    2.7  41.8  126.9  11.1393   4.2 ------	UNKNOWN
223.4599 -17.6320    2.6  27.7  160.0   3.5334   4.4 ------	UNKNOWN
218.2703 -21.9598    3.5  32.1  169.6   3.0250   3.3 ------	UNKNOWN
221.6574  10.0170    1.6   0.0   63.9   4.9501   7.3 ------	UNKNOWN
215.5740  -2.6995    3.2  14.1 -170.6   2.6798   3.6 ------	UNKNOWN
238.1401  63.9575    3.2  55.2   -7.5   8.1949   3.6 ------	UNKNOWN
183.3188  40.3897    3.4  45.5  -57.7  14.5454   3.4 ------	UNKNOWN
Plot creation:
Mon Aug 22 16:20:06 EDT 2016