Special notes of this burst
Image
Pre-slew 15.0-350.0 keV image (Event data)

#   RAcent    DECcent   POSerr    Theta     Phi              Peak Cts       SNR   Name
  280.0036    62.3870   0.0105    22.5632    28.8066         0.2138426     18.157 TRIG_00709357

Foreground time interval of the image:
  0.000   0.536 (delta_t =   0.536 [sec])
Background time interval of the image:
-239.048   0.000 (delta_t = 239.048 [sec])
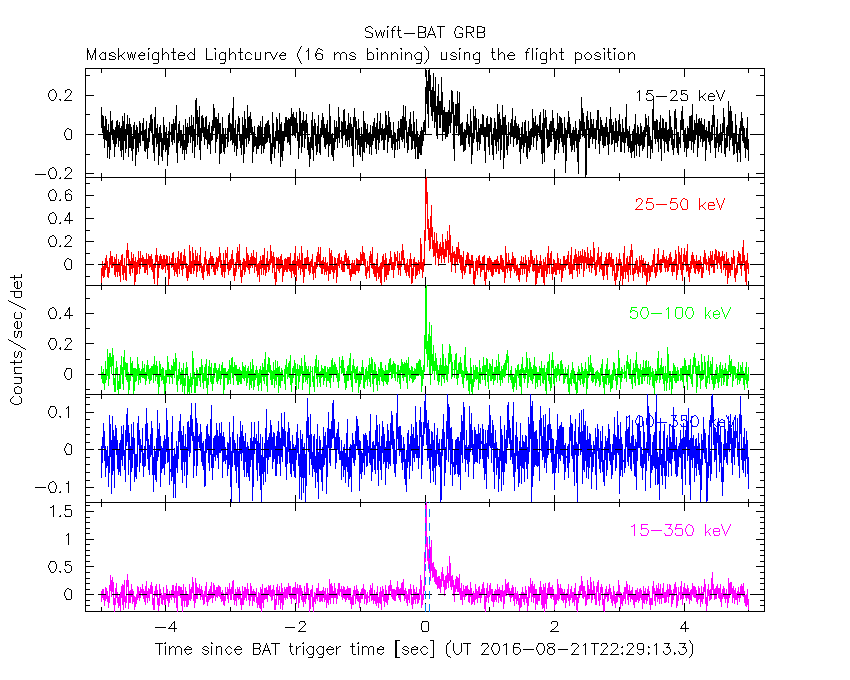
Lightcurves
Notes:
- 1) The mask-weighted light curves are using the flight position.
- 2) Multiple plots of different time binning/intervals are shown to cover all scenarios of short/long GRBs, rate/image triggers, and real/false positives.
- 3) For all the mask-weighted lightcurves, the y-axis units are counts/sec/det where a det is 0.4 x 0.4 = 0.16 sq cm.
- 4) The verticle lines correspond to following: green dotted lines are T50 interval, black dotted lines are T90 interval, blue solid line(s) is a spacecraft slew start time, and orange solid line(s) is a spacecraft slew end time.
- 5) Time of each bin is in the middle of the bin.
1 s binning
From T0-310 s to T0+310 s

From T100_start - 20 s to T100_end + 30 s

Full time interval

64 ms binning
Full time interval

From T100_start to T100_end

From T0-5 sec to T0+5 sec

16 ms binning
From T100_start-5 s to T100_start+5 s
Blue+Cyan dotted lines: Time interval of the scaled map
From 0.000000 to 0.064000
8 ms binning
From T100_start-3 s to T100_start+3 s
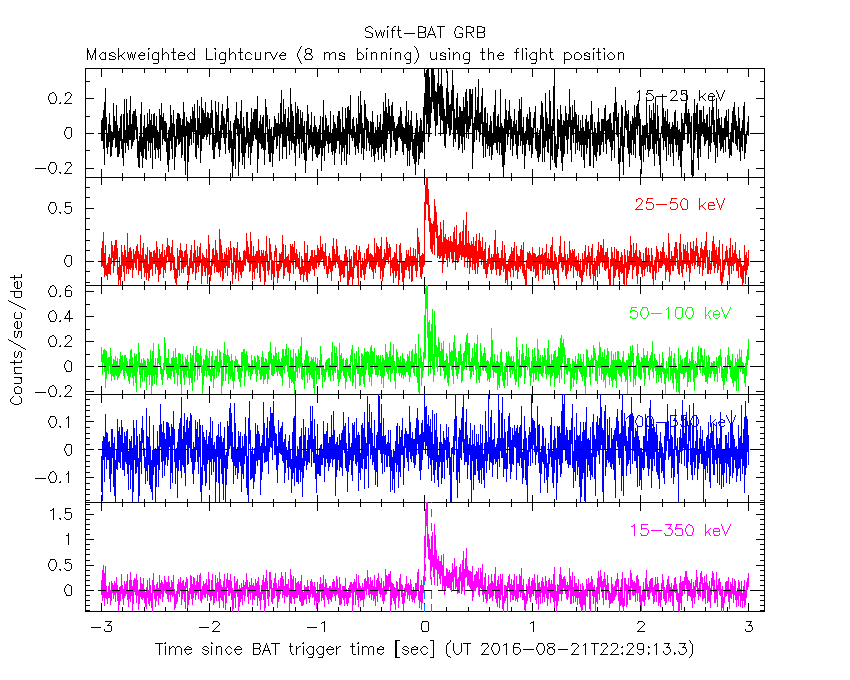
Blue+Cyan dotted lines: Time interval of the scaled map
From 0.000000 to 0.064000
2 ms binning
From T100_start-1 s to T100_start+1 s
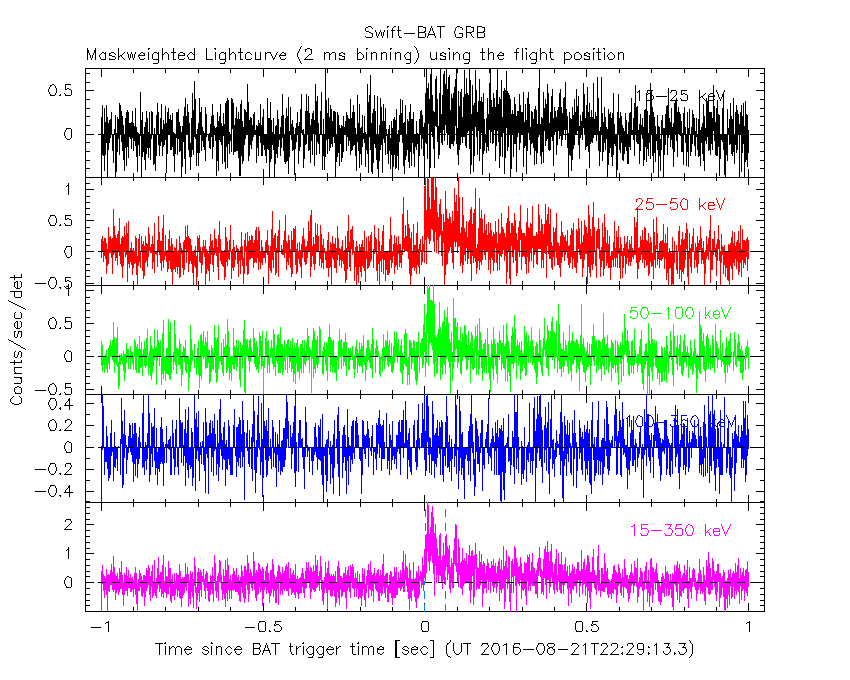
Blue+Cyan dotted lines: Time interval of the scaled map
From 0.000000 to 0.064000
SN=5 or 10 sec. binning (whichever binning is satisfied first)

SN=5 or 10 sec. binning (T < 200 sec)

Quad-rate summed light curves (from T0-300s to T0+1000s)

Spectral Evolution

Spectra
Notes:
- 1) The fitting includes the systematic errors.
- 2) When the burst includes telescope slew time periods, the fitting uses an average response file made from multiple 5-s response files through out the slew time plus single time preiod for the non-slew times, and weighted by the total counts in the corresponding time period using addrmf. An average response file is needed becuase a spectral fit using the pre-slew DRM will introduce some errors in both a spectral shape and a normalization if the PHA file contains a lot of the slew/post-slew time interval.
- 3) For fits to more complicated models (e.g. a power-law over a cutoff power-law), the BAT team has decided to require a chi-square improvement of more than 6 for each extra dof.
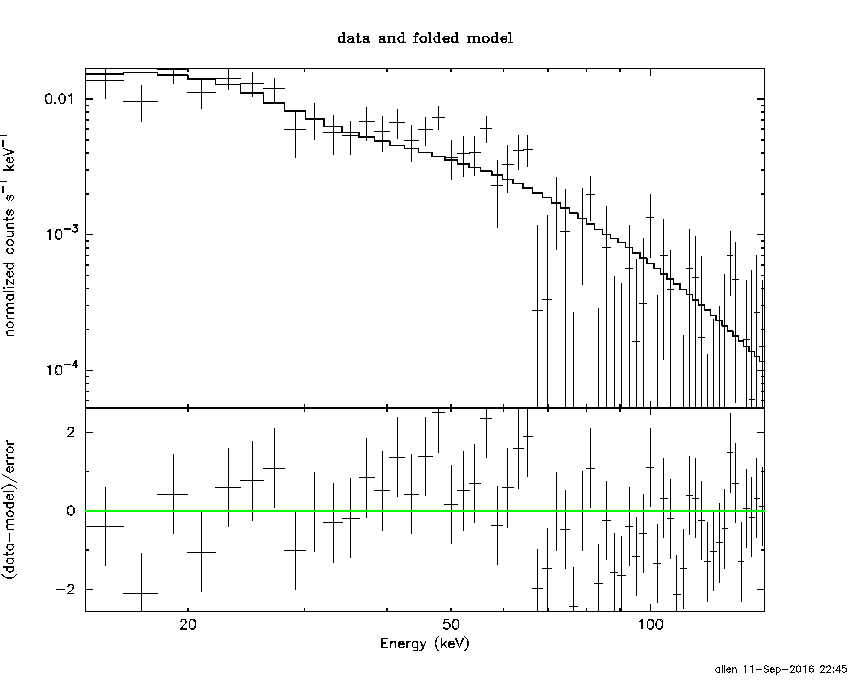
Time averaged spectrum fit using the average DRM
Power-law model

Time interval is from    0.000 sec. to    0.536 sec.

Spectral model in power-law:
------------------------------------------------------------
Parameters  : value       lower 90%   higher 90%
Photon index: 1.87936     ( -0.146024   0.152004 )
Norm@50keV  : 2.33673E-02    ( -0.00244687   0.00241401 )
------------------------------------------------------------
#Fit statistic : Chi-Squared =          75.30 using 59 PHA bins.
# Reduced chi-squared =          1.321 for     57 degrees of freedom
# Null hypothesis probability =   5.263330e-02

Photon flux (15-150 keV)    in 0.536 sec: 3.32465 ( -0.29741  0.2975 ) ph/cm2/s
Energy fluence (15-150 keV)             : 1.15158e-07 ( -1.18997e-08  1.20384e-08 ) ergs/cm2
Cutoff power-law model

Time interval is from    0.000 sec. to    0.536 sec.
Spectral model in the cutoff power-law:
------------------------------------------------------------
Parameters  : value       lower 90%   higher 90%
Photon index: 0.120241     ( -0.958008   0.809352 )
Epeak [keV] : 46.3175      ( -5.38246 7.47887 )
Norm@50keV  : 0.226702    ( -0.226769   0.546801 )
------------------------------------------------------------
#Fit statistic : Chi-Squared =          59.05 using 59 PHA bins.
# Reduced chi-squared =          1.054 for     56 degrees of freedom
# Null hypothesis probability =   3.647848e-01

Photon flux (15-150 keV)    in 0.536 sec:  (    ) ph/cm2/s
Energy fluence (15-150 keV)             : 1.02961e-07 ( -1.15553e-08  1.23189e-08 ) ergs/cm2
Band function

Time interval is from    0.000 sec. to    0.536 sec.


Spectral model in the Band function:
------------------------------------------------------------
Parameters  : value       lower 90%   higher 90%
alpha       :    (     )
beta        :     (     )
Epeak [keV] :       (   )
Norm@50keV   :     (     )
------------------------------------------------------------

Photon flux (15-150 keV)    in  sec:  (    ) ph/cm2/s
Energy fluence (15-150 keV)             : 0 ( 0  0 ) ergs/cm2
Single BB

Spectral model blackbody:
------------------------------------------------------------
Parameters  : value    Lower 90%  Upper 90%
kT [keV]    : 11.4175  (-0.959166  1.04507)
R^2/D10^2   : 1.02311  (-0.289675   0.400131)
(R is the radius in km and D10 is the distance to the source in units of 10 kpc)
------------------------------------------------------------
#Fit statistic : Chi-Squared =          65.96 using 59 PHA bins.
# Reduced chi-squared =          1.157 for     57 degrees of freedom
# Null hypothesis probability =   1.947282e-01

Energy  Fluence     90% Error
[keV]   [erg/cm2]   [erg/cm2]
15- 25  1.503e-08   2.358e-09
25- 50  4.456e-08   4.974e-09
50-150  3.373e-08   7.003e-09
15-150  9.332e-08   9.273e-09
Thermal bremsstrahlung (OTTB)
Spectral model: thermal bremsstrahlung
------------------------------------------------------------
Parameters  : value         Lower 90%    Upper 90%
kT [keV]    : 78.9425       (-18.0985      27.6826)
Norm        : 16.0021       (-1.96139     2.24336)
------------------------------------------------------------
#Fit statistic : Chi-Squared =          65.29 using 59 PHA bins.
# Reduced chi-squared =          1.145 for     57 degrees of freedom
# Null hypothesis probability =   2.108362e-01

Energy  Fluence     90% Error
[keV]   [erg/cm2]   [erg/cm2]
15- 25  2.224e-08   2.726e-09
25- 50  3.649e-08   3.524e-09
50-150  5.105e-08   1.464e-08
15-150  1.098e-07   1.726e-08
Double BB

Spectral model: bbodyrad<1> + bbodyrad<2>
------------------------------------------------------------
Parameters  : value         Lower 90%    Upper 90%
kT1 [keV]   : 3.91006        (-1.74907      2.46227)
R1^2/D10^2  : 21.3326        (-17.9819      496.169)
kT2 [keV]   : 13.1628        (-1.58467      2.34318)
R2^2/D10^2  : 0.534027    (-0.284938   0.37987)
------------------------------------------------------------
#Fit statistic : Chi-Squared =          56.74 using 59 PHA bins.
# Reduced chi-squared =          1.032 for     55 degrees of freedom
# Null hypothesis probability =   4.098757e-01

Energy  Fluence     90% Error
[keV]   [erg/cm2]   [erg/cm2]
15- 25  1.982e-08   8.509e-09
25- 50  3.985e-08   1.234e-08
50-150  4.053e-08   1.349e-08
15-150  1.002e-07   2.704e-08
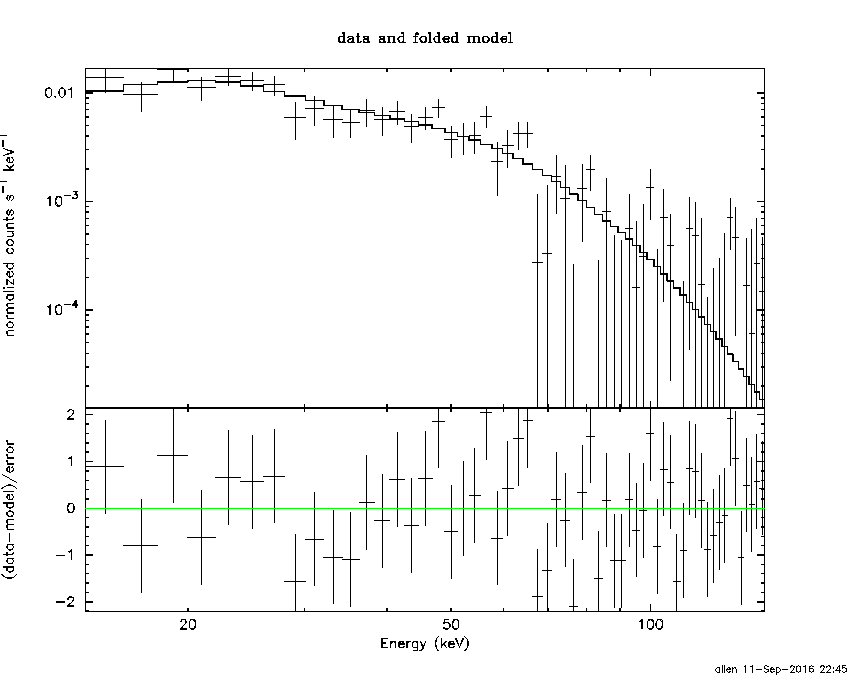
Peak spectrum fit
Power-law model

Time interval is from   -0.230 sec. to    0.770 sec.

Spectral model in power-law:
------------------------------------------------------------
Parameters  : value       lower 90%   higher 90%
Photon index: 1.77986     ( -0.175744   0.182947 )
Norm@50keV  : 1.29257E-02    ( -0.00158055   0.00155826 )
------------------------------------------------------------
#Fit statistic : Chi-Squared =          67.00 using 59 PHA bins.
# Reduced chi-squared =          1.175 for     57 degrees of freedom
# Null hypothesis probability =   1.714841e-01

Photon flux (15-150 keV)    in 1 sec: 1.76749 ( -0.19107  0.19116 ) ph/cm2/s
Energy fluence (15-150 keV)             : 1.1911e-07 ( -1.47966e-08  1.49996e-08 ) ergs/cm2
Cutoff power-law model

Time interval is from   -0.230 sec. to    0.770 sec.
Spectral model in the cutoff power-law:
------------------------------------------------------------
Parameters  : value       lower 90%   higher 90%
Photon index: 0.162224     ( -1.13787   0.92606 )
Epeak [keV] : 50.9773      ( -7.43787 13.6043 )
Norm@50keV  : 9.91236E-02    ( -0.0991538   0.308181 )
------------------------------------------------------------
#Fit statistic : Chi-Squared =          56.97 using 59 PHA bins.
# Reduced chi-squared =          1.017 for     56 degrees of freedom
# Null hypothesis probability =   4.388883e-01

Photon flux (15-150 keV)    in 1 sec: 1.68375 ( -0.1967  0.19689 ) ph/cm2/s
Energy fluence (15-150 keV)             : 1.06987e-07 ( -1.4681e-08  1.57456e-08 ) ergs/cm2
Band function

Time interval is from   -0.230 sec. to    0.770 sec.


Spectral model in the Band function:
------------------------------------------------------------
Parameters  : value       lower 90%   higher 90%
alpha       :    (     )
beta        :     (     )
Epeak [keV] :       (   )
Norm@50keV   :     (     )
------------------------------------------------------------

Photon flux (15-150 keV)    in  sec:  (    ) ph/cm2/s
Energy fluence (15-150 keV)             : 0 ( 0  0 ) ergs/cm2
Single BB

Spectral model blackbody:
------------------------------------------------------------
Parameters  : value    Lower 90%  Upper 90%
kT [keV]    : 12.2324  (-1.2631  1.41529)
R^2/D10^2   : 0.423554  (-0.142171   0.210423)
(R is the radius in km and D10 is the distance to the source in units of 10 kpc)
------------------------------------------------------------
#Fit statistic : Chi-Squared =          62.07 using 59 PHA bins.
# Reduced chi-squared =          1.089 for     57 degrees of freedom
# Null hypothesis probability =   3.001779e-01

Energy  Fluence     90% Error
[keV]   [erg/cm2]   [erg/cm2]
15- 25  1.342e-08   2.500e-09
25- 50  4.320e-08   5.900e-09
50-150  3.936e-08   9.450e-09
15-150  9.598e-08   1.162e-08
Thermal bremsstrahlung (OTTB)

Spectral model: thermal bremsstrahlung
------------------------------------------------------------
Parameters  : value         Lower 90%    Upper 90%
kT [keV]    : 96.7664       (-28.4098      52.4452)
Norm        : 8.00824       (-1.09605     1.28566)
------------------------------------------------------------
#Fit statistic : Chi-Squared =          61.20 using 59 PHA bins.
# Reduced chi-squared =          1.074 for     57 degrees of freedom
# Null hypothesis probability =   3.277387e-01

Energy  Fluence     90% Error
[keV]   [erg/cm2]   [erg/cm2]
15- 25  2.093e-08   3.260e-09
25- 50  3.594e-08   4.575e-09
50-150  5.716e-08   2.365e-08
15-150  1.140e-07   2.760e-08
Double BB

Spectral model: bbodyrad<1> + bbodyrad<2>
------------------------------------------------------------
Parameters  : value         Lower 90%    Upper 90%
kT1 [keV]   : 3.87897        (-3.52324      3.08561)
R1^2/D10^2  : 11.6608        (-10.5079      74.3542)
kT2 [keV]   : 14.0922        (-1.99095      3.02966)
R2^2/D10^2  : 0.226343    (-0.13254   0.174901)
------------------------------------------------------------
#Fit statistic : Chi-Squared =          54.96 using 59 PHA bins.
# Reduced chi-squared =         0.9993 for     55 degrees of freedom
# Null hypothesis probability =   4.761769e-01

Energy  Fluence     90% Error
[keV]   [erg/cm2]   [erg/cm2]
15- 25  1.861e-08   8.215e-09
25- 50  3.854e-08   1.227e-08
50-150  4.664e-08   1.905e-08
15-150  1.038e-07   3.257e-08
Pre-slew spectrum (Pre-slew PHA with pre-slew DRM)
Power-law model
Spectral model in power-law:
------------------------------------------------------------
Parameters  : value       lower 90%   higher 90%
Photon index: 1.87936     ( -0.146024   0.152004 )
Norm@50keV  : 2.33673E-02    ( -0.00244687   0.00241401 )
------------------------------------------------------------
#Fit statistic : Chi-Squared =          75.30 using 59 PHA bins.
# Reduced chi-squared =          1.321 for     57 degrees of freedom
# Null hypothesis probability =   5.263330e-02

Photon flux (15-150 keV)    in 0.536 sec: 3.32445 ( -0.297388  0.297476 ) ph/cm2/s
Energy fluence (15-150 keV)             : 1.15139e-07 ( -1.18965e-08  1.20412e-08 ) ergs/cm2
Cutoff power-law model
Spectral model in the cutoff power-law:
------------------------------------------------------------
Parameters  : value       lower 90%   higher 90%
Photon index: 0.120019     ( -0.957951   0.809407 )
Epeak [keV] : 46.3172      ( -5.38244 7.47891 )
Norm@50keV  : 0.226764    ( -0.22677   0.546801 )
------------------------------------------------------------
#Fit statistic : Chi-Squared =          59.05 using 59 PHA bins.
# Reduced chi-squared =          1.054 for     56 degrees of freedom
# Null hypothesis probability =   3.647848e-01

Photon flux (15-150 keV)    in 0.536 sec: 3.17712 ( -0.30292  0.30384 ) ph/cm2/s
Energy fluence (15-150 keV)             : 1.0299e-07 ( -1.1569e-08  1.23076e-08 ) ergs/cm2
Band function

Spectral model in the Band function:
------------------------------------------------------------
Parameters  : value       lower 90%   higher 90%
alpha       :    (     )
beta        :     (     )
Epeak [keV] :       (   )
Norm@50keV   :     (     )
------------------------------------------------------------

Photon flux (15-150 keV)    in  sec:  (    ) ph/cm2/s
Energy fluence (15-150 keV)             : 0 ( 0  0 ) ergs/cm2
S(25-50 keV) vs. S(50-100 keV) plot
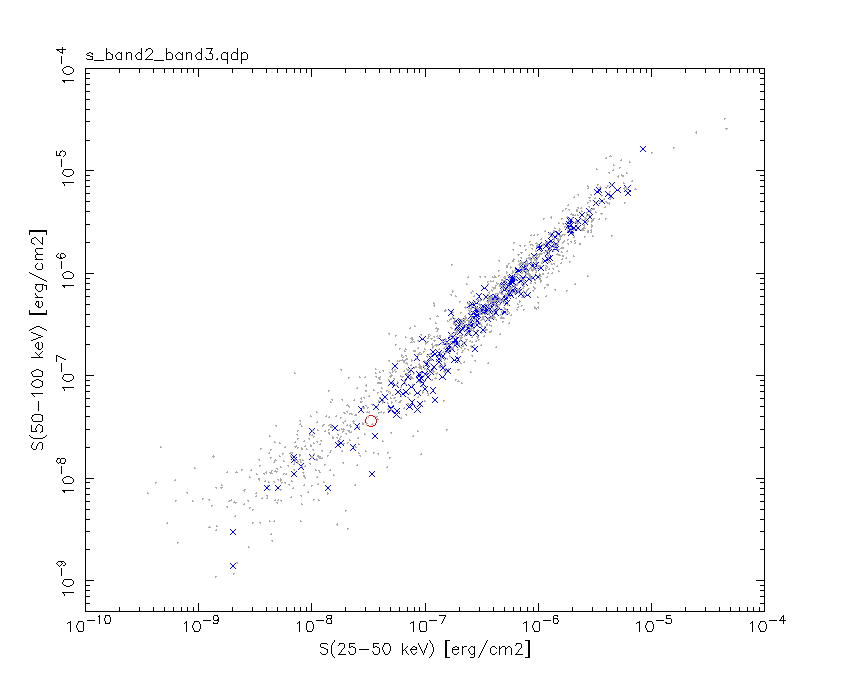
S(25-50 keV)  = 3.33e-08
S(50-100 keV) = 3.63e-08
T90 vs. Hardness ratio plot
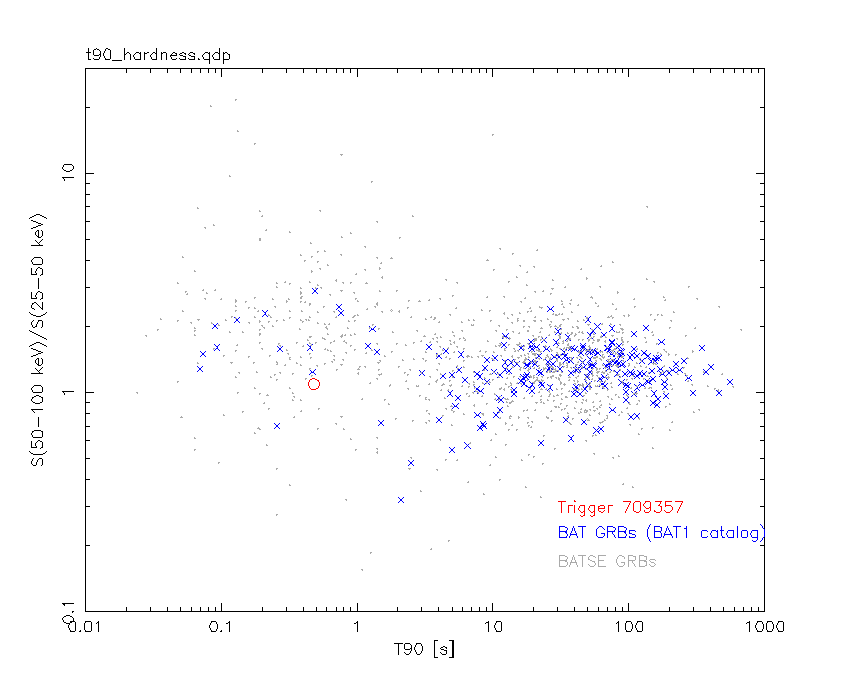
T90                                   = 0.479999959468842 sec.
Hardness ratio (energy fluence ratio) = 1.09009
Color vs. Color plot

Count Ratio  (25-50 keV) / (15-25 keV) = 1.44647
Count Ratio (50-100 keV) / (15-25 keV) = 0.660523
Mask shadow pattern

IMX = 3.640871868642091E-01, IMY = -2.002134305618259E-01
TIME vs. PHA plot around the trigger time

Blue+Cyan dotted lines: Time interval of the scaled map
From 0.000000 to 0.064000
TIME vs. DetID plot around the trigger time

Blue+Cyan dotted lines: Time interval of the scaled map
From 0.000000 to 0.064000
100 us light curve (15-350 keV)
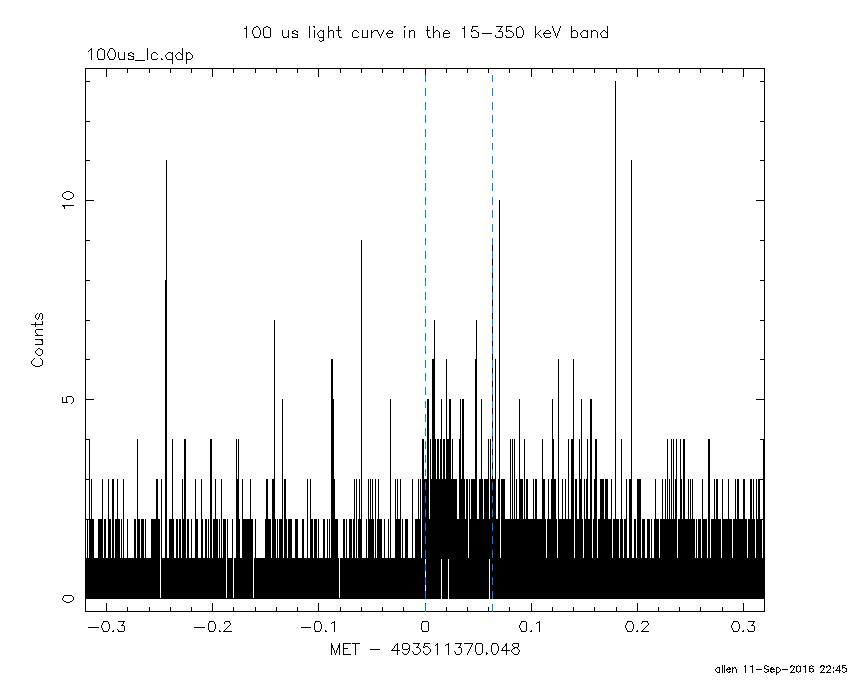
Blue+Cyan dotted lines: Time interval of the scaled map
From 0.000000 to 0.064000
Spacecraft aspect plot
Bright source in the pre-burst/pre-slew/post-slew images
Pre-burst image of 15-350 keV band
Time interval of the image:
-239.048000 0.000000

# RAcent  DECcent POSerr Theta    Phi  PeakCts   SNR AngSep     Name
#  [deg]    [deg]    ['] [deg]  [deg]                   [']
254.5026  35.3658    1.2  17.9  130.9   2.4336   9.5    2.6	Her X-1
183.5470  60.0519    3.3  33.5  -69.0   1.4736   3.5 ------	UNKNOWN
 83.4684  68.9505    2.9  58.8  -26.0   6.2907   4.0 ------	UNKNOWN
188.2681  36.1237    3.1  41.4 -107.1   4.3236   3.8 ------	UNKNOWN
131.3224  67.7338    3.5  50.6  -44.7   4.7991   3.3 ------	UNKNOWN
Pre-slew background subtracted image of 15-350 keV band
Time interval of the image:
0.000000 0.536000

# RAcent  DECcent POSerr Theta    Phi  PeakCts   SNR AngSep     Name
#  [deg]    [deg]    ['] [deg]  [deg]                   [']
254.4910  35.3152   12.0  18.0  131.0  -0.0121  -1.0    2.3	Her X-1
280.0036  62.3870    0.6  22.6   28.8   0.2139  18.2 ------	UNKNOWN
226.8019   3.4568    2.2  49.8 -176.1   0.1391   5.3 ------	UNKNOWN
Post-slew image of 15-350 keV band
Time interval of the image:
54.652600 723.052000

# RAcent  DECcent POSerr Theta    Phi  PeakCts   SNR AngSep     Name
#  [deg]    [deg]    ['] [deg]  [deg]                   [']
254.4684  35.3586    0.9  31.4 -177.1   4.1882  12.6    1.1	Her X-1
299.6024  35.1898    0.6  29.9  107.0  10.7933  20.1    0.9	Cyg X-1
308.0372  41.0191    3.3  27.1   89.3   1.6157   3.6    5.2	Cyg X-3
326.0460  38.1499    9.3  36.9   69.7   0.9626   1.2   11.9	Cyg X-2
323.9125  49.7196    2.7  26.9   58.0   1.7388   4.3 ------	UNKNOWN
 11.8191  50.3406    2.5  47.7   20.0   3.5185   4.5 ------	UNKNOWN
  7.9284  58.9267    2.3  39.9   14.1   2.4270   5.0 ------	UNKNOWN
238.5063  18.9485    3.2  52.0 -166.9   3.2435   3.5 ------	UNKNOWN
 62.7588  54.5537    2.8  59.5  -15.5   9.8578   4.1 ------	UNKNOWN
Plot creation:
Sun Sep 11 22:45:51 EDT 2016