Estimated redshift from machine learning (Ukwatta et al. 2016) - may take a few minute to calcaulte
Image
Pre-slew 15.0-350.0 keV image (Event data)
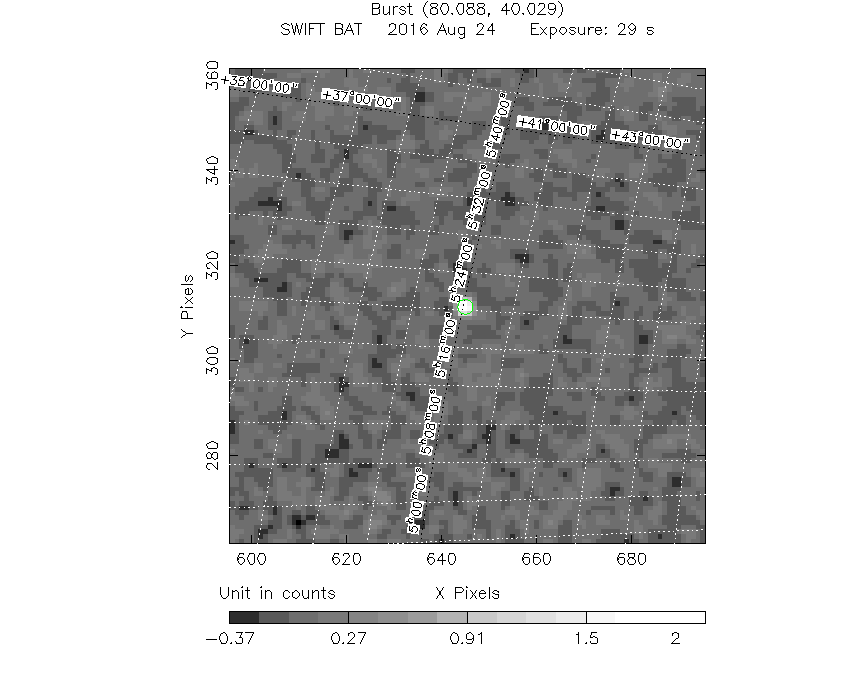
#   RAcent    DECcent   POSerr    Theta     Phi              Peak Cts       SNR   Name
   80.0869    40.0390   0.0081    31.0893    35.1676         2.3456540     23.856 TRIG_00709765

Foreground time interval of the image:
 -0.660  28.789 (delta_t =  29.449 [sec])
Background time interval of the image:
-146.811  -0.660 (delta_t = 146.151 [sec])
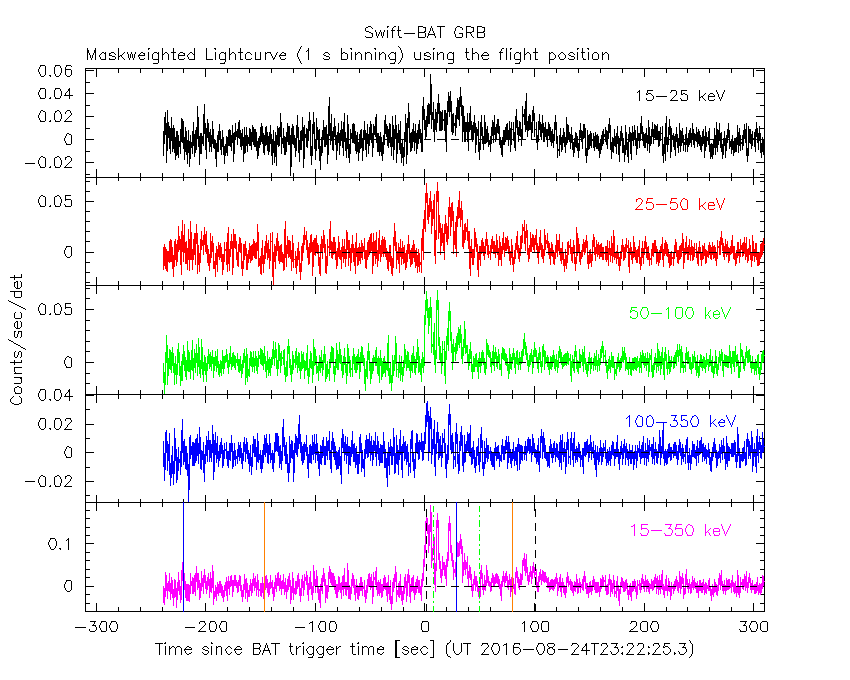
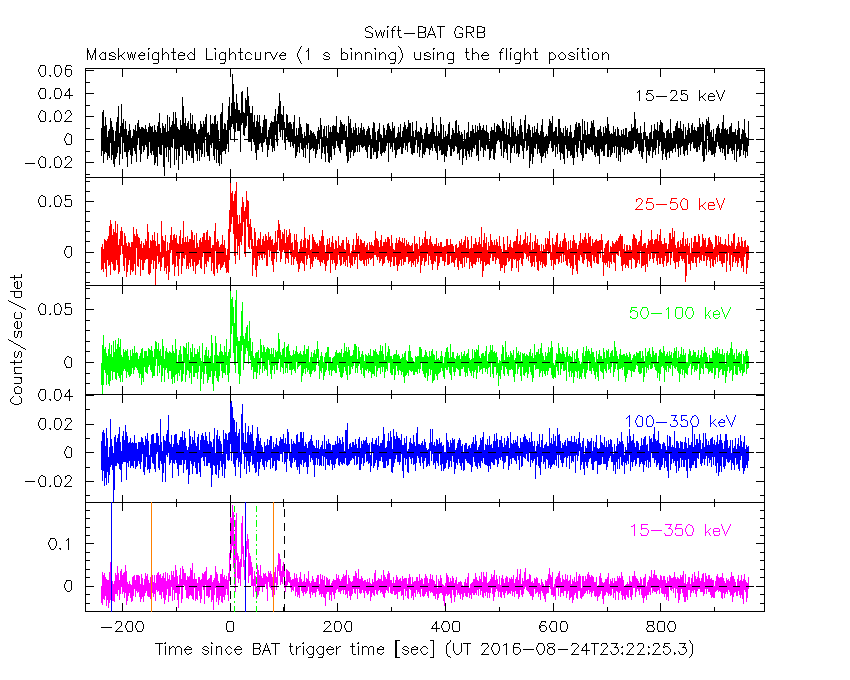
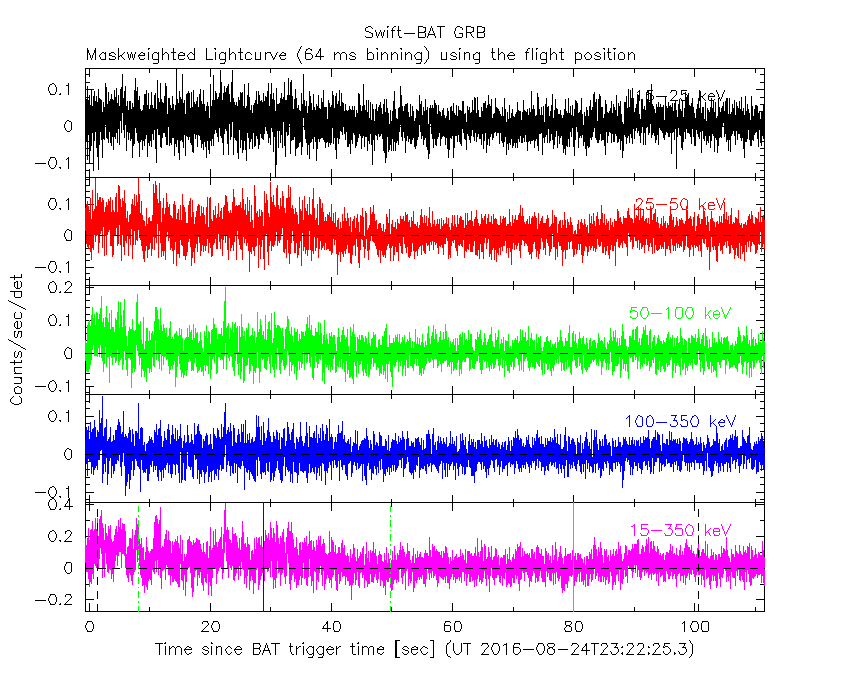
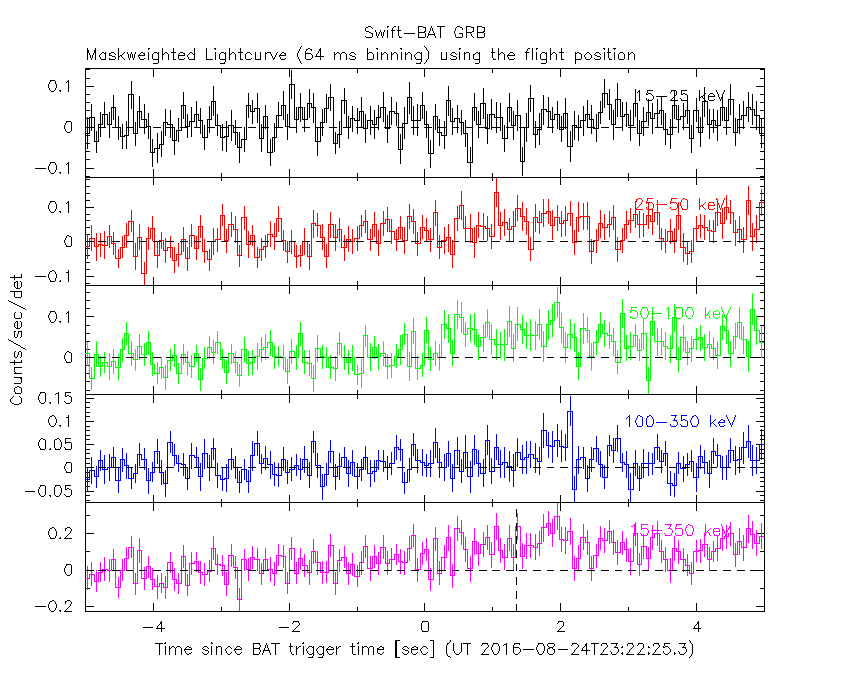
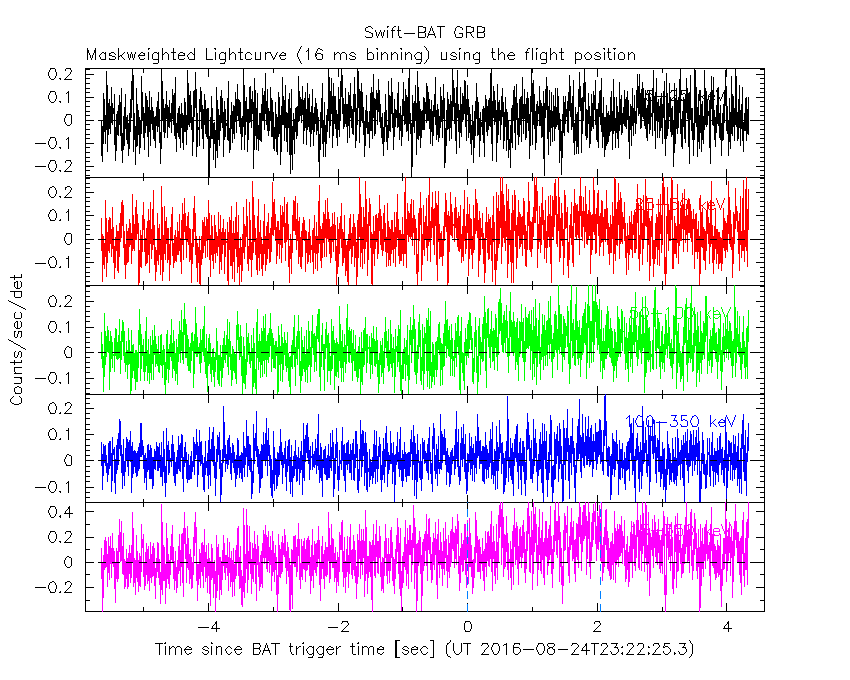
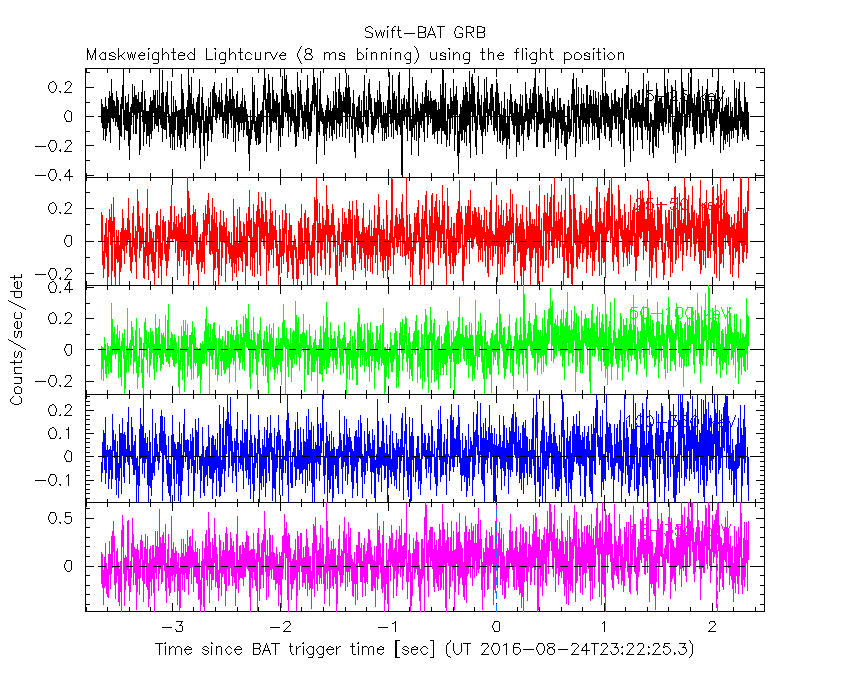
Lightcurves
Notes:
- 1) The mask-weighted light curves are using the flight position.
- 2) Multiple plots of different time binning/intervals are shown to cover all scenarios of short/long GRBs, rate/image triggers, and real/false positives.
- 3) For all the mask-weighted lightcurves, the y-axis units are counts/sec/det where a det is 0.4 x 0.4 = 0.16 sq cm.
- 4) The verticle lines correspond to following: green dotted lines are T50 interval, black dotted lines are T90 interval, blue solid line(s) is a spacecraft slew start time, and orange solid line(s) is a spacecraft slew end time.
- 5) Time of each bin is in the middle of the bin.
1 s binning
From T0-310 s to T0+310 s
From T100_start - 20 s to T100_end + 30 s
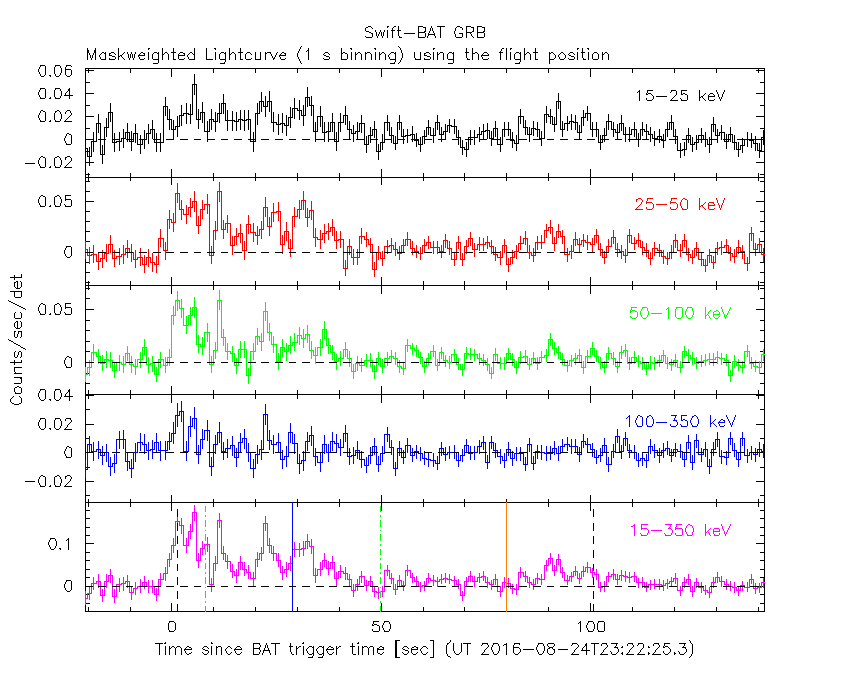
Full time interval
64 ms binning
Full time interval

From T100_start to T100_end
From T0-5 sec to T0+5 sec
16 ms binning
From T100_start-5 s to T100_start+5 s
Blue+Cyan dotted lines: Time interval of the scaled map
From 0.000000 to 2.048000
8 ms binning
From T100_start-3 s to T100_start+3 s
Blue+Cyan dotted lines: Time interval of the scaled map
From 0.000000 to 2.048000
2 ms binning
From T100_start-1 s to T100_start+1 s
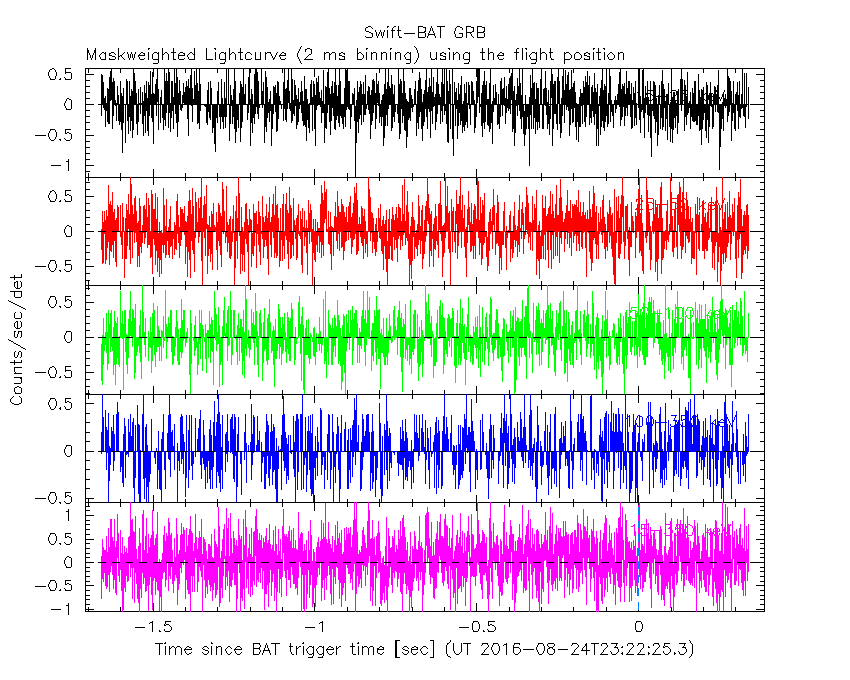
Blue+Cyan dotted lines: Time interval of the scaled map
From 0.000000 to 2.048000
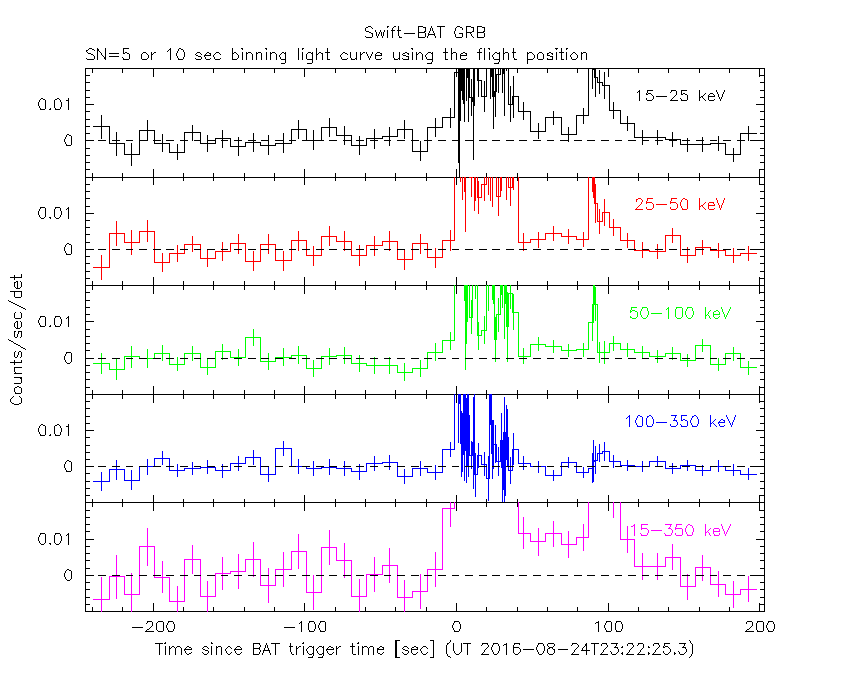
SN=5 or 10 sec. binning (whichever binning is satisfied first)

SN=5 or 10 sec. binning (T < 200 sec)
Quad-rate summed light curves (from T0-300s to T0+1000s)

Spectral Evolution

Spectra
Notes:
- 1) The fitting includes the systematic errors.
- 2) When the burst includes telescope slew time periods, the fitting uses an average response file made from multiple 5-s response files through out the slew time plus single time preiod for the non-slew times, and weighted by the total counts in the corresponding time period using addrmf. An average response file is needed becuase a spectral fit using the pre-slew DRM will introduce some errors in both a spectral shape and a normalization if the PHA file contains a lot of the slew/post-slew time interval.
- 3) For fits to more complicated models (e.g. a power-law over a cutoff power-law), the BAT team has decided to require a chi-square improvement of more than 6 for each extra dof.
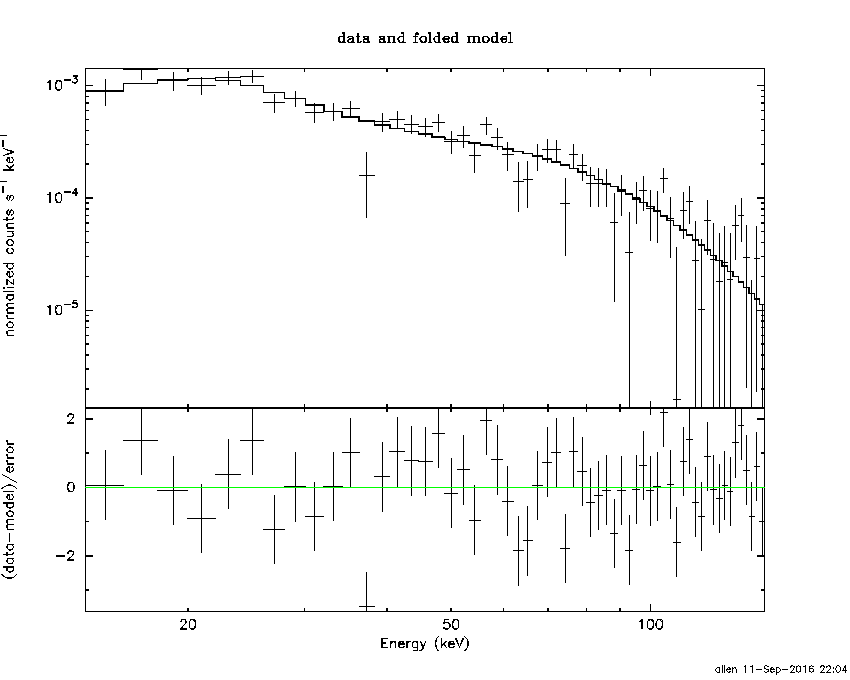
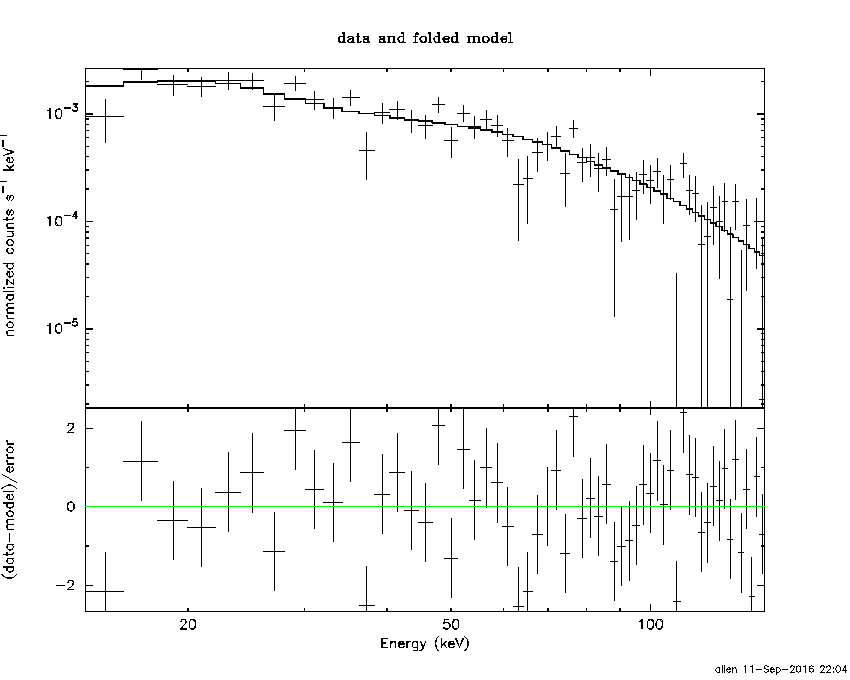
Time averaged spectrum fit using the average DRM
Power-law model
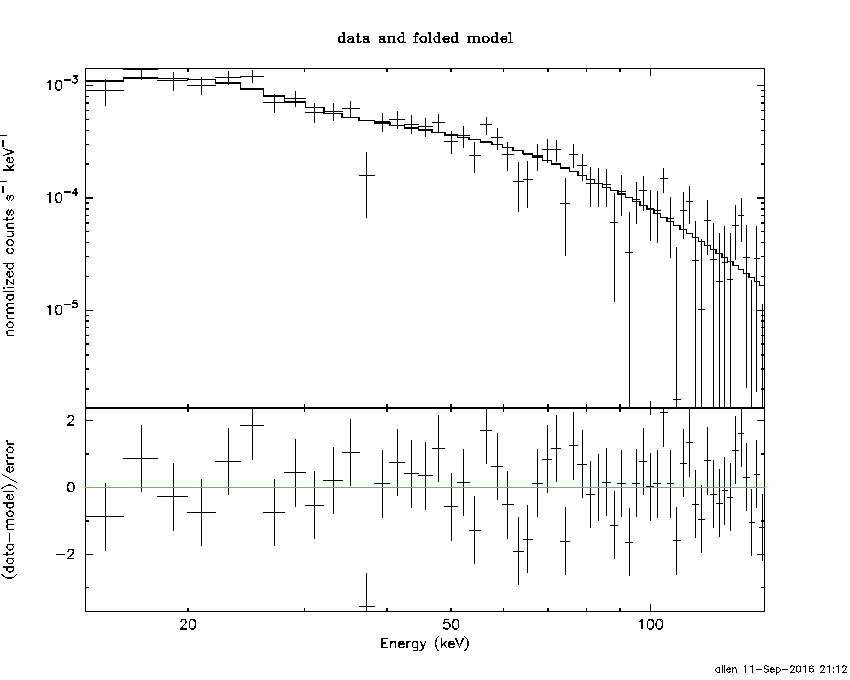
Time interval is from   -0.660 sec. to  111.576 sec.

Spectral model in power-law:
------------------------------------------------------------
Parameters  : value       lower 90%   higher 90%
Photon index: 1.61837     ( -0.107366   0.108129 )
Norm@50keV  : 2.40269E-03    ( -0.000144716   0.000143949 )
------------------------------------------------------------
#Fit statistic : Chi-Squared =          65.03 using 59 PHA bins.
# Reduced chi-squared =          1.141 for     57 degrees of freedom
# Null hypothesis probability =   2.173815e-01

Photon flux (15-150 keV)    in 112.2 sec: 0.310550 ( -0.018474  0.018516 ) ph/cm2/s
Energy fluence (15-150 keV)             : 2.51607e-06 ( -1.6231e-07  1.6342e-07 ) ergs/cm2
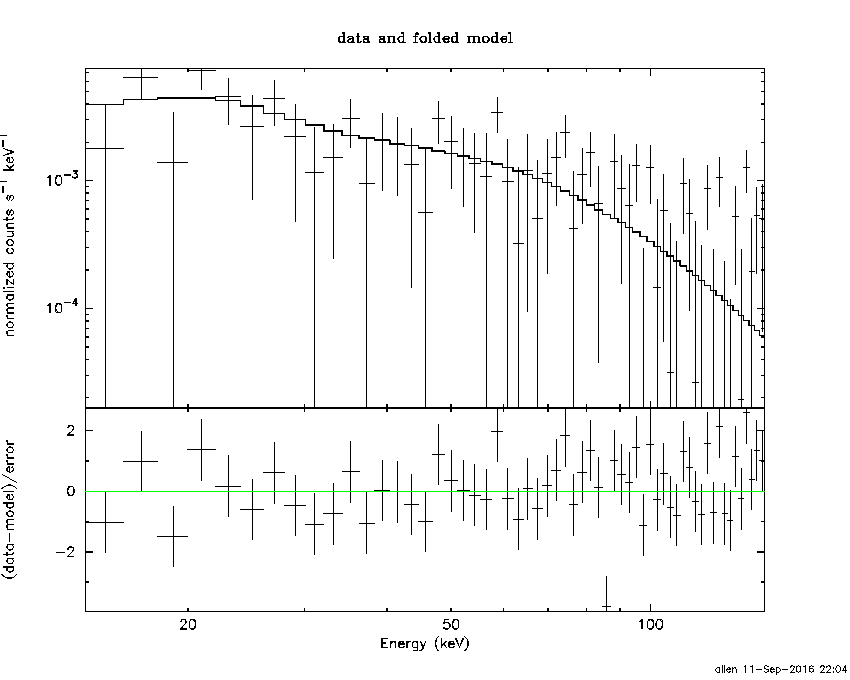
Cutoff power-law model

Time interval is from   -0.660 sec. to  111.576 sec.
Spectral model in the cutoff power-law:
------------------------------------------------------------
Parameters  : value       lower 90%   higher 90%
Photon index: 1.61651     ( -0.31938   0.128461 )
Epeak [keV] : 1.00000E+04      ( -10000 -10000 )
Norm@50keV  : 2.40816E-03    ( -0.000145536   0.000138004 )
------------------------------------------------------------
#Fit statistic : Chi-Squared =          65.03 using 59 PHA bins.
# Reduced chi-squared =          1.161 for     56 degrees of freedom
# Null hypothesis probability =   1.911067e-01

Photon flux (15-150 keV)    in 112.2 sec: 0.311586 ( -0.02318  0.020562 ) ph/cm2/s
Energy fluence (15-150 keV)             : 2.52908e-06 ( -2.16678e-07  1.91385e-07 ) ergs/cm2
Band function

Time interval is from   -0.660 sec. to  111.576 sec.


Spectral model in the Band function:
------------------------------------------------------------
Parameters  : value       lower 90%   higher 90%
alpha       :    (     )
beta        :     (     )
Epeak [keV] :       (   )
Norm@50keV   :     (     )
------------------------------------------------------------

Photon flux (15-150 keV)    in  sec:  (    ) ph/cm2/s
Energy fluence (15-150 keV)             : 0 ( 0  0 ) ergs/cm2
Single BB
Spectral model blackbody:
------------------------------------------------------------
Parameters  : value    Lower 90%  Upper 90%
kT [keV]    : 13.9249  (  )
R^2/D10^2   : 4.29538E-02  (   )
(R is the radius in km and D10 is the distance to the source in units of 10 kpc)
------------------------------------------------------------
#Fit statistic : Chi-Squared =         155.77 using 59 PHA bins.
# Reduced chi-squared =         2.7329 for     57 degrees of freedom
# Null hypothesis probability =   4.127051e-11

Energy  Fluence     90% Error
[keV]   [erg/cm2]   [erg/cm2]
15- 25  1.975e-07   2.317e-08
25- 50  7.306e-07   5.560e-08
50-150  9.302e-07   1.123e-07
15-150  1.858e-06   1.251e-07
Thermal bremsstrahlung (OTTB)

Spectral model: thermal bremsstrahlung
------------------------------------------------------------
Parameters  : value         Lower 90%    Upper 90%
kT [keV]    : 178.792       (-48.5786      -178.427)
Norm        : 1.25534       (-0.0790105     0.0890769)
------------------------------------------------------------
#Fit statistic : Chi-Squared =          67.95 using 59 PHA bins.
# Reduced chi-squared =          1.192 for     57 degrees of freedom
# Null hypothesis probability =   1.520532e-01

Energy  Fluence     90% Error
[keV]   [erg/cm2]   [erg/cm2]
15- 25  3.555e-07   3.136e-08
25- 50  6.748e-07   1.158e-07
50-150  1.425e-06   5.036e-07
15-150  2.456e-06   6.923e-07
Double BB
Spectral model: bbodyrad<1> + bbodyrad<2>
------------------------------------------------------------
Parameters  : value         Lower 90%    Upper 90%
kT1 [keV]   : 6.49126        (-1.12209      1.29462)
R1^2/D10^2  : 0.474186        (-0.220844      0.486079)
kT2 [keV]   : 27.1625        (-4.92599      8.38956)
R2^2/D10^2  : 3.28289E-03    (-0.00192756   0.00340803)
------------------------------------------------------------
#Fit statistic : Chi-Squared =          67.44 using 59 PHA bins.
# Reduced chi-squared =          1.226 for     55 degrees of freedom
# Null hypothesis probability =   1.210860e-01

Energy  Fluence     90% Error
[keV]   [erg/cm2]   [erg/cm2]
15- 25  3.758e-07   7.641e-08
25- 50  6.560e-07   1.078e-07
50-150  1.482e-06   3.857e-07
15-150  2.514e-06   4.668e-07
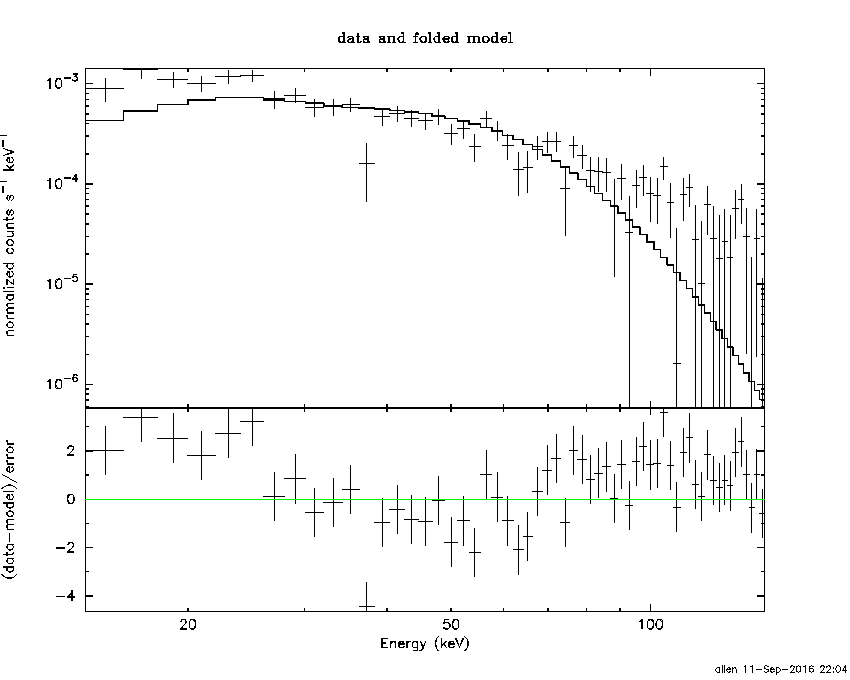
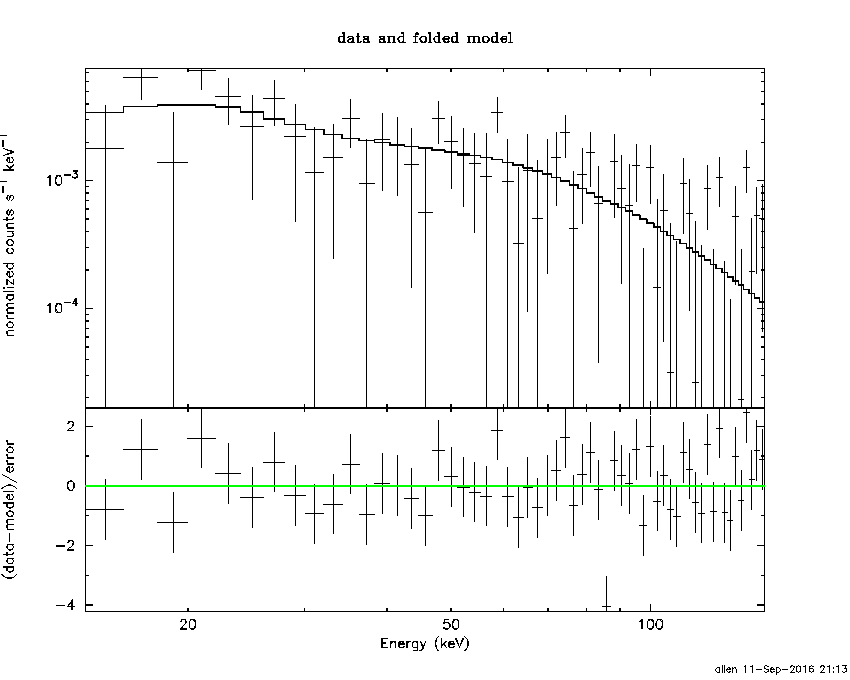
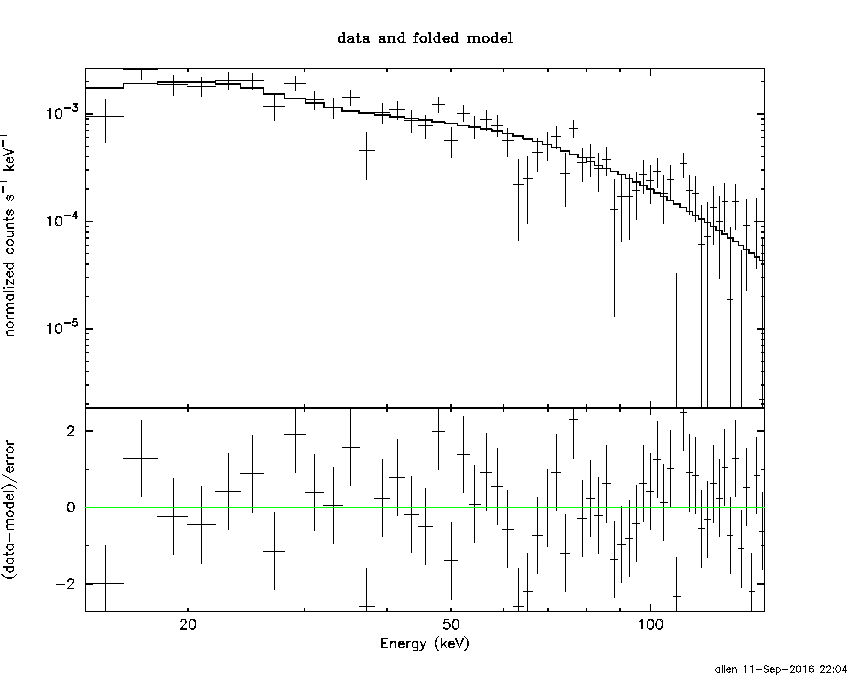
Peak spectrum fit
Power-law model

Time interval is from    4.884 sec. to    5.884 sec.

Spectral model in power-law:
------------------------------------------------------------
Parameters  : value       lower 90%   higher 90%
Photon index: 1.30079     ( -0.321238   0.319751 )
Norm@50keV  : 1.11372E-02    ( -0.00196196   0.00195453 )
------------------------------------------------------------
#Fit statistic : Chi-Squared =          68.31 using 59 PHA bins.
# Reduced chi-squared =          1.198 for     57 degrees of freedom
# Null hypothesis probability =   1.451235e-01

Photon flux (15-150 keV)    in 1 sec: 1.32891 ( -0.23613  0.23674 ) ph/cm2/s
Energy fluence (15-150 keV)             : 1.10047e-07 ( -2.18914e-08  2.21556e-08 ) ergs/cm2
Cutoff power-law model
Time interval is from    4.884 sec. to    5.884 sec.
Spectral model in the cutoff power-law:
------------------------------------------------------------
Parameters  : value       lower 90%   higher 90%
Photon index: 1.30681     ( -0.332326   0.313039 )
Epeak [keV] : 9999.32      ( -9999.36 -9999.36 )
Norm@50keV  : 1.11734E-02    ( -0.00196662   0.015852 )
------------------------------------------------------------
#Fit statistic : Chi-Squared =          68.32 using 59 PHA bins.
# Reduced chi-squared =          1.220 for     56 degrees of freedom
# Null hypothesis probability =   1.250606e-01

Photon flux (15-150 keV)    in 1 sec: 1.33765 ( -0.29727  0.2801 ) ph/cm2/s
Energy fluence (15-150 keV)             : 1.10632e-07 ( 0  0 ) ergs/cm2
Band function

Time interval is from    4.884 sec. to    5.884 sec.


Spectral model in the Band function:
------------------------------------------------------------
Parameters  : value       lower 90%   higher 90%
alpha       :    (     )
beta        :     (     )
Epeak [keV] :       (   )
Norm@50keV   :     (     )
------------------------------------------------------------

Photon flux (15-150 keV)    in  sec:  (    ) ph/cm2/s
Energy fluence (15-150 keV)             : 0 ( 0  0 ) ergs/cm2
Single BB
Spectral model blackbody:
------------------------------------------------------------
Parameters  : value    Lower 90%  Upper 90%
kT [keV]    : 17.3856  (-4.02427  5.70674)
R^2/D10^2   : 9.26454E-02  (-0.0562643   0.130949)
(R is the radius in km and D10 is the distance to the source in units of 10 kpc)
------------------------------------------------------------
#Fit statistic : Chi-Squared =          80.09 using 59 PHA bins.
# Reduced chi-squared =          1.405 for     57 degrees of freedom
# Null hypothesis probability =   2.353800e-02

Energy  Fluence     90% Error
[keV]   [erg/cm2]   [erg/cm2]
15- 25  5.667e-09   2.255e-09
25- 50  2.552e-08   7.400e-09
50-150  5.546e-08   2.123e-08
15-150  8.665e-08   2.685e-08
Thermal bremsstrahlung (OTTB)
Spectral model: thermal bremsstrahlung
------------------------------------------------------------
Parameters  : value         Lower 90%    Upper 90%
kT [keV]    : 200.000       (-73.7455      -200)
Norm        : 5.45325       (-0.964184     0.964184)
------------------------------------------------------------
#Fit statistic : Chi-Squared =          70.75 using 59 PHA bins.
# Reduced chi-squared =          1.241 for     57 degrees of freedom
# Null hypothesis probability =   1.041224e-01

Energy  Fluence     90% Error
[keV]   [erg/cm2]   [erg/cm2]
15- 25  1.358e-08   7.835e-09
25- 50  2.612e-08   1.504e-08
50-150  5.729e-08   3.218e-08
15-150  9.699e-08   5.570e-08
Double BB

Spectral model: bbodyrad<1> + bbodyrad<2>
------------------------------------------------------------
Parameters  : value         Lower 90%    Upper 90%
kT1 [keV]   : 6.50468        (-2.9488      6.97706)
R1^2/D10^2  : 1.81203        (-1.61547      18.0244)
kT2 [keV]   : 34.5199        (-14.9471      -34.8279)
R2^2/D10^2  : 8.66564E-03    (-0.00764109   0.0145714)
------------------------------------------------------------
#Fit statistic : Chi-Squared =          68.96 using 59 PHA bins.
# Reduced chi-squared =          1.254 for     55 degrees of freedom
# Null hypothesis probability =   9.765656e-02

Energy  Fluence     90% Error
[keV]   [erg/cm2]   [erg/cm2]
15- 25  1.281e-08   7.285e-09
25- 50  2.302e-08   1.224e-08
50-150  7.720e-08   4.347e-08
15-150  1.130e-07   5.986e-08
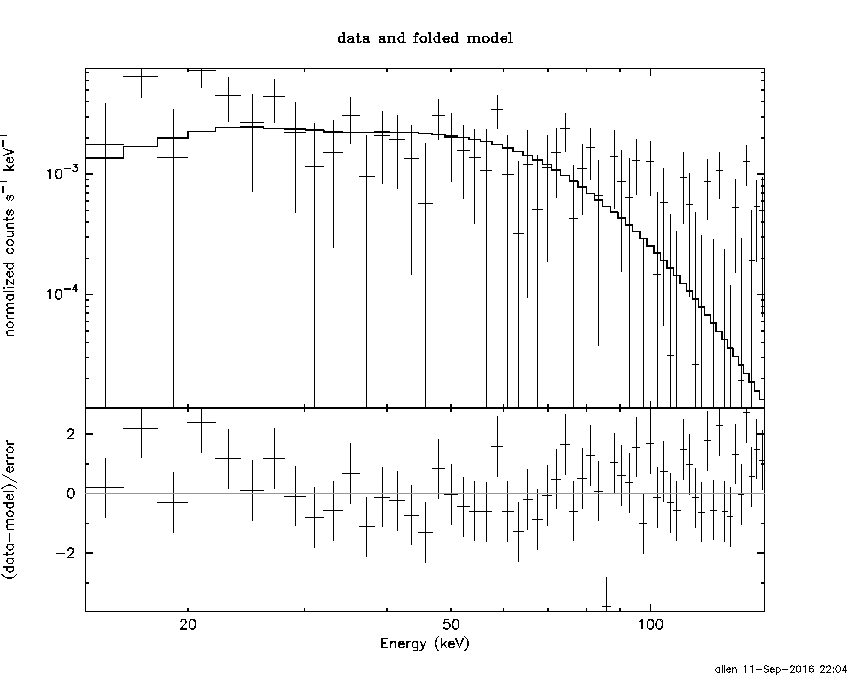
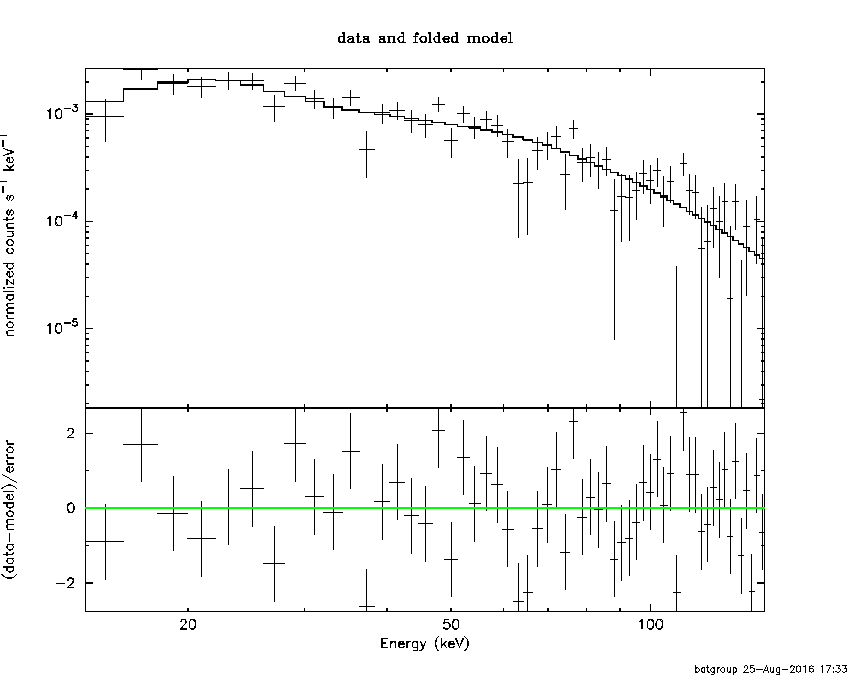
Pre-slew spectrum (Pre-slew PHA with pre-slew DRM)
Power-law model
Spectral model in power-law:
------------------------------------------------------------
Parameters  : value       lower 90%   higher 90%
Photon index: 1.40249     ( -0.111986   0.111592 )
Norm@50keV  : 5.30680E-03    ( -0.000336603   0.00033607 )
------------------------------------------------------------
#Fit statistic : Chi-Squared =          83.27 using 59 PHA bins.
# Reduced chi-squared =          1.461 for     57 degrees of freedom
# Null hypothesis probability =   1.319108e-02

Photon flux (15-150 keV)    in 29.45 sec: 0.646649 ( -0.0422904  0.0423305 ) ph/cm2/s
Energy fluence (15-150 keV)             : 1.50936e-06 ( -1.05015e-07  1.05543e-07 ) ergs/cm2
Cutoff power-law model
Spectral model in the cutoff power-law:
------------------------------------------------------------
Parameters  : value       lower 90%   higher 90%
Photon index: 1.26816     ( -0.434916   0.232254 )
Epeak [keV] : 279.227      ( -279.241 -279.241 )
Norm@50keV  : 6.18957E-03    ( -0.00117807   0.00384625 )
------------------------------------------------------------
#Fit statistic : Chi-Squared =          82.95 using 59 PHA bins.
# Reduced chi-squared =          1.481 for     56 degrees of freedom
# Null hypothesis probability =   1.114411e-02

Photon flux (15-150 keV)    in 29.45 sec: 0.642611 ( -0.043877  0.043332 ) ph/cm2/s
Energy fluence (15-150 keV)             : 1.49489e-06 ( -1.15423e-07  1.13792e-07 ) ergs/cm2
Band function
Spectral model in the Band function:
------------------------------------------------------------
Parameters  : value       lower 90%   higher 90%
alpha       :    (     )
beta        :     (     )
Epeak [keV] :       (   )
Norm@50keV   :     (     )
------------------------------------------------------------

Photon flux (15-150 keV)    in  sec:  (    ) ph/cm2/s
Energy fluence (15-150 keV)             : 0 ( 0  0 ) ergs/cm2
S(25-50 keV) vs. S(50-100 keV) plot
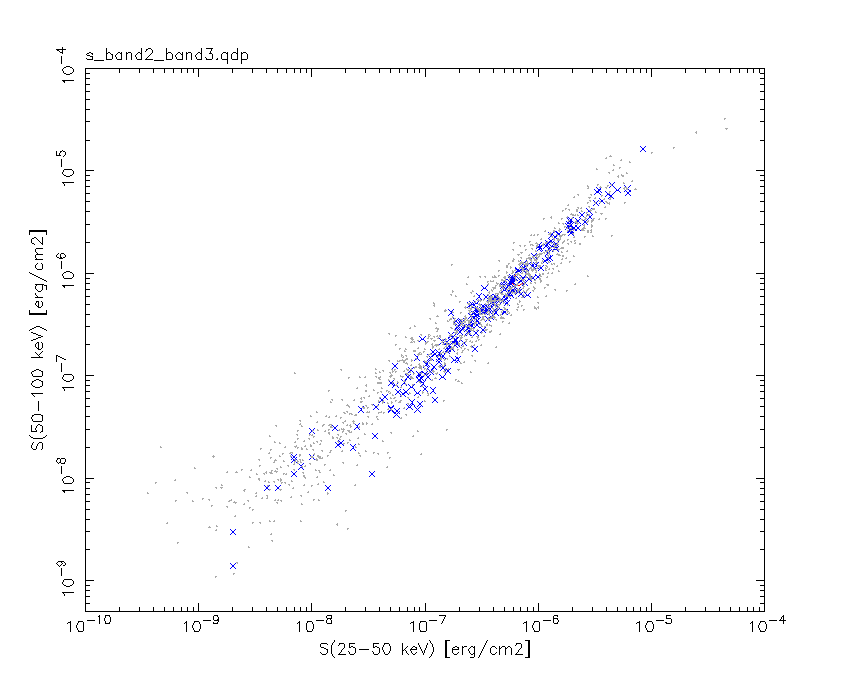
S(25-50 keV)  = 6.57e-07
S(50-100 keV) = 8.57e-07
T90 vs. Hardness ratio plot
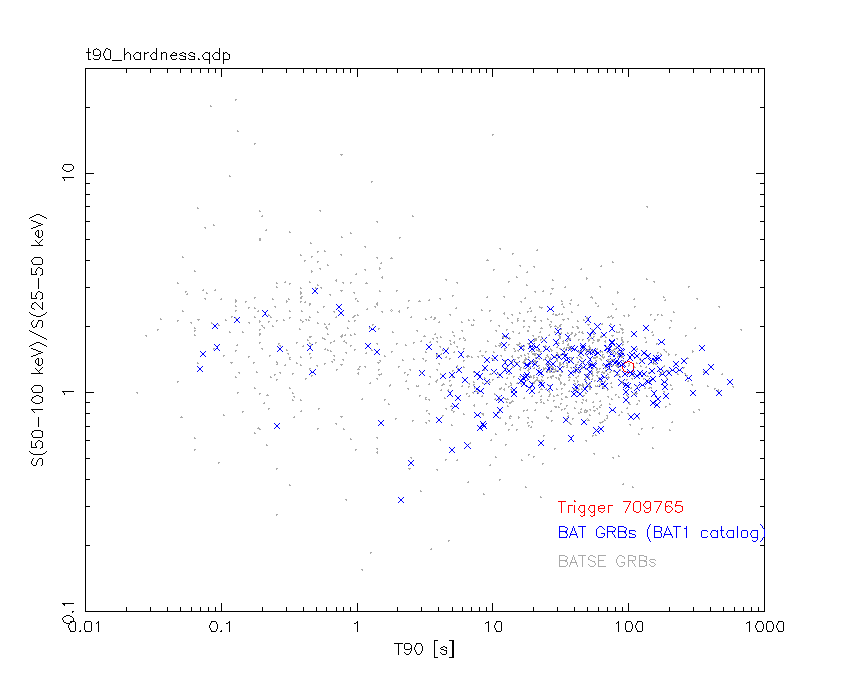
T90                                   = 99.3319999575615 sec.
Hardness ratio (energy fluence ratio) = 1.30441
Color vs. Color plot
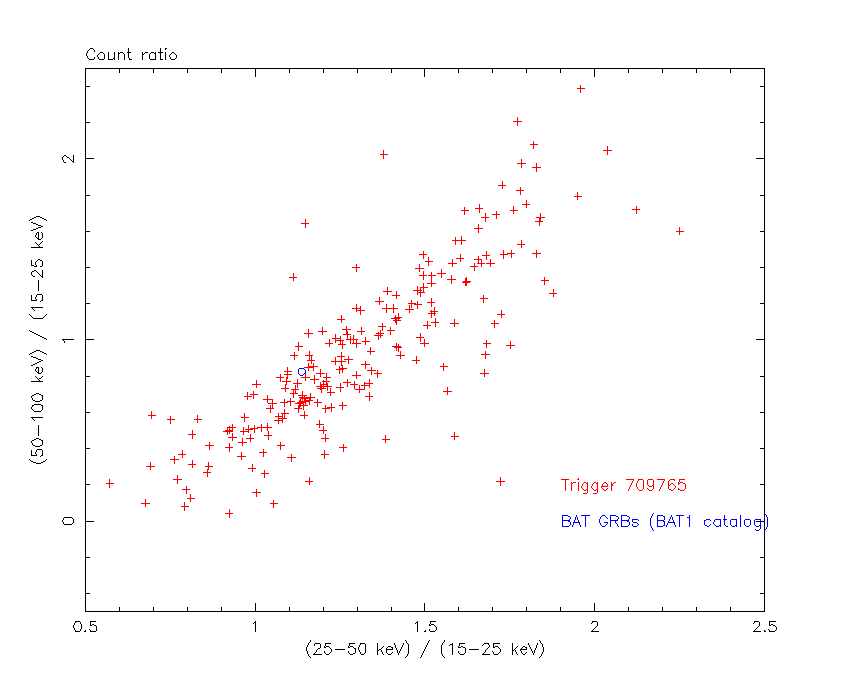
Count Ratio  (25-50 keV) / (15-25 keV) = 1.13718
Count Ratio (50-100 keV) / (15-25 keV) = 0.824618
Mask shadow pattern
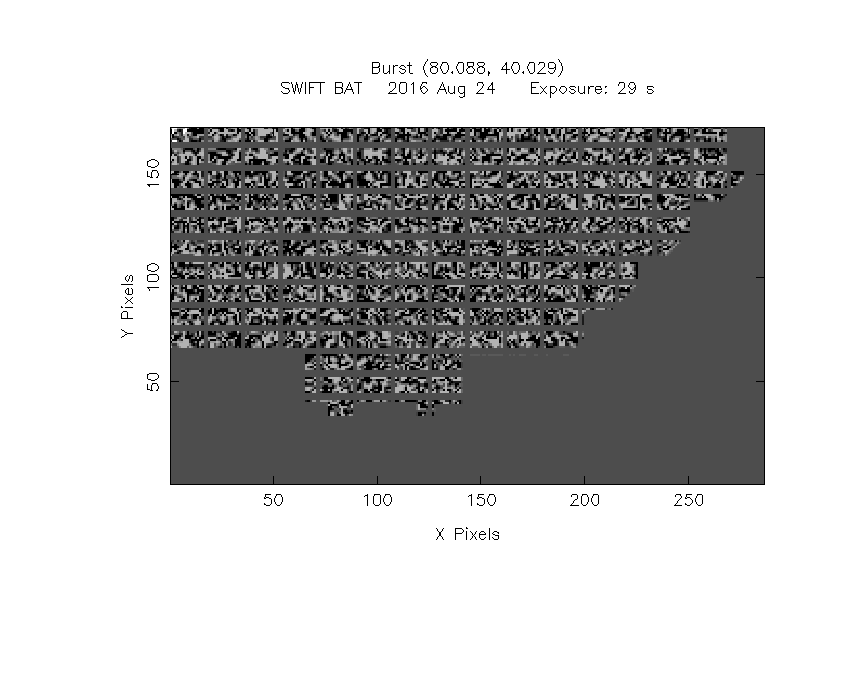
IMX = 4.929225329358100E-01, IMY = -3.473012831761868E-01
TIME vs. PHA plot around the trigger time

Blue+Cyan dotted lines: Time interval of the scaled map
From 0.000000 to 2.048000
TIME vs. DetID plot around the trigger time
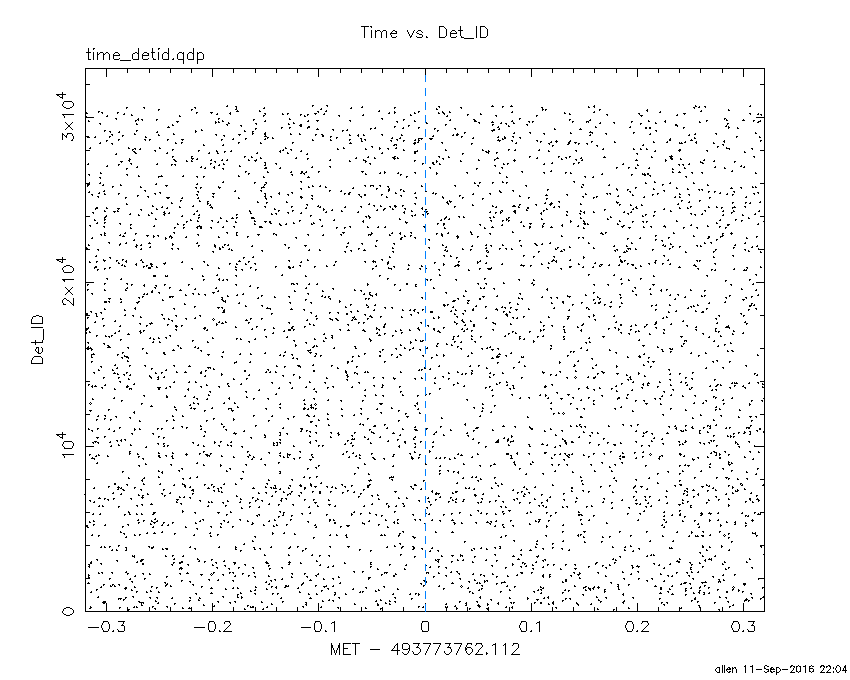
Blue+Cyan dotted lines: Time interval of the scaled map
From 0.000000 to 2.048000
100 us light curve (15-350 keV)

Blue+Cyan dotted lines: Time interval of the scaled map
From 0.000000 to 2.048000
Spacecraft aspect plot

Bright source in the pre-burst/pre-slew/post-slew images
Pre-burst image of 15-350 keV band
Time interval of the image:
-146.811400 -0.660000

# RAcent  DECcent POSerr Theta    Phi  PeakCts   SNR AngSep     Name
#  [deg]    [deg]    ['] [deg]  [deg]                   [']
 83.6168  22.0019    0.7  44.2   14.0   5.1797  17.6    1.2	Crab
 52.2664  47.5676    2.9  40.9   67.9   2.5201   3.9 ------	UNKNOWN
 64.3524  25.9365    3.9  50.3   37.2   2.2480   3.0 ------	UNKNOWN
 76.4071  33.7975    2.4  37.7   32.0   1.2838   4.9 ------	UNKNOWN
 87.6230   5.5488    2.4  57.7    0.8   4.0261   4.7 ------	UNKNOWN
166.0205  30.0269    2.4  41.4 -107.9   3.7242   4.7 ------	UNKNOWN
135.6008  13.9064    2.6  44.7  -60.0   3.3103   4.4 ------	UNKNOWN
Pre-slew background subtracted image of 15-350 keV band
Time interval of the image:
-0.660000 28.788640

# RAcent  DECcent POSerr Theta    Phi  PeakCts   SNR AngSep     Name
#  [deg]    [deg]    ['] [deg]  [deg]                   [']
 83.5586  22.0291    4.3  44.2   14.1   0.3698   2.7    4.2	Crab
 80.0869  40.0390    0.5  31.1   35.2   2.3458  23.9 ------	UNKNOWN
 82.9711  29.5641    2.3  38.0   20.5   0.5549   5.0 ------	UNKNOWN
Post-slew image of 15-350 keV band
Time interval of the image:
79.988590 963.020900

# RAcent  DECcent POSerr Theta    Phi  PeakCts   SNR AngSep     Name
#  [deg]    [deg]    ['] [deg]  [deg]                   [']
 83.6318  22.0186    0.2  18.3  -12.2  35.5231  54.7    0.3	Crab
 33.2926  40.8534    3.4  35.2  105.2   5.4773   3.4 ------	UNKNOWN
 71.7423  -9.3076    3.6  49.9    9.1   5.2735   3.2 ------	UNKNOWN
 93.8985 -15.0876    3.2  56.6  -17.7   8.9527   3.6 ------	UNKNOWN
101.3657 -15.2987    3.4  58.8  -25.8  15.9096   3.8 ------	UNKNOWN
101.6009 -15.3012    4.1  58.8  -26.1  15.8560   3.7 ------	UNKNOWN
111.8976  -1.4303    2.5  50.6  -44.7  17.7583   4.6 ------	UNKNOWN
Plot creation:
Sun Sep 11 22:05:09 EDT 2016