Estimated redshift from machine learning (Ukwatta et al. 2016) - may take a few minute to calcaulte
Image
Pre-slew 15.0-350.0 keV image (Event data)

#   RAcent    DECcent   POSerr    Theta     Phi              Peak Cts       SNR   Name
  256.2699    17.3337   0.0141    26.7832    68.5176         0.2468623     13.579 TRIG_00713782

Foreground time interval of the image:
  0.000   0.560 (delta_t =   0.560 [sec])
Background time interval of the image:
-324.515 -310.456 (delta_t =  14.059 [sec])
-239.816   0.000 (delta_t = 239.816 [sec])
Lightcurves
Notes:
- 1) The mask-weighted light curves are using the flight position.
- 2) Multiple plots of different time binning/intervals are shown to cover all scenarios of short/long GRBs, rate/image triggers, and real/false positives.
- 3) For all the mask-weighted lightcurves, the y-axis units are counts/sec/det where a det is 0.4 x 0.4 = 0.16 sq cm.
- 4) The verticle lines correspond to following: green dotted lines are T50 interval, black dotted lines are T90 interval, blue solid line(s) is a spacecraft slew start time, and orange solid line(s) is a spacecraft slew end time.
- 5) Time of each bin is in the middle of the bin.
1 s binning
From T0-310 s to T0+310 s
From T100_start - 20 s to T100_end + 30 s
Full time interval

64 ms binning
Full time interval

From T100_start to T100_end

From T0-5 sec to T0+5 sec
16 ms binning
From T100_start-5 s to T100_start+5 s

Blue+Cyan dotted lines: Time interval of the scaled map
From 0.000000 to 0.512000
8 ms binning
From T100_start-3 s to T100_start+3 s

Blue+Cyan dotted lines: Time interval of the scaled map
From 0.000000 to 0.512000
2 ms binning
From T100_start-1 s to T100_start+1 s

Blue+Cyan dotted lines: Time interval of the scaled map
From 0.000000 to 0.512000
SN=5 or 10 sec. binning (whichever binning is satisfied first)
SN=5 or 10 sec. binning (T < 200 sec)

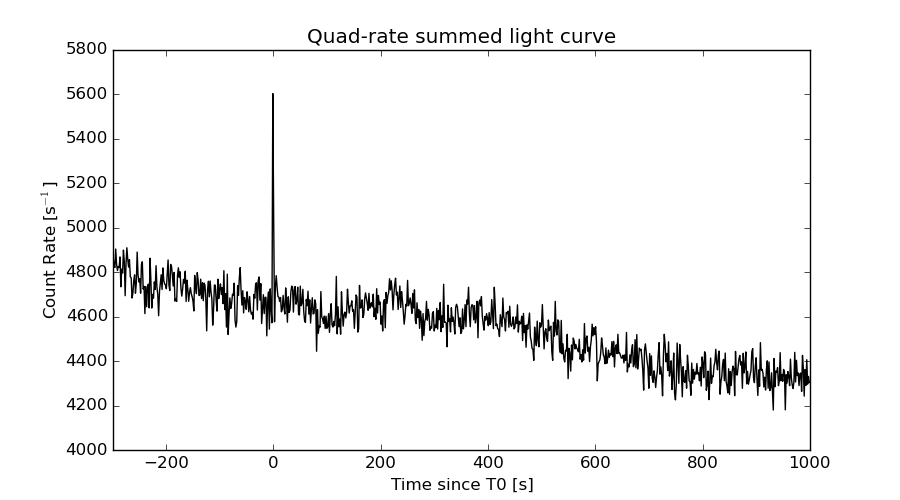
Quad-rate summed light curves (from T0-300s to T0+1000s)
Spectral Evolution

Spectra
Notes:
- 1) The fitting includes the systematic errors.
- 2) When the burst includes telescope slew time periods, the fitting uses an average response file made from multiple 5-s response files through out the slew time plus single time preiod for the non-slew times, and weighted by the total counts in the corresponding time period using addrmf. An average response file is needed becuase a spectral fit using the pre-slew DRM will introduce some errors in both a spectral shape and a normalization if the PHA file contains a lot of the slew/post-slew time interval.
- 3) For fits to more complicated models (e.g. a power-law over a cutoff power-law), the BAT team has decided to require a chi-square improvement of more than 6 for each extra dof.
Time averaged spectrum fit using the average DRM
Power-law model

Time interval is from    0.000 sec. to    0.560 sec.

Spectral model in power-law:
------------------------------------------------------------
Parameters  : value       lower 90%   higher 90%
Photon index: 1.12708     ( -0.258984   0.256314 )
Norm@50keV  : 2.41214E-02    ( -0.0033196   0.00331934 )
------------------------------------------------------------
#Fit statistic : Chi-Squared =          36.01 using 59 PHA bins.
# Reduced chi-squared =         0.6317 for     57 degrees of freedom
# Null hypothesis probability =   9.865595e-01

Photon flux (15-150 keV)    in 0.56 sec: 2.80572 ( -0.39468  0.39582 ) ph/cm2/s
Energy fluence (15-150 keV)             : 1.40048e-07 ( -2.19106e-08  2.21658e-08 ) ergs/cm2
Cutoff power-law model

Time interval is from    0.000 sec. to    0.560 sec.
Spectral model in the cutoff power-law:
------------------------------------------------------------
Parameters  : value       lower 90%   higher 90%
Photon index: 1.12237     ( -0.77729   0.307526 )
Epeak [keV] : 1.00000E+04      ( -10000 -10000 )
Norm@50keV  : 2.42464E-02    (     )
------------------------------------------------------------
#Fit statistic : Chi-Squared =          36.02 using 59 PHA bins.
# Reduced chi-squared =         0.6431 for     56 degrees of freedom
# Null hypothesis probability =   9.825976e-01

Photon flux (15-150 keV)    in 0.56 sec: 2.82696 (    ) ph/cm2/s
Energy fluence (15-150 keV)             : 1.41263e-07 ( -2.48239e-08  1.57294e-08 ) ergs/cm2
Band function

Time interval is from    0.000 sec. to    0.560 sec.


Spectral model in the Band function:
------------------------------------------------------------
Parameters  : value       lower 90%   higher 90%
alpha       :    (     )
beta        :     (     )
Epeak [keV] :       (   )
Norm@50keV   :     (     )
------------------------------------------------------------

Photon flux (15-150 keV)    in  sec:  (    ) ph/cm2/s
Energy fluence (15-150 keV)             : 0 ( 0  0 ) ergs/cm2
Single BB

Spectral model blackbody:
------------------------------------------------------------
Parameters  : value    Lower 90%  Upper 90%
kT [keV]    : 19.6915  (-3.66435  4.89502)
R^2/D10^2   : 0.135344  (-0.0679196   0.126721)
(R is the radius in km and D10 is the distance to the source in units of 10 kpc)
------------------------------------------------------------
#Fit statistic : Chi-Squared =          48.93 using 59 PHA bins.
# Reduced chi-squared =         0.8585 for     57 degrees of freedom
# Null hypothesis probability =   7.676987e-01

Energy  Fluence     90% Error
[keV]   [erg/cm2]   [erg/cm2]
15- 25  5.700e-09   1.775e-09
25- 50  2.810e-08   6.546e-09
50-150  8.058e-08   2.014e-08
15-150  1.144e-07   2.688e-08
Thermal bremsstrahlung (OTTB)

Spectral model: thermal bremsstrahlung
------------------------------------------------------------
Parameters  : value         Lower 90%    Upper 90%
kT [keV]    : 200.000       (-44.2113      -200)
Norm        : 11.4306       (-1.6188     1.6188)
------------------------------------------------------------
#Fit statistic : Chi-Squared =          43.91 using 59 PHA bins.
# Reduced chi-squared =         0.7704 for     57 degrees of freedom
# Null hypothesis probability =   8.981136e-01

Energy  Fluence     90% Error
[keV]   [erg/cm2]   [erg/cm2]
15- 25  1.595e-08   9.066e-09
25- 50  3.067e-08   1.725e-08
50-150  6.727e-08   3.783e-08
15-150  1.139e-07   6.339e-08
Double BB

Spectral model: bbodyrad<1> + bbodyrad<2>
------------------------------------------------------------
Parameters  : value         Lower 90%    Upper 90%
kT1 [keV]   : 8.81914        (-4.53146      6.09561)
R1^2/D10^2  : 1.19389        (-0.912467      12.8511)
kT2 [keV]   : 44.2287        (-22.0804      -45.1951)
R2^2/D10^2  : 9.57765E-03    (-0.00748715   0.0647343)
------------------------------------------------------------
#Fit statistic : Chi-Squared =          36.98 using 59 PHA bins.
# Reduced chi-squared =         0.6724 for     55 degrees of freedom
# Null hypothesis probability =   9.704024e-01

Energy  Fluence     90% Error
[keV]   [erg/cm2]   [erg/cm2]
15- 25  1.127e-08   6.535e-09
25- 50  2.944e-08   1.554e-08
50-150  1.022e-07   5.813e-08
15-150  1.430e-07   7.434e-08
Peak spectrum fit
Power-law model

Time interval is from   -0.220 sec. to    0.780 sec.

Spectral model in power-law:
------------------------------------------------------------
Parameters  : value       lower 90%   higher 90%
Photon index: 1.29091     ( -0.270703   0.26983 )
Norm@50keV  : 1.57804E-02    ( -0.00225652   0.00225258 )
------------------------------------------------------------
#Fit statistic : Chi-Squared =          46.37 using 59 PHA bins.
# Reduced chi-squared =         0.8135 for     57 degrees of freedom
# Null hypothesis probability =   8.417496e-01

Photon flux (15-150 keV)    in 1 sec: 1.87954 ( -0.27457  0.27556 ) ph/cm2/s
Energy fluence (15-150 keV)             : 1.56304e-07 ( -2.52893e-08  2.56409e-08 ) ergs/cm2
Cutoff power-law model

Time interval is from   -0.220 sec. to    0.780 sec.
Spectral model in the cutoff power-law:
------------------------------------------------------------
Parameters  : value       lower 90%   higher 90%
Photon index: 1.28690     ( -0.675006   0.271535 )
Epeak [keV] : 9999.24      ( -9999.36 -9999.36 )
Norm@50keV  : 1.58106E-02    (     )
------------------------------------------------------------
#Fit statistic : Chi-Squared =          46.38 using 59 PHA bins.
# Reduced chi-squared =         0.8282 for     56 degrees of freedom
# Null hypothesis probability =   8.166967e-01

Photon flux (15-150 keV)    in 1 sec: 0.848015 ( -0.425173  0.332255 ) ph/cm2/s
Energy fluence (15-150 keV)             : 6.01742e-08 ( -1.25618e-08  2.56105e-08 ) ergs/cm2
Band function

Time interval is from   -0.220 sec. to    0.780 sec.


Spectral model in the Band function:
------------------------------------------------------------
Parameters  : value       lower 90%   higher 90%
alpha       :    (     )
beta        :     (     )
Epeak [keV] :       (   )
Norm@50keV   :     (     )
------------------------------------------------------------

Photon flux (15-150 keV)    in  sec:  (    ) ph/cm2/s
Energy fluence (15-150 keV)             : 0 ( 0  0 ) ergs/cm2
Single BB

Spectral model blackbody:
------------------------------------------------------------
Parameters  : value    Lower 90%  Upper 90%
kT [keV]    : 16.3739  (-3.14854  4.32916)
R^2/D10^2   : 0.157823  (-0.0849257   0.167605)
(R is the radius in km and D10 is the distance to the source in units of 10 kpc)
------------------------------------------------------------
#Fit statistic : Chi-Squared =          61.12 using 59 PHA bins.
# Reduced chi-squared =          1.072 for     57 degrees of freedom
# Null hypothesis probability =   3.301742e-01

Energy  Fluence     90% Error
[keV]   [erg/cm2]   [erg/cm2]
15- 25  8.702e-09   2.678e-09
25- 50  3.734e-08   7.695e-09
50-150  7.057e-08   1.932e-08
15-150  1.166e-07   2.824e-08
Thermal bremsstrahlung (OTTB)

Spectral model: thermal bremsstrahlung
------------------------------------------------------------
Parameters  : value         Lower 90%    Upper 90%
kT [keV]    : 200.000       (-59.6487      -200)
Norm        : 7.73513       (-1.1144     1.1144)
------------------------------------------------------------
#Fit statistic : Chi-Squared =          49.80 using 59 PHA bins.
# Reduced chi-squared =         0.8736 for     57 degrees of freedom
# Null hypothesis probability =   7.396663e-01

Energy  Fluence     90% Error
[keV]   [erg/cm2]   [erg/cm2]
15- 25  1.926e-08   1.107e-08
25- 50  3.705e-08   2.094e-08
50-150  8.126e-08   4.478e-08
15-150  1.376e-07   7.740e-08
Double BB

------------------------------------------------------------
Parameters  : value         Lower 90%    Upper 90%
kT1 [keV]   : 10.7121        (-3.59596      3.53733)
R1^2/D10^2  : 0.548198        (-0.297767      1.56606)
kT2 [keV]   : 198.537        (-198.597      -198.597)
R2^2/D10^2  : 3.06418E-04    (-0.000110131   0.0068149)
------------------------------------------------------------
#Fit statistic : Chi-Squared =          45.76 using 59 PHA bins.
#Fit statistic : Chi-Squared =          45.14 using 59 PHA bins.
# Reduced chi-squared =         0.8319 for     55 degrees of freedom
# Reduced chi-squared =         0.8207 for     55 degrees of freedom
# Null hypothesis probability =   8.082871e-01
# Null hypothesis probability =   8.260167e-01

Energy  Fluence     90% Error
[keV]   [erg/cm2]   [erg/cm2]
15- 25  1.458e-08   8.485e-09
25- 50  3.752e-08   2.084e-08
50-150  1.020e-07   5.990e-08
15-150  1.541e-07   8.305e-08
Pre-slew spectrum (Pre-slew PHA with pre-slew DRM)
Power-law model

Spectral model in power-law:
------------------------------------------------------------
Parameters  : value       lower 90%   higher 90%
Photon index: 1.12708     ( -0.258984   0.256314 )
Norm@50keV  : 2.41214E-02    ( -0.0033196   0.00331934 )
------------------------------------------------------------
#Fit statistic : Chi-Squared =          36.01 using 59 PHA bins.
# Reduced chi-squared =         0.6317 for     57 degrees of freedom
# Null hypothesis probability =   9.865595e-01

Photon flux (15-150 keV)    in 0.56 sec: 2.80571 ( -0.394659  0.395808 ) ph/cm2/s
Energy fluence (15-150 keV)             : 1.40031e-07 ( -2.19061e-08  2.21703e-08 ) ergs/cm2
Cutoff power-law model

Spectral model in the cutoff power-law:
------------------------------------------------------------
Parameters  : value       lower 90%   higher 90%
Photon index: 1.12237     ( -0.775102   0.31305 )
Epeak [keV] : 1.00000E+04      ( -10000 -10000 )
Norm@50keV  : 2.42464E-02    (     )
------------------------------------------------------------
#Fit statistic : Chi-Squared =          36.02 using 59 PHA bins.
# Reduced chi-squared =         0.6431 for     56 degrees of freedom
# Null hypothesis probability =   9.825976e-01

Photon flux (15-150 keV)    in 0.56 sec: 2.80482 ( -0.39435  0.39529 ) ph/cm2/s
Energy fluence (15-150 keV)             : 1.39631e-07 ( -2.16748e-08  2.23625e-08 ) ergs/cm2
Band function

Spectral model in the Band function:
------------------------------------------------------------
Parameters  : value       lower 90%   higher 90%
alpha       :    (     )
beta        :     (     )
Epeak [keV] :       (   )
Norm@50keV   :     (     )
------------------------------------------------------------

Photon flux (15-150 keV)    in  sec:  (    ) ph/cm2/s
Energy fluence (15-150 keV)             : 0 ( 0  0 ) ergs/cm2
S(25-50 keV) vs. S(50-100 keV) plot

S(25-50 keV)  = 2.81e-08
S(50-100 keV) = 5.15e-08
T90 vs. Hardness ratio plot

T90                                   = 0.48799991607666 sec.
Hardness ratio (energy fluence ratio) = 1.83274
Color vs. Color plot

Count Ratio  (25-50 keV) / (15-25 keV) = 1.04234
Count Ratio (50-100 keV) / (15-25 keV) = 1.31581
Mask shadow pattern

IMX = 1.848539045383737E-01, IMY = -4.697017635139883E-01
TIME vs. PHA plot around the trigger time

Blue+Cyan dotted lines: Time interval of the scaled map
From 0.000000 to 0.512000
TIME vs. DetID plot around the trigger time

Blue+Cyan dotted lines: Time interval of the scaled map
From 0.000000 to 0.512000
100 us light curve (15-350 keV)

Blue+Cyan dotted lines: Time interval of the scaled map
From 0.000000 to 0.512000
Spacecraft aspect plot

Bright source in the pre-burst/pre-slew/post-slew images
Pre-burst image of 15-350 keV band
Time interval of the image:
-324.515400 -310.456200
-239.816000 0.000000

# RAcent  DECcent POSerr Theta    Phi  PeakCts   SNR AngSep     Name
#  [deg]    [deg]    ['] [deg]  [deg]                   [']
244.9866 -15.6368    0.2  20.3  164.4  16.4985  53.4    0.5	Sco X-1
254.5190  35.3766    9.0  38.7   42.7   0.8352   1.3    3.6	Her X-1
255.9818 -37.8499    2.4  44.3  170.9   3.3319   4.8    0.4	4U 1700-377
256.3905 -36.3830    5.8  43.3  169.3  -1.4045  -2.0    3.2	GX 349+2
262.9099 -24.6940    4.9  38.3  150.9   1.5330   2.4    6.2	GX 1+4
264.6433 -44.4621    4.8  53.5  168.9  -3.3321  -2.4    4.3	4U 1735-44
268.4605  -1.5549    3.4  34.4  110.9  -2.2468  -3.4    8.3	SW J1753.5-0127
270.2564 -25.0575    7.6  44.0  145.5   1.4652   1.5    2.0	GX 5-1
270.4392 -25.7320   18.4  44.5  146.2   0.6106   0.6    7.4	GRS 1758-258
274.0179 -14.1298    4.7  42.5  128.8   2.8433   2.4    5.6	GX 17+2
276.0199 -30.2303    5.1  51.0  147.8   3.5985   2.3    9.6	H1820-303
262.9848 -33.8327   71.1  44.6  161.0   0.1323   0.2    0.2	GX 354-0
212.9303  54.2136    2.8  55.4    0.8   4.5106   4.2 ------	UNKNOWN
211.7119  38.3528    2.8  42.1  -10.9   1.7996   4.2 ------	UNKNOWN
213.7403  19.3498    2.4  26.7  -31.5   1.5987   4.8 ------	UNKNOWN
236.4053 -52.6599    2.6  54.3 -166.0   4.8793   4.4 ------	UNKNOWN
190.3825  47.7504    2.8  59.6  -17.0   9.7949   4.1 ------	UNKNOWN
185.5466  40.8502    5.3  58.8  -25.9   5.4944   2.2 ------	UNKNOWN
Pre-slew background subtracted image of 15-350 keV band
Time interval of the image:
0.000000 0.560000

# RAcent  DECcent POSerr Theta    Phi  PeakCts   SNR AngSep     Name
#  [deg]    [deg]    ['] [deg]  [deg]                   [']
244.8827 -15.8274    0.0  20.4  164.9   0.0238   1.8   12.5	Sco X-1
254.4445  35.4434   11.0  38.7   42.5   0.0281   1.1    6.1	Her X-1
255.9718 -37.9397    6.9  44.4  171.0   0.0433   1.7    5.8	4U 1700-377
256.2828 -36.4067   34.6  43.3  169.5   0.0082   0.3    7.4	GX 349+2
262.9088 -24.8890    8.5  38.5  151.2  -0.0312  -1.4   10.2	GX 1+4
264.7400 -44.4580  349.2  53.6  168.9  -0.0019  -0.0    0.5	4U 1735-44
268.2864  -1.3463    5.3  34.2  110.5  -0.0624  -2.2    8.0	SW J1753.5-0127
270.2671 -25.1989    4.4  44.1  145.7  -0.0896  -2.6    7.2	GX 5-1
270.1950 -25.8190    3.9  44.3  146.5  -0.1040  -3.0    7.4	GRS 1758-258
273.9533 -14.1911    4.7  42.5  128.9   0.1066   2.4    9.8	GX 17+2
275.8597 -30.2606    4.4  50.9  148.0  -0.1876  -2.7    7.2	H1820-303
263.0702 -33.7138    4.7  44.6  160.8  -0.0738  -2.5    8.3	GX 354-0
275.3409 -31.7379    2.5  51.3  149.9   0.3294   4.6 ------	UNKNOWN
256.2699  17.3337    0.8  26.8   68.5   0.2469  13.6 ------	UNKNOWN
200.5537  40.0148    2.1  49.0  -18.5   0.1348   5.6 ------	UNKNOWN
Post-slew image of 15-350 keV band
Time interval of the image:
63.684590 962.212800

# RAcent  DECcent POSerr Theta    Phi  PeakCts   SNR AngSep     Name
#  [deg]    [deg]    ['] [deg]  [deg]                   [']
244.9829 -15.6415    0.2  34.8 -152.9  57.1905  53.8    0.2	Sco X-1
254.5221  35.2459    1.8  18.0    3.3   5.7215   6.5    6.6	Her X-1
256.0763 -37.7680    4.1  55.1 -172.0  10.3430   2.8    6.2	4U 1700-377
256.4047 -36.5068    4.3  53.8 -172.3   8.1180   2.7    5.2	GX 349+2
263.1230 -24.6872   11.2  42.5  178.6   1.5756   1.0    7.1	GX 1+4
268.3680  -1.4526   28.3  22.3  154.1   0.4102   0.4    0.0	SW J1753.5-0127
270.3052 -25.1359    3.7  44.6  169.6   6.5202   3.1    3.6	GX 5-1
270.4061 -25.5712    0.0  45.0  169.7   1.1416   0.5   11.7	GRS 1758-258
273.8701 -13.9226    3.7  35.8  157.6   5.2419   3.1   10.4	GX 17+2
276.0385 -30.3629    9.3  51.3  165.9   4.1918   1.2    5.9	H1820-303
284.9164 -24.9279    6.9  50.6  153.6   6.7793   1.7    6.5	HT1900.1-2455
288.6523  11.0689    0.0  32.0  104.7   4.3392   2.6   11.3	GRS 1915+105
262.9723 -33.8600    5.5  51.6 -179.3   5.8500   2.1    1.7	GX 354-0
297.4281  25.2991    3.8  39.0   78.8  10.3637   3.0 ------	UNKNOWN
280.5891  71.2252    5.3  55.8   17.1  12.7912   2.2 ------	UNKNOWN
271.2857 -24.1218    2.5  44.0  167.9   9.5412   4.6 ------	UNKNOWN
264.5920   5.2945    2.6  14.5  152.6   4.0118   4.5 ------	UNKNOWN
246.7178  70.8972    3.5  53.9    4.0   9.6093   3.4 ------	UNKNOWN
253.4304  41.1297    2.7  23.9    2.6   3.5914   4.2 ------	UNKNOWN
237.0298  40.9396    2.4  28.8  -23.2   4.6893   4.8 ------	UNKNOWN
200.9012  63.8810    2.3  59.6  -17.0  32.8276   4.9 ------	UNKNOWN
	UNKNOWN
Plot creation:
Tue Oct 25 11:35:40 EDT 2016