Estimated redshift from machine learning (Ukwatta et al. 2016) - may take a few minute to calcaulte
Image
Pre-slew 15.0-350.0 keV image (Event data)

#   RAcent    DECcent   POSerr    Theta     Phi              Peak Cts       SNR   Name
   71.9222   -57.2606   0.0060    17.9415   129.4193         1.0221112     31.904 TRIG_00714404

Foreground time interval of the image:
 -0.216   3.104 (delta_t =   3.320 [sec])
Background time interval of the image:
-214.527  -0.216 (delta_t = 214.311 [sec])
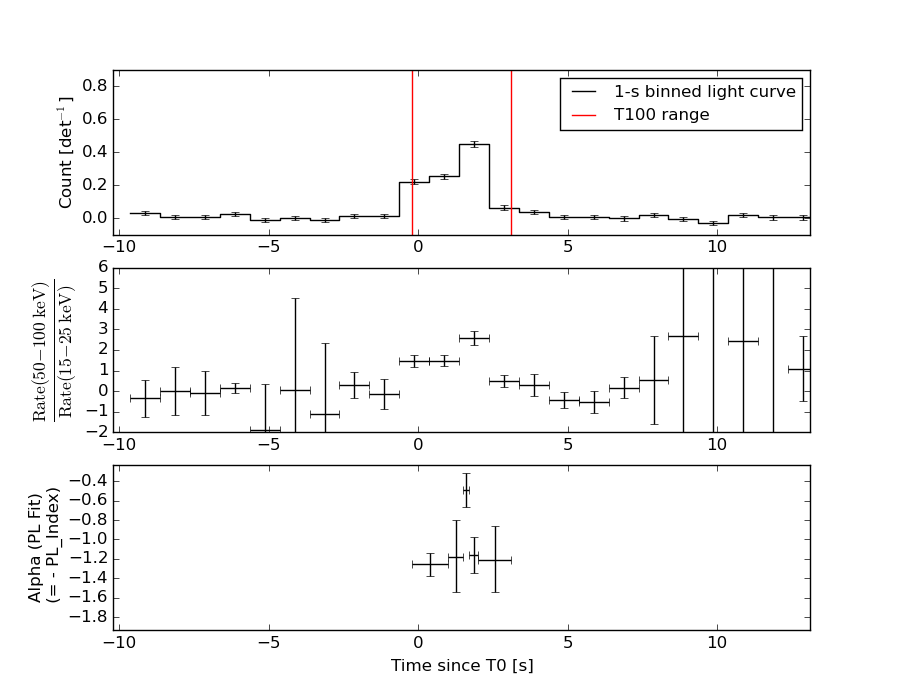
Lightcurves
Notes:
- 1) The mask-weighted light curves are using the flight position.
- 2) Multiple plots of different time binning/intervals are shown to cover all scenarios of short/long GRBs, rate/image triggers, and real/false positives.
- 3) For all the mask-weighted lightcurves, the y-axis units are counts/sec/det where a det is 0.4 x 0.4 = 0.16 sq cm.
- 4) The verticle lines correspond to following: green dotted lines are T50 interval, black dotted lines are T90 interval, blue solid line(s) is a spacecraft slew start time, and orange solid line(s) is a spacecraft slew end time.
- 5) Time of each bin is in the middle of the bin.
1 s binning
From T0-310 s to T0+310 s
From T100_start - 20 s to T100_end + 30 s
Full time interval

64 ms binning
Full time interval

From T100_start to T100_end
From T0-5 sec to T0+5 sec

16 ms binning
From T100_start-5 s to T100_start+5 s
Blue+Cyan dotted lines: Time interval of the scaled map
From 0.000000 to 0.064000
8 ms binning
From T100_start-3 s to T100_start+3 s
Blue+Cyan dotted lines: Time interval of the scaled map
From 0.000000 to 0.064000
2 ms binning
From T100_start-1 s to T100_start+1 s

Blue+Cyan dotted lines: Time interval of the scaled map
From 0.000000 to 0.064000
SN=5 or 10 sec. binning (whichever binning is satisfied first)
SN=5 or 10 sec. binning (T < 200 sec)
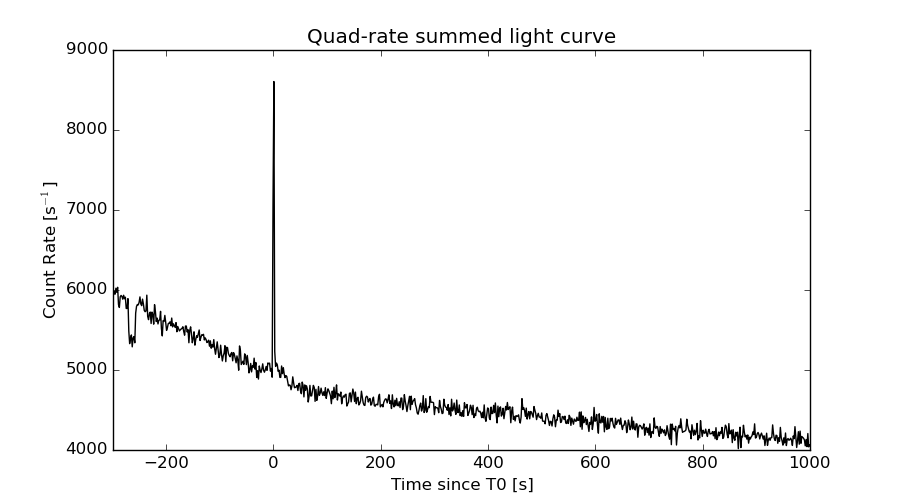
Quad-rate summed light curves (from T0-300s to T0+1000s)
Spectral Evolution
Spectra
Notes:
- 1) The fitting includes the systematic errors.
- 2) When the burst includes telescope slew time periods, the fitting uses an average response file made from multiple 5-s response files through out the slew time plus single time preiod for the non-slew times, and weighted by the total counts in the corresponding time period using addrmf. An average response file is needed becuase a spectral fit using the pre-slew DRM will introduce some errors in both a spectral shape and a normalization if the PHA file contains a lot of the slew/post-slew time interval.
- 3) For fits to more complicated models (e.g. a power-law over a cutoff power-law), the BAT team has decided to require a chi-square improvement of more than 6 for each extra dof.
Time averaged spectrum fit using the average DRM
Power-law model

Time interval is from   -0.216 sec. to    3.104 sec.

Spectral model in power-law:
------------------------------------------------------------
Parameters  : value       lower 90%   higher 90%
Photon index: 1.07321     ( -0.0909707   0.0899988 )
Norm@50keV  : 1.96759E-02    ( -0.000995582   0.00099443 )
------------------------------------------------------------
#Fit statistic : Chi-Squared =          56.46 using 59 PHA bins.
# Reduced chi-squared =         0.9905 for     57 degrees of freedom
# Null hypothesis probability =   4.952590e-01

Photon flux (15-150 keV)    in 3.32 sec: 2.27672 ( -0.11827  0.11842 ) ph/cm2/s
Energy fluence (15-150 keV)             : 6.89013e-07 ( -3.82869e-08  3.84287e-08 ) ergs/cm2
Cutoff power-law model

Time interval is from   -0.216 sec. to    3.104 sec.
Spectral model in the cutoff power-law:
------------------------------------------------------------
Parameters  : value       lower 90%   higher 90%
Photon index: 0.841266     ( -0.365882   0.270594 )
Epeak [keV] : 282.469      ( -282.469 -282.469 )
Norm@50keV  : 2.50506E-02    ( -0.00596744   0.0111194 )
------------------------------------------------------------
#Fit statistic : Chi-Squared =          55.10 using 59 PHA bins.
# Reduced chi-squared =         0.9839 for     56 degrees of freedom
# Null hypothesis probability =   5.089405e-01

Photon flux (15-150 keV)    in 3.32 sec: 2.25247 ( -0.12346  0.12339 ) ph/cm2/s
Energy fluence (15-150 keV)             : 6.80125e-07 ( -4.08938e-08  4.06637e-08 ) ergs/cm2
Band function

Time interval is from   -0.216 sec. to    3.104 sec.


Spectral model in the Band function:
------------------------------------------------------------
Parameters  : value       lower 90%   higher 90%
alpha       :    (     )
beta        :     (     )
Epeak [keV] :       (   )
Norm@50keV   :     (     )
------------------------------------------------------------

Photon flux (15-150 keV)    in  sec:  (    ) ph/cm2/s
Energy fluence (15-150 keV)             : 0 ( 0  0 ) ergs/cm2
Single BB

Spectral model blackbody:
------------------------------------------------------------
Parameters  : value    Lower 90%  Upper 90%
kT [keV]    : 21.1272  (  )
R^2/D10^2   : 9.01121E-02  (   )
(R is the radius in km and D10 is the distance to the source in units of 10 kpc)
------------------------------------------------------------
#Fit statistic : Chi-Squared =         118.65 using 59 PHA bins.
# Reduced chi-squared =         2.0816 for     57 degrees of freedom
# Null hypothesis probability =   3.167868e-06

Energy  Fluence     90% Error
[keV]   [erg/cm2]   [erg/cm2]
15- 25  2.516e-08   2.795e-09
25- 50  1.298e-07   1.046e-08
50-150  4.321e-07   3.503e-08
15-150  5.871e-07   3.801e-08
Thermal bremsstrahlung (OTTB)
Spectral model: thermal bremsstrahlung
------------------------------------------------------------
Parameters  : value         Lower 90%    Upper 90%
kT [keV]    : 199.362       (      )
Norm        : 9.34970       (     )
------------------------------------------------------------
#Fit statistic : Chi-Squared =         131.62 using 59 PHA bins.
# Reduced chi-squared =         2.3092 for     57 degrees of freedom
# Null hypothesis probability =   7.770599e-08

Energy  Fluence     90% Error
[keV]   [erg/cm2]   [erg/cm2]
15- 25  7.730e-08   4.499e-09
25- 50  1.487e-07   8.549e-09
50-150  3.261e-07   6.125e-08
15-150  5.521e-07   3.835e-08
Double BB

Spectral model: bbodyrad<1> + bbodyrad<2>
------------------------------------------------------------
Parameters  : value         Lower 90%    Upper 90%
kT1 [keV]   : 7.69995        (-1.71077      2.18566)
R1^2/D10^2  : 1.20101        (-0.626567      1.56725)
kT2 [keV]   : 31.8630        (-4.83851      8.93332)
R2^2/D10^2  : 2.13515E-02    (-0.0116573   0.0156596)
------------------------------------------------------------
#Fit statistic : Chi-Squared =          55.80 using 59 PHA bins.
# Reduced chi-squared =          1.015 for     55 degrees of freedom
# Null hypothesis probability =   4.443703e-01

Energy  Fluence     90% Error
[keV]   [erg/cm2]   [erg/cm2]
15- 25  5.233e-08   1.122e-08
25- 50  1.364e-07   2.336e-08
50-150  4.943e-07   8.997e-08
15-150  6.830e-07   1.283e-07
Peak spectrum fit
Power-law model

Time interval is from    1.368 sec. to    2.368 sec.

Spectral model in power-law:
------------------------------------------------------------
Parameters  : value       lower 90%   higher 90%
Photon index: 0.805855     ( -0.121423   0.118801 )
Norm@50keV  : 2.99534E-02    ( -0.00204729   0.00203469 )
------------------------------------------------------------
#Fit statistic : Chi-Squared =          38.47 using 59 PHA bins.
# Reduced chi-squared =         0.6749 for     57 degrees of freedom
# Null hypothesis probability =   9.716330e-01

Photon flux (15-150 keV)    in 1 sec: 3.44189 ( -0.23062  0.23092 ) ph/cm2/s
Energy fluence (15-150 keV)             : 3.49213e-07 ( -2.49257e-08  2.50268e-08 ) ergs/cm2
Cutoff power-law model
Time interval is from    1.368 sec. to    2.368 sec.
Spectral model in the cutoff power-law:
------------------------------------------------------------
Parameters  : value       lower 90%   higher 90%
Photon index: 0.571857     ( -0.505969   0.339077 )
Epeak [keV] : 375.703      ( -375.703 -375.703 )
Norm@50keV  : 3.74240E-02    ( -0.00894768   0.0217847 )
------------------------------------------------------------
#Fit statistic : Chi-Squared =          37.71 using 59 PHA bins.
# Reduced chi-squared =         0.6735 for     56 degrees of freedom
# Null hypothesis probability =   9.711313e-01

Photon flux (15-150 keV)    in 1 sec: 3.40940 ( -0.23931  0.23908 ) ph/cm2/s
Energy fluence (15-150 keV)             : 3.4641e-07 ( -2.5879e-08  2.57503e-08 ) ergs/cm2
Band function

Time interval is from    1.368 sec. to    2.368 sec.


Spectral model in the Band function:
------------------------------------------------------------
Parameters  : value       lower 90%   higher 90%
alpha       :    (     )
beta        :     (     )
Epeak [keV] :       (   )
Norm@50keV   :     (     )
------------------------------------------------------------

Photon flux (15-150 keV)    in  sec:  (    ) ph/cm2/s
Energy fluence (15-150 keV)             : 0 ( 0  0 ) ergs/cm2
Single BB

Spectral model blackbody:
------------------------------------------------------------
Parameters  : value    Lower 90%  Upper 90%
kT [keV]    : 26.3444  (-2.42174  2.80281)
R^2/D10^2   : 7.48421E-02  (-0.0190445   0.0246469)
(R is the radius in km and D10 is the distance to the source in units of 10 kpc)
------------------------------------------------------------
#Fit statistic : Chi-Squared =          63.98 using 59 PHA bins.
# Reduced chi-squared =          1.122 for     57 degrees of freedom
# Null hypothesis probability =   2.448703e-01

Energy  Fluence     90% Error
[keV]   [erg/cm2]   [erg/cm2]
15- 25  8.770e-09   1.217e-09
25- 50  5.106e-08   5.485e-09
50-150  2.603e-07   2.730e-08
15-150  3.202e-07   2.910e-08
Thermal bremsstrahlung (OTTB)

Spectral model: thermal bremsstrahlung
------------------------------------------------------------
Parameters  : value         Lower 90%    Upper 90%
kT [keV]    : 199.363       (      )
Norm        : 13.4212       (     )
------------------------------------------------------------
#Fit statistic : Chi-Squared =         141.03 using 59 PHA bins.
# Reduced chi-squared =         2.4742 for     57 degrees of freedom
# Null hypothesis probability =   4.507833e-09

Energy  Fluence     90% Error
[keV]   [erg/cm2]   [erg/cm2]
15- 25  3.342e-08   3.125e-09
25- 50  6.429e-08   1.318e-08
50-150  1.410e-07   5.256e-08
15-150  2.387e-07   7.105e-08
Double BB

Spectral model: bbodyrad<1> + bbodyrad<2>
------------------------------------------------------------
Parameters  : value         Lower 90%    Upper 90%
kT1 [keV]   : 6.97808        (-2.2044      3.23675)
R1^2/D10^2  : 1.84789        (-1.28045      5.6197)
kT2 [keV]   : 34.1882        (-5.17058      9.63798)
R2^2/D10^2  : 3.21555E-02    (-0.0169025   0.0208922)
------------------------------------------------------------
#Fit statistic : Chi-Squared =          36.61 using 59 PHA bins.
# Reduced chi-squared =         0.6657 for     55 degrees of freedom
# Null hypothesis probability =   9.733800e-01

Energy  Fluence     90% Error
[keV]   [erg/cm2]   [erg/cm2]
15- 25  1.981e-08   8.733e-09
25- 50  5.467e-08   1.512e-08
50-150  2.751e-07   5.675e-08
15-150  3.496e-07   7.310e-08
Pre-slew spectrum (Pre-slew PHA with pre-slew DRM)
Power-law model

Spectral model in power-law:
------------------------------------------------------------
Parameters  : value       lower 90%   higher 90%
Photon index: 1.07321     ( -0.0909707   0.0899988 )
Norm@50keV  : 1.96759E-02    ( -0.000995582   0.00099443 )
------------------------------------------------------------
#Fit statistic : Chi-Squared =          56.46 using 59 PHA bins.
# Reduced chi-squared =         0.9905 for     57 degrees of freedom
# Null hypothesis probability =   4.952590e-01

Photon flux (15-150 keV)    in 3.32 sec: 2.27671 ( -0.118258  0.118431 ) ph/cm2/s
Energy fluence (15-150 keV)             : 6.88923e-07 ( -3.82829e-08  3.84476e-08 ) ergs/cm2
Cutoff power-law model

Spectral model in the cutoff power-law:
------------------------------------------------------------
Parameters  : value       lower 90%   higher 90%
Photon index: 0.841266     ( -0.365881   0.270595 )
Epeak [keV] : 282.468      ( -282.469 -282.469 )
Norm@50keV  : 2.50506E-02    ( -0.00596745   0.0111194 )
------------------------------------------------------------
#Fit statistic : Chi-Squared =          55.10 using 59 PHA bins.
# Reduced chi-squared =         0.9839 for     56 degrees of freedom
# Null hypothesis probability =   5.089405e-01

Photon flux (15-150 keV)    in 3.32 sec: 2.25235 ( -0.12343  0.12337 ) ph/cm2/s
Energy fluence (15-150 keV)             : 6.80434e-07 ( -4.09489e-08  4.06866e-08 ) ergs/cm2
Band function
Spectral model in the Band function:
------------------------------------------------------------
Parameters  : value       lower 90%   higher 90%
alpha       :    (     )
beta        :     (     )
Epeak [keV] :       (   )
Norm@50keV   :     (     )
------------------------------------------------------------

Photon flux (15-150 keV)    in  sec:  (    ) ph/cm2/s
Energy fluence (15-150 keV)             : 0 ( 0  0 ) ergs/cm2
S(25-50 keV) vs. S(50-100 keV) plot

S(25-50 keV)  = 1.34e-07
S(50-100 keV) = 2.54e-07
T90 vs. Hardness ratio plot

T90                                   = 2.59999996423721 sec.
Hardness ratio (energy fluence ratio) = 1.89552
Color vs. Color plot

Count Ratio  (25-50 keV) / (15-25 keV) = 1.73697
Count Ratio (50-100 keV) / (15-25 keV) = 1.7988
Mask shadow pattern

IMX = -2.056050893533265E-01, IMY = -2.501358602615859E-01
TIME vs. PHA plot around the trigger time

Blue+Cyan dotted lines: Time interval of the scaled map
From 0.000000 to 0.064000
TIME vs. DetID plot around the trigger time

Blue+Cyan dotted lines: Time interval of the scaled map
From 0.000000 to 0.064000
100 us light curve (15-350 keV)

Blue+Cyan dotted lines: Time interval of the scaled map
From 0.000000 to 0.064000
Spacecraft aspect plot

Bright source in the pre-burst/pre-slew/post-slew images
Pre-burst image of 15-350 keV band
Time interval of the image:
-214.527400 -0.216000

# RAcent  DECcent POSerr Theta    Phi  PeakCts   SNR AngSep     Name
#  [deg]    [deg]    ['] [deg]  [deg]                   [']
135.3659 -40.6237    6.0  36.0 -128.5  -0.7225  -1.9    8.5	Vela X-1
170.3698 -60.6875    2.2  29.0  -73.8   1.6881   5.2    4.2	Cen X-3
186.5640 -62.7399    1.6  32.1  -59.4   2.4872   7.3    3.1	GX 301-2
111.3227 -21.4860    2.2  50.7 -163.8   3.0259   5.3 ------	UNKNOWN
152.3614 -58.2989    2.5  25.3  -92.8   1.3863   4.7 ------	UNKNOWN
218.6153 -50.8879    2.6  50.6  -44.5   5.5692   4.4 ------	UNKNOWN
Pre-slew background subtracted image of 15-350 keV band
Time interval of the image:
-0.216000 3.104000

# RAcent  DECcent POSerr Theta    Phi  PeakCts   SNR AngSep     Name
#  [deg]    [deg]    ['] [deg]  [deg]                   [']
135.4497 -40.5826    7.1  36.1 -128.4   0.0695   1.6    4.0	Vela X-1
170.5279 -60.7258    4.2  29.0  -73.6   0.1073   2.7    8.8	Cen X-3
186.7165 -62.7671  186.7  32.1  -59.2  -0.0024  -0.1    1.7	GX 301-2
 71.9222 -57.2606    0.4  17.9  129.4   1.0221  31.9 ------	UNKNOWN
221.0546 -58.2232    2.2  44.3  -39.1   0.2703   5.3 ------	UNKNOWN
212.0887 -52.7779    2.7  47.3  -48.6   0.3848   4.3 ------	UNKNOWN
168.5659 -46.1553    3.1  40.8  -89.1   0.4077   3.8 ------	UNKNOWN
Post-slew image of 15-350 keV band
Time interval of the image:
48.872590 962.450000

# RAcent  DECcent POSerr Theta    Phi  PeakCts   SNR AngSep     Name
#  [deg]    [deg]    ['] [deg]  [deg]                   [']
 27.5949 -44.9694    3.6  29.8   71.6   3.2349   3.2 ------	UNKNOWN
258.9197 -71.1092    3.1  51.5  -20.6   5.6619   3.7 ------	UNKNOWN
264.1302 -62.9097    3.6  59.4  -17.1  13.0266   3.2 ------	UNKNOWN
128.7531 -32.6642    3.5  45.3 -121.3   8.2067   3.3 ------	UNKNOWN
Plot creation:
Tue Oct 25 11:34:21 EDT 2016