Estimated redshift from machine learning (Ukwatta et al. 2016) - may take a few minute to calcaulte
Image
Pre-slew 15.0-350.0 keV image (Event data)

#   RAcent    DECcent   POSerr    Theta     Phi              Peak Cts       SNR   Name
  103.4055    23.2858   0.0121    18.1943    47.1863         1.2365275     15.860 TRIG_00716127

Foreground time interval of the image:
 18.224  72.701 (delta_t =  54.477 [sec])
Background time interval of the image:
-239.000  18.224 (delta_t = 257.224 [sec])
Lightcurves
Notes:
- 1) The mask-weighted light curves are using the flight position.
- 2) Multiple plots of different time binning/intervals are shown to cover all scenarios of short/long GRBs, rate/image triggers, and real/false positives.
- 3) For all the mask-weighted lightcurves, the y-axis units are counts/sec/det where a det is 0.4 x 0.4 = 0.16 sq cm.
- 4) The verticle lines correspond to following: green dotted lines are T50 interval, black dotted lines are T90 interval, blue solid line(s) is a spacecraft slew start time, and orange solid line(s) is a spacecraft slew end time.
- 5) Time of each bin is in the middle of the bin.
1 s binning
From T0-310 s to T0+310 s

From T100_start - 20 s to T100_end + 30 s

Full time interval

64 ms binning
Full time interval

From T100_start to T100_end
From T0-5 sec to T0+5 sec
16 ms binning
From T100_start-5 s to T100_start+5 s

Blue+Cyan dotted lines: Time interval of the scaled map
From 0.000000 to 64.000000
8 ms binning
From T100_start-3 s to T100_start+3 s

Blue+Cyan dotted lines: Time interval of the scaled map
From 0.000000 to 64.000000
2 ms binning
From T100_start-1 s to T100_start+1 s

Blue+Cyan dotted lines: Time interval of the scaled map
From 0.000000 to 64.000000
SN=5 or 10 sec. binning (whichever binning is satisfied first)

SN=5 or 10 sec. binning (T < 200 sec)

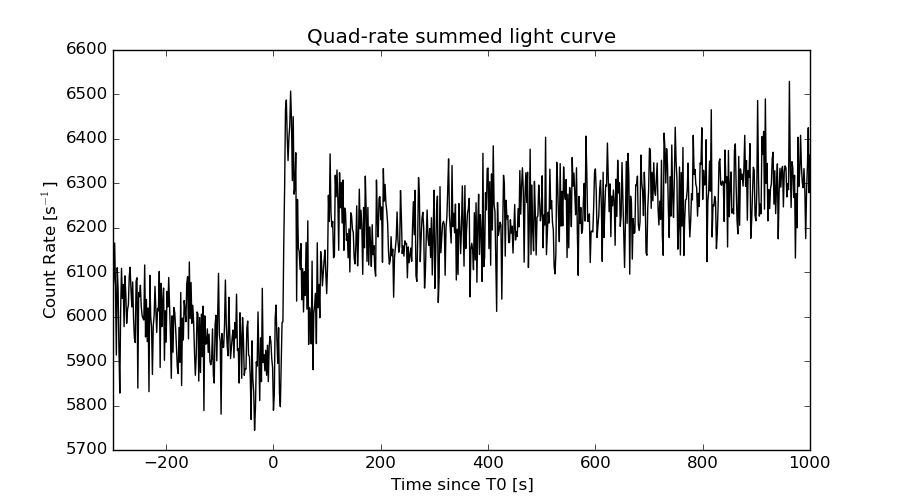
Quad-rate summed light curves (from T0-300s to T0+1000s)
Spectral Evolution

Spectra
Notes:
- 1) The fitting includes the systematic errors.
- 2) When the burst includes telescope slew time periods, the fitting uses an average response file made from multiple 5-s response files through out the slew time plus single time preiod for the non-slew times, and weighted by the total counts in the corresponding time period using addrmf. An average response file is needed becuase a spectral fit using the pre-slew DRM will introduce some errors in both a spectral shape and a normalization if the PHA file contains a lot of the slew/post-slew time interval.
- 3) For fits to more complicated models (e.g. a power-law over a cutoff power-law), the BAT team has decided to require a chi-square improvement of more than 6 for each extra dof.
Time averaged spectrum fit using the average DRM
Power-law model

Time interval is from   18.224 sec. to  261.184 sec.

Spectral model in power-law:
------------------------------------------------------------
Parameters  : value       lower 90%   higher 90%
Photon index: 1.45493     ( -0.183889   0.18404 )
Norm@50keV  : 5.67576E-04    ( -6.22797e-05   6.19563e-05 )
------------------------------------------------------------
#Fit statistic : Chi-Squared =          58.73 using 59 PHA bins.
# Reduced chi-squared =          1.030 for     57 degrees of freedom
# Null hypothesis probability =   4.120149e-01

Photon flux (15-150 keV)    in 243 sec: 7.00334E-02 ( -0.0075941  0.0076029 ) ph/cm2/s
Energy fluence (15-150 keV)             : 1.31876e-06 ( -1.59113e-07  1.60914e-07 ) ergs/cm2
Cutoff power-law model

Time interval is from   18.224 sec. to  261.184 sec.
Spectral model in the cutoff power-law:
------------------------------------------------------------
Parameters  : value       lower 90%   higher 90%
Photon index: 1.12975     ( -0.82794   0.478398 )
Epeak [keV] : 127.778      ( -62.5968 -127.806 )
Norm@50keV  : 8.43450E-04    ( -0.000355738   0.00144174 )
------------------------------------------------------------
#Fit statistic : Chi-Squared =          58.12 using 59 PHA bins.
# Reduced chi-squared =          1.038 for     56 degrees of freedom
# Null hypothesis probability =   3.971623e-01

Photon flux (15-150 keV)    in 243 sec: 6.91640E-02 ( -0.0078485  0.0078314 ) ph/cm2/s
Energy fluence (15-150 keV)             : 1.27899e-06 ( -1.84158e-07  1.81697e-07 ) ergs/cm2
Band function

Time interval is from   18.224 sec. to  261.184 sec.


Spectral model in the Band function:
------------------------------------------------------------
Parameters  : value       lower 90%   higher 90%
alpha       :    (     )
beta        :     (     )
Epeak [keV] :       (   )
Norm@50keV   :     (     )
------------------------------------------------------------

Photon flux (15-150 keV)    in  sec:  (    ) ph/cm2/s
Energy fluence (15-150 keV)             : 0 ( 0  0 ) ergs/cm2
Single BB

Spectral model blackbody:
------------------------------------------------------------
Parameters  : value    Lower 90%  Upper 90%
kT [keV]    : 13.8173  (-1.84365  2.24774)
R^2/D10^2   : 1.06383E-02  (-0.00440341   0.00710572)
(R is the radius in km and D10 is the distance to the source in units of 10 kpc)
------------------------------------------------------------
#Fit statistic : Chi-Squared =          75.91 using 59 PHA bins.
# Reduced chi-squared =          1.332 for     57 degrees of freedom
# Null hypothesis probability =   4.777007e-02

Energy  Fluence     90% Error
[keV]   [erg/cm2]   [erg/cm2]
15- 25  1.044e-07   2.284e-08
25- 50  3.831e-07   5.747e-08
50-150  4.783e-07   1.073e-07
15-150  9.658e-07   1.423e-07
Thermal bremsstrahlung (OTTB)

Spectral model: thermal bremsstrahlung
------------------------------------------------------------
Parameters  : value         Lower 90%    Upper 90%
kT [keV]    : 200.000       (-64.1807      -200)
Norm        : 0.288028       (-0.0306739     0.0306739)
------------------------------------------------------------
#Fit statistic : Chi-Squared =          58.66 using 59 PHA bins.
# Reduced chi-squared =          1.029 for     57 degrees of freedom
# Null hypothesis probability =   4.144217e-01

Energy  Fluence     90% Error
[keV]   [erg/cm2]   [erg/cm2]
15- 25  1.743e-07   9.726e-08
25- 50  3.353e-07   1.669e-07
50-150  7.354e-07   4.053e-07
15-150  1.245e-06   5.990e-07
Double BB

Spectral model: bbodyrad<1> + bbodyrad<2>
------------------------------------------------------------
Parameters  : value         Lower 90%    Upper 90%
kT1 [keV]   : 8.41750        (-2.31011      2.59108)
R1^2/D10^2  : 4.35718E-02        (-0.0185289      0.0421508)
kT2 [keV]   : 34.0198        (-19.1821      -43.5625)
R2^2/D10^2  : 3.24788E-04    (-0.000142277   0.000919406)
------------------------------------------------------------
#Fit statistic : Chi-Squared =          54.96 using 59 PHA bins.
# Reduced chi-squared =         0.9992 for     55 degrees of freedom
# Null hypothesis probability =   4.762241e-01

Energy  Fluence     90% Error
[keV]   [erg/cm2]   [erg/cm2]
15- 25  1.537e-07   8.596e-08
25- 50  3.535e-07   1.673e-07
50-150  7.402e-07   4.074e-07
15-150  1.247e-06   6.197e-07
Peak spectrum fit
Power-law model

Time interval is from   33.808 sec. to   34.808 sec.

Spectral model in power-law:
------------------------------------------------------------
Parameters  : value       lower 90%   higher 90%
Photon index: 0.865250     ( -0.583367   0.505675 )
Norm@50keV  : 3.41542E-03    ( -0.00107558   0.00102948 )
------------------------------------------------------------
#Fit statistic : Chi-Squared =          54.57 using 59 PHA bins.
# Reduced chi-squared =         0.9574 for     57 degrees of freedom
# Null hypothesis probability =   5.667824e-01

Photon flux (15-150 keV)    in 1 sec: 0.391998 ( -0.118036  0.119756 ) ph/cm2/s
Energy fluence (15-150 keV)             : 3.88624e-08 ( -1.16379e-08  1.17667e-08 ) ergs/cm2
Cutoff power-law model

Time interval is from   33.808 sec. to   34.808 sec.
Spectral model in the cutoff power-law:
------------------------------------------------------------
Parameters  : value       lower 90%   higher 90%
Photon index: 0.411647     ( -2.99235   -0.41165 )
Epeak [keV] : 212.229      ( -212.23 -212.23 )
Norm@50keV  : 5.28378E-03    ( -0.00282161   0.0626285 )
------------------------------------------------------------
#Fit statistic : Chi-Squared =          54.41 using 59 PHA bins.
# Reduced chi-squared =         0.9716 for     56 degrees of freedom
# Null hypothesis probability =   5.352159e-01

Photon flux (15-150 keV)    in 1 sec: 0.384124 ( -0.122694  0.123749 ) ph/cm2/s
Energy fluence (15-150 keV)             : 3.8147e-08 ( -1.24099e-08  1.21405e-08 ) ergs/cm2
Band function

Time interval is from   33.808 sec. to   34.808 sec.


Spectral model in the Band function:
------------------------------------------------------------
Parameters  : value       lower 90%   higher 90%
alpha       :    (     )
beta        :     (     )
Epeak [keV] :       (   )
Norm@50keV   :     (     )
------------------------------------------------------------

Photon flux (15-150 keV)    in  sec:  (    ) ph/cm2/s
Energy fluence (15-150 keV)             : 0 ( 0  0 ) ergs/cm2
Single BB

Spectral model blackbody:
------------------------------------------------------------
Parameters  : value    Lower 90%  Upper 90%
kT [keV]    : 25.3567  (-8.48072  17.302)
R^2/D10^2   : 9.31923E-03  (-0.00931664   0.024091)
(R is the radius in km and D10 is the distance to the source in units of 10 kpc)
------------------------------------------------------------
#Fit statistic : Chi-Squared =          55.68 using 59 PHA bins.
# Reduced chi-squared =         0.9768 for     57 degrees of freedom
# Null hypothesis probability =   5.247538e-01

Energy  Fluence     90% Error
[keV]   [erg/cm2]   [erg/cm2]
15- 25  1.033e-09   6.650e-10
25- 50  5.903e-09   3.532e-09
50-150  2.808e-08   1.765e-08
15-150  3.502e-08   2.080e-08
Thermal bremsstrahlung (OTTB)

Spectral model: thermal bremsstrahlung
------------------------------------------------------------
Parameters  : value         Lower 90%    Upper 90%
kT [keV]    : 200.000       (-85.2754      -200)
Norm        : 1.61490       (-0.497937     0.497937)
------------------------------------------------------------
#Fit statistic : Chi-Squared =          59.43 using 59 PHA bins.
# Reduced chi-squared =          1.043 for     57 degrees of freedom
# Null hypothesis probability =   3.870983e-01

Energy  Fluence     90% Error
[keV]   [erg/cm2]   [erg/cm2]
15- 25  4.024e-09   2.502e-09
25- 50  7.741e-09   4.796e-09
50-150  1.698e-08   1.046e-08
15-150  2.874e-08   1.751e-08
Double BB

Spectral model: bbodyrad<1> + bbodyrad<2>
------------------------------------------------------------
Parameters  : value         Lower 90%    Upper 90%
kT1 [keV]   : 9.24783        (-9.99917      -9.99917)
R1^2/D10^2  : 8.69701E-02        (-0.0775768      -0.0775768)
kT2 [keV]   : 34.8527        (-40.0653      -40.0653)
R2^2/D10^2  : 2.98291E-03    (-0.00205689   0.0203678)
------------------------------------------------------------
#Fit statistic : Chi-Squared =          54.34 using 59 PHA bins.
# Reduced chi-squared =         0.9881 for     55 degrees of freedom
# Null hypothesis probability =   4.996281e-01

Energy  Fluence     90% Error
[keV]   [erg/cm2]   [erg/cm2]
15- 25  1.982e-09   1.784e-09
25- 50  6.612e-09   3.811e-09
50-150  2.812e-08   1.732e-08
15-150  3.672e-08   2.042e-08
Pre-slew spectrum (Pre-slew PHA with pre-slew DRM)
Power-law model

Spectral model in power-law:
------------------------------------------------------------
Parameters  : value       lower 90%   higher 90%
Photon index: 1.14613     ( -0.148334   0.145241 )
Norm@50keV  : 1.68414E-03    ( -0.000138299   0.000138051 )
------------------------------------------------------------
#Fit statistic : Chi-Squared =          35.60 using 59 PHA bins.
# Reduced chi-squared =         0.6245 for     57 degrees of freedom
# Null hypothesis probability =   9.882662e-01

Photon flux (15-150 keV)    in 54.48 sec: 0.196315 ( -0.0167561  0.0168127 ) ph/cm2/s
Energy fluence (15-150 keV)             : 9.45637e-07 ( -8.40621e-08  8.44712e-08 ) ergs/cm2
Cutoff power-law model

Spectral model in the cutoff power-law:
------------------------------------------------------------
Parameters  : value       lower 90%   higher 90%
Photon index: 1.05953     ( -0.5713   0.219181 )
Epeak [keV] : 561.604      ( -608.307 -608.307 )
Norm@50keV  : 1.84841E-03    ( -0.000275886   0.00148389 )
------------------------------------------------------------
#Fit statistic : Chi-Squared =          35.54 using 59 PHA bins.
# Reduced chi-squared =         0.6347 for     56 degrees of freedom
# Null hypothesis probability =   9.850387e-01

Photon flux (15-150 keV)    in 54.48 sec: 0.195572 ( -0.017331  0.017263 ) ph/cm2/s
Energy fluence (15-150 keV)             : 9.41322e-07 ( -8.99029e-08  8.77945e-08 ) ergs/cm2
Band function

Spectral model in the Band function:
------------------------------------------------------------
Parameters  : value       lower 90%   higher 90%
alpha       :    (     )
beta        :     (     )
Epeak [keV] :       (   )
Norm@50keV   :     (     )
------------------------------------------------------------

Photon flux (15-150 keV)    in  sec:  (    ) ph/cm2/s
Energy fluence (15-150 keV)             : 0 ( 0  0 ) ergs/cm2
S(25-50 keV) vs. S(50-100 keV) plot

S(25-50 keV)  = 3.18e-07
S(50-100 keV) = 4.64e-07
T90 vs. Hardness ratio plot
T90                                   = 157.691999912262 sec.
Hardness ratio (energy fluence ratio) = 1.45912
Color vs. Color plot

Count Ratio  (25-50 keV) / (15-25 keV) = 1.60965
Count Ratio (50-100 keV) / (15-25 keV) = 0.957806
Mask shadow pattern

IMX = 2.233720345562097E-01, IMY = -2.411041783122516E-01
TIME vs. PHA plot around the trigger time

Blue+Cyan dotted lines: Time interval of the scaled map
From 0.000000 to 64.000000
TIME vs. DetID plot around the trigger time
Blue+Cyan dotted lines: Time interval of the scaled map
From 0.000000 to 64.000000
100 us light curve (15-350 keV)

Blue+Cyan dotted lines: Time interval of the scaled map
From 0.000000 to 64.000000
Spacecraft aspect plot

Bright source in the pre-burst/pre-slew/post-slew images
Pre-burst image of 15-350 keV band
Time interval of the image:
-239.000000 18.224000

# RAcent  DECcent POSerr Theta    Phi  PeakCts   SNR AngSep     Name
#  [deg]    [deg]    ['] [deg]  [deg]                   [']
 83.6276  22.0153    0.4  33.6   71.1  10.8997  27.1    0.3	Crab
 65.1426  60.3340    2.5  42.1  138.4   2.3860   4.7 ------	UNKNOWN
142.3073 -14.2501    3.9  54.4  -33.1   3.3618   3.0 ------	UNKNOWN
167.5538  29.0249    2.8  41.2 -100.1   3.8489   4.1 ------	UNKNOWN
Pre-slew background subtracted image of 15-350 keV band
Time interval of the image:
18.224000 72.700600

# RAcent  DECcent POSerr Theta    Phi  PeakCts   SNR AngSep     Name
#  [deg]    [deg]    ['] [deg]  [deg]                   [']
 83.6270  22.0126   20.2  33.6   71.0   0.0833   0.6    0.4	Crab
 95.1369   1.9423    2.0  40.2   33.8   0.8280   5.7 ------	UNKNOWN
103.4055  23.2859    0.7  18.2   47.2   1.2358  15.9 ------	UNKNOWN
Post-slew image of 15-350 keV band
Time interval of the image:
113.500590 963.039000

# RAcent  DECcent POSerr Theta    Phi  PeakCts   SNR AngSep     Name
#  [deg]    [deg]    ['] [deg]  [deg]                   [']
 83.6251  22.0209    0.2  18.3   84.9  35.0236  59.0    0.6	Crab
 75.5557   0.6974    2.0  35.2   49.0   5.0594   5.6 ------	UNKNOWN
 83.4693 -27.8031    2.5  54.6   16.6  11.6555   4.7 ------	UNKNOWN
 83.6566  13.5443    3.6  21.1   60.9   1.7638   3.2 ------	UNKNOWN
 93.5572  13.0097    3.7  13.9   38.9   1.6796   3.1 ------	UNKNOWN
148.6236  49.2389    4.2  43.8 -143.0   3.5261   2.7 ------	UNKNOWN
157.2602  40.2884    3.6  48.0 -129.1  12.0254   3.3 ------	UNKNOWN
Plot creation:
Sun Nov 20 14:32:27 EST 2016