Special notes of this burst
Image
Pre-slew 15.0-350.0 keV image (Event data)
#   RAcent    DECcent   POSerr    Theta     Phi              Peak Cts       SNR   Name
  332.6285     7.4688   0.0126    48.4925   156.9817         3.1135614     15.232 TRIG_00717500

Foreground time interval of the image:
 -6.532  23.189 (delta_t =  29.721 [sec])
Background time interval of the image:
-768.111 -750.032 (delta_t =  18.079 [sec])
-239.712  -6.532 (delta_t = 233.180 [sec])
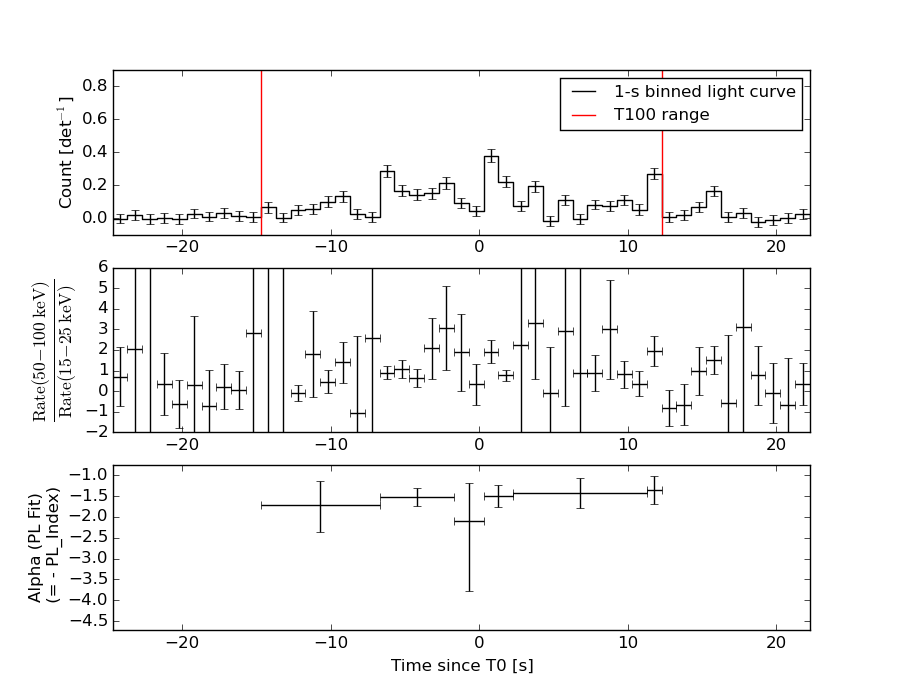
Lightcurves
Notes:
- 1) The mask-weighted light curves are using the flight position.
- 2) Multiple plots of different time binning/intervals are shown to cover all scenarios of short/long GRBs, rate/image triggers, and real/false positives.
- 3) For all the mask-weighted lightcurves, the y-axis units are counts/sec/det where a det is 0.4 x 0.4 = 0.16 sq cm.
- 4) The verticle lines correspond to following: green dotted lines are T50 interval, black dotted lines are T90 interval, blue solid line(s) is a spacecraft slew start time, and orange solid line(s) is a spacecraft slew end time.
- 5) Time of each bin is in the middle of the bin.
1 s binning
From T0-310 s to T0+310 s
From T100_start - 20 s to T100_end + 30 s

Full time interval

64 ms binning
Full time interval
From T100_start to T100_end
From T0-5 sec to T0+5 sec
16 ms binning
From T100_start-5 s to T100_start+5 s
Blue+Cyan dotted lines: Time interval of the scaled map
From 0.000000 to 1.408000
8 ms binning
From T100_start-3 s to T100_start+3 s
Blue+Cyan dotted lines: Time interval of the scaled map
From 0.000000 to 1.408000
2 ms binning
From T100_start-1 s to T100_start+1 s
Blue+Cyan dotted lines: Time interval of the scaled map
From 0.000000 to 1.408000
SN=5 or 10 sec. binning (whichever binning is satisfied first)
SN=5 or 10 sec. binning (T < 200 sec)
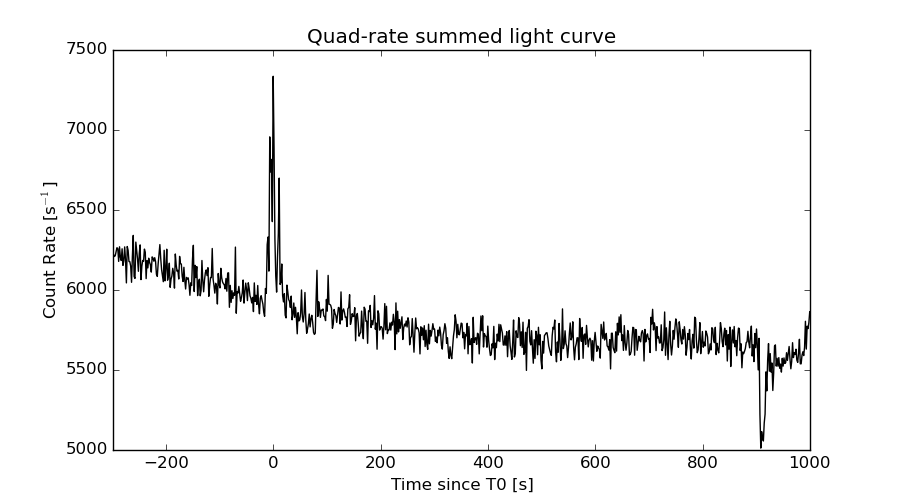
Quad-rate summed light curves (from T0-300s to T0+1000s)
Spectral Evolution
Spectra
Notes:
- 1) The fitting includes the systematic errors.
- 2) When the burst includes telescope slew time periods, the fitting uses an average response file made from multiple 5-s response files through out the slew time plus single time preiod for the non-slew times, and weighted by the total counts in the corresponding time period using addrmf. An average response file is needed becuase a spectral fit using the pre-slew DRM will introduce some errors in both a spectral shape and a normalization if the PHA file contains a lot of the slew/post-slew time interval.
- 3) For fits to more complicated models (e.g. a power-law over a cutoff power-law), the BAT team has decided to require a chi-square improvement of more than 6 for each extra dof.
Time averaged spectrum fit using the average DRM
Power-law model
Time interval is from  -14.712 sec. to   12.288 sec.

Spectral model in power-law:
------------------------------------------------------------
Parameters  : value       lower 90%   higher 90%
Photon index: 1.44255     ( -0.150998   0.150702 )
Norm@50keV  : 8.53269E-03    ( -0.000736701   0.000736651 )
------------------------------------------------------------
#Fit statistic : Chi-Squared =          59.12 using 59 PHA bins.
# Reduced chi-squared =          1.037 for     57 degrees of freedom
# Null hypothesis probability =   3.981323e-01

Photon flux (15-150 keV)    in 27 sec: 1.04963 ( -0.097561  0.09797 ) ph/cm2/s
Energy fluence (15-150 keV)             : 2.20792e-06 ( -2.01078e-07  2.01893e-07 ) ergs/cm2
Cutoff power-law model
Time interval is from  -14.712 sec. to   12.288 sec.
Spectral model in the cutoff power-law:
------------------------------------------------------------
Parameters  : value       lower 90%   higher 90%
Photon index: 1.18223     ( -0.656813   0.337651 )
Epeak [keV] : 175.218      ( -175.215 -175.215 )
Norm@50keV  : 1.12501E-02    ( -0.00333548   0.0107644 )
------------------------------------------------------------
#Fit statistic : Chi-Squared =          58.55 using 59 PHA bins.
# Reduced chi-squared =          1.046 for     56 degrees of freedom
# Null hypothesis probability =   3.819440e-01

Photon flux (15-150 keV)    in 27 sec: 1.03595 ( -0.102271  0.10251 ) ph/cm2/s
Energy fluence (15-150 keV)             : 1.0367e-06 ( -3.23104e-07  2.76386e-07 ) ergs/cm2
Band function

Time interval is from  -14.712 sec. to   12.288 sec.


Spectral model in the Band function:
------------------------------------------------------------
Parameters  : value       lower 90%   higher 90%
alpha       :    (     )
beta        :     (     )
Epeak [keV] :       (   )
Norm@50keV   :     (     )
------------------------------------------------------------

Photon flux (15-150 keV)    in  sec:  (    ) ph/cm2/s
Energy fluence (15-150 keV)             : 0 ( 0  0 ) ergs/cm2
Single BB
Spectral model blackbody:
------------------------------------------------------------
Parameters  : value    Lower 90%  Upper 90%
kT [keV]    : 17.8228  (-1.80975  2.07303)
R^2/D10^2   : 6.65121E-02  (-0.0213545   0.0304258)
(R is the radius in km and D10 is the distance to the source in units of 10 kpc)
------------------------------------------------------------
#Fit statistic : Chi-Squared =          85.91 using 59 PHA bins.
# Reduced chi-squared =          1.507 for     57 degrees of freedom
# Null hypothesis probability =   7.955656e-03

Energy  Fluence     90% Error
[keV]   [erg/cm2]   [erg/cm2]
15- 25  1.146e-07   2.007e-08
25- 50  5.259e-07   6.359e-08
50-150  1.210e-06   1.778e-07
15-150  1.850e-06   1.912e-07
Thermal bremsstrahlung (OTTB)

Spectral model: thermal bremsstrahlung
------------------------------------------------------------
Parameters  : value         Lower 90%    Upper 90%
kT [keV]    : 200.000       (-36.9436      -200)
Norm        : 4.37353       (-0.378545     0.378545)
------------------------------------------------------------
#Fit statistic : Chi-Squared =          61.04 using 59 PHA bins.
# Reduced chi-squared =          1.071 for     57 degrees of freedom
# Null hypothesis probability =   3.328430e-01

Energy  Fluence     90% Error
[keV]   [erg/cm2]   [erg/cm2]
15- 25  2.941e-07   3.205e-08
25- 50  5.656e-07   9.747e-08
50-150  1.241e-06   4.401e-07
15-150  2.100e-06   5.593e-07
Double BB
Spectral model: bbodyrad<1> + bbodyrad<2>
------------------------------------------------------------
Parameters  : value         Lower 90%    Upper 90%
kT1 [keV]   : 4.91840        (-1.44673      2.43537)
R1^2/D10^2  : 3.63642        (-2.86976      15.0154)
kT2 [keV]   : 22.8916        (-3.31635      5.57886)
R2^2/D10^2  : 2.49933E-02    (-0.013875   0.0193354)
------------------------------------------------------------
#Fit statistic : Chi-Squared =          58.33 using 59 PHA bins.
# Reduced chi-squared =          1.061 for     55 degrees of freedom
# Null hypothesis probability =   3.539437e-01

Energy  Fluence     90% Error
[keV]   [erg/cm2]   [erg/cm2]
15- 25  2.877e-07   1.351e-07
25- 50  4.877e-07   1.303e-07
50-150  1.366e-06   2.581e-07
15-150  2.141e-06   5.173e-07
Peak spectrum fit
Power-law model
Time interval is from    0.100 sec. to    1.100 sec.

Spectral model in power-law:
------------------------------------------------------------
Parameters  : value       lower 90%   higher 90%
Photon index: 1.79265     ( -0.264904   0.286538 )
Norm@50keV  : 1.94843E-02    ( -0.00406971   0.00402973 )
------------------------------------------------------------
#Fit statistic : Chi-Squared =          74.30 using 59 PHA bins.
# Reduced chi-squared =          1.304 for     57 degrees of freedom
# Null hypothesis probability =   6.157380e-02

Photon flux (15-150 keV)    in 1 sec: 2.67750 ( -0.55071  0.55203 ) ph/cm2/s
Energy fluence (15-150 keV)             : 1.79444e-07 ( -3.77146e-08  3.77761e-08 ) ergs/cm2
Cutoff power-law model
Time interval is from    0.100 sec. to    1.100 sec.
Spectral model in the cutoff power-law:
------------------------------------------------------------
Parameters  : value       lower 90%   higher 90%
Photon index: -1.53209     ( -3.17133   1.82652 )
Epeak [keV] : 61.8734      ( -8.56466 9.46259 )
Norm@50keV  : 0.606419    ( -0.617995   8.15637 )
------------------------------------------------------------
#Fit statistic : Chi-Squared =          62.38 using 59 PHA bins.
# Reduced chi-squared =          1.114 for     56 degrees of freedom
# Null hypothesis probability =   2.598710e-01

Photon flux (15-150 keV)    in 1 sec: 2.56754 ( -0.58156  0.57518 ) ph/cm2/s
Energy fluence (15-150 keV)             : 1.97224e-07 ( -3.85302e-08  3.87314e-08 ) ergs/cm2
Band function

Time interval is from    0.100 sec. to    1.100 sec.


Spectral model in the Band function:
------------------------------------------------------------
Parameters  : value       lower 90%   higher 90%
alpha       :    (     )
beta        :     (     )
Epeak [keV] :       (   )
Norm@50keV   :     (     )
------------------------------------------------------------

Photon flux (15-150 keV)    in  sec:  (    ) ph/cm2/s
Energy fluence (15-150 keV)             : 0 ( 0  0 ) ergs/cm2
Single BB
Spectral model blackbody:
------------------------------------------------------------
Parameters  : value    Lower 90%  Upper 90%
kT [keV]    : 15.9719  (-2.10546  2.22943)
R^2/D10^2   : 0.296051  (-0.119163   0.194995)
(R is the radius in km and D10 is the distance to the source in units of 10 kpc)
------------------------------------------------------------
#Fit statistic : Chi-Squared =          61.83 using 59 PHA bins.
# Reduced chi-squared =          1.085 for     57 degrees of freedom
# Null hypothesis probability =   3.075917e-01

Energy  Fluence     90% Error
[keV]   [erg/cm2]   [erg/cm2]
15- 25  1.562e-08   4.951e-09
25- 50  6.564e-08   1.546e-08
50-150  1.169e-07   3.367e-08
15-150  1.982e-07   4.795e-08
Thermal bremsstrahlung (OTTB)
Spectral model: thermal bremsstrahlung
------------------------------------------------------------
Parameters  : value         Lower 90%    Upper 90%
kT [keV]    : 99.7504       (-32.6486      -99.8099)
Norm        : 12.5976       (-2.94221     2.99077)
------------------------------------------------------------
#Fit statistic : Chi-Squared =          70.26 using 59 PHA bins.
# Reduced chi-squared =          1.233 for     57 degrees of freedom
# Null hypothesis probability =   1.114960e-01

Energy  Fluence     90% Error
[keV]   [erg/cm2]   [erg/cm2]
15- 25  3.293e-08   8.280e-09
25- 50  5.691e-08   1.295e-08
50-150  9.209e-08   5.329e-08
15-150  1.819e-07   6.410e-08
Double BB

Spectral model: bbodyrad<1> + bbodyrad<2>
------------------------------------------------------------
Parameters  : value         Lower 90%    Upper 90%
kT1 [keV]   : 2.68661        (-2.68624      11.3553)
R1^2/D10^2  : 124.489        (-124.662      2032.99)
kT2 [keV]   : 16.6021        (-2.29508      2.64521)
R2^2/D10^2  : 0.245052    (-0.115517   0.115709)
------------------------------------------------------------
#Fit statistic : Chi-Squared =          59.48 using 59 PHA bins.
# Reduced chi-squared =          1.081 for     55 degrees of freedom
# Null hypothesis probability =   3.158643e-01

Energy  Fluence     90% Error
[keV]   [erg/cm2]   [erg/cm2]
15- 25  2.518e-08   1.015e-08
25- 50  6.119e-08   2.030e-08
50-150  1.173e-07   4.001e-08
15-150  2.037e-07   6.659e-08
Pre-slew spectrum (Pre-slew PHA with pre-slew DRM)
Power-law model
Spectral model in power-law:
------------------------------------------------------------
Parameters  : value       lower 90%   higher 90%
Photon index: 1.44272     ( -0.167865   0.167592 )
Norm@50keV  : 7.27856E-03    ( -0.000691681   0.000691543 )
------------------------------------------------------------
#Fit statistic : Chi-Squared =          74.84 using 59 PHA bins.
# Reduced chi-squared =          1.313 for     57 degrees of freedom
# Null hypothesis probability =   5.661511e-02

Photon flux (15-150 keV)    in 29.72 sec: 0.895373 ( -0.0913798  0.0919444 ) ph/cm2/s
Energy fluence (15-150 keV)             : 2.07281e-06 ( -2.08809e-07  2.09717e-07 ) ergs/cm2
Cutoff power-law model

Spectral model in the cutoff power-law:
------------------------------------------------------------
Parameters  : value       lower 90%   higher 90%
Photon index: 1.31147     ( -0.706877   0.284848 )
Epeak [keV] : 291.550      ( -291.305 -291.305 )
Norm@50keV  : 8.37411E-03    ( -0.00837535   0.00898403 )
------------------------------------------------------------
#Fit statistic : Chi-Squared =          74.72 using 59 PHA bins.
# Reduced chi-squared =          1.334 for     56 degrees of freedom
# Null hypothesis probability =   4.802096e-02

Photon flux (15-150 keV)    in 29.72 sec: 0.889449 ( -0.095488  0.095467 ) ph/cm2/s
Energy fluence (15-150 keV)             : 2.06255e-06 ( -2.17738e-07  2.15839e-07 ) ergs/cm2
Band function

Spectral model in the Band function:
------------------------------------------------------------
Parameters  : value       lower 90%   higher 90%
alpha       :    (     )
beta        :     (     )
Epeak [keV] :       (   )
Norm@50keV   :     (     )
------------------------------------------------------------

Photon flux (15-150 keV)    in  sec:  (    ) ph/cm2/s
Energy fluence (15-150 keV)             : 0 ( 0  0 ) ergs/cm2
S(25-50 keV) vs. S(50-100 keV) plot
S(25-50 keV)  = 5.29e-07
S(50-100 keV) = 7.80e-07
T90 vs. Hardness ratio plot

T90                                   = 23.00 sec.
Hardness ratio (energy fluence ratio) = 1.47448
Color vs. Color plot
Count Ratio  (25-50 keV) / (15-25 keV) =
Count Ratio (50-100 keV) / (15-25 keV) =
Mask shadow pattern
IMX = -1.040027215880981E+00, IMY = -4.418580807368009E-01
TIME vs. PHA plot around the trigger time
Blue+Cyan dotted lines: Time interval of the scaled map
From 0.000000 to 1.408000
TIME vs. DetID plot around the trigger time
Blue+Cyan dotted lines: Time interval of the scaled map
From 0.000000 to 1.408000
100 us light curve (15-350 keV)
Blue+Cyan dotted lines: Time interval of the scaled map
From 0.000000 to 1.408000
Spacecraft aspect plot
Bright source in the pre-burst/pre-slew/post-slew images
Pre-burst image of 15-350 keV band
Time interval of the image:
-768.111420 -750.032000
-239.712000 -6.532000

# RAcent  DECcent POSerr Theta    Phi  PeakCts   SNR AngSep     Name
#  [deg]    [deg]    ['] [deg]  [deg]                   [']
299.5964  35.2232    1.1  48.1 -147.0   6.0271  10.6    1.3	Cyg X-1
308.1133  40.9517    2.0  39.3 -145.4   1.8644   5.9    0.1	Cyg X-3
326.2312  38.2794    7.2  28.7 -162.4   0.3556   1.6    3.8	Cyg X-2
 13.3766  10.3738    2.9  38.8   98.6   2.7892   3.9 ------	UNKNOWN
 59.3797  40.1376    3.4  39.9   14.3   1.0054   3.4 ------	UNKNOWN
317.4091   7.8397    3.2  56.1  173.5   4.0090   3.6 ------	UNKNOWN
 97.6990  57.2331    2.9  53.0  -23.5   2.3882   4.0 ------	UNKNOWN
Pre-slew background subtracted image of 15-350 keV band
Time interval of the image:
-6.532000 23.188600

# RAcent  DECcent POSerr Theta    Phi  PeakCts   SNR AngSep     Name
#  [deg]    [deg]    ['] [deg]  [deg]                   [']
299.4677  35.3168    3.8  48.1 -146.8   0.5049   3.1    9.2	Cyg X-1
308.1990  40.7483    9.9  39.4 -145.7  -0.1083  -1.2   12.9	Cyg X-3
326.3387  38.2732    8.4  28.6 -162.5  -0.0790  -1.4    8.4	Cyg X-2
 25.5968  17.8206    2.9  35.3   75.9   0.5086   3.9 ------	UNKNOWN
  5.5894  14.5066    2.3  33.8  110.6   0.5740   5.0 ------	UNKNOWN
332.6285   7.4688    0.8  48.5  157.0   3.1132  15.3 ------	UNKNOWN
 93.3028  45.2555    2.2  57.8   -9.7   1.4999   5.3 ------	UNKNOWN
305.8413  22.6002    2.0  52.1 -164.1   0.9503   5.8 ------	UNKNOWN
Post-slew image of 15-350 keV band
Time interval of the image:
106.788600 902.588600

# RAcent  DECcent POSerr Theta    Phi  PeakCts   SNR AngSep     Name
#  [deg]    [deg]    ['] [deg]  [deg]                   [']
299.6024  35.2197    0.5  40.9  -37.9  19.6848  25.3    1.2	Cyg X-1
308.0992  40.9932    1.7  39.9  -24.4   4.4138   6.6    2.5	Cyg X-3
326.0227  38.2538    4.3  31.2   -5.2   1.3534   2.7    8.1	Cyg X-2
346.3075 -46.9463    4.1  55.9  173.6   8.5606   2.8 ------	UNKNOWN
Plot creation:
Sun Nov 20 14:31:13 EST 2016