Estimated redshift from machine learning (Ukwatta et al. 2016) - may take a few minute to calcaulte
Image
Pre-slew 15.0-350.0 keV image (Event data)

#   RAcent    DECcent   POSerr    Theta     Phi              Peak Cts       SNR   Name
  322.0525   -29.6103   0.0029    12.3527  -172.9403         4.4081526     65.870 TRIG_00722604

Foreground time interval of the image:
 -5.996  11.645 (delta_t =  17.641 [sec])
Background time interval of the image:
-72.955  -5.996 (delta_t =  66.959 [sec])
Lightcurves
Notes:
- 1) The mask-weighted light curves are using the flight position.
- 2) Multiple plots of different time binning/intervals are shown to cover all scenarios of short/long GRBs, rate/image triggers, and real/false positives.
- 3) For all the mask-weighted lightcurves, the y-axis units are counts/sec/det where a det is 0.4 x 0.4 = 0.16 sq cm.
- 4) The verticle lines correspond to following: green dotted lines are T50 interval, black dotted lines are T90 interval, blue solid line(s) is a spacecraft slew start time, and orange solid line(s) is a spacecraft slew end time.
- 5) Time of each bin is in the middle of the bin.
1 s binning
From T0-310 s to T0+310 s
From T100_start - 20 s to T100_end + 30 s

Full time interval

64 ms binning
Full time interval

From T100_start to T100_end

From T0-5 sec to T0+5 sec

16 ms binning
From T100_start-5 s to T100_start+5 s

Blue+Cyan dotted lines: Time interval of the scaled map
From 0.000000 to 1.024000
8 ms binning
From T100_start-3 s to T100_start+3 s
Blue+Cyan dotted lines: Time interval of the scaled map
From 0.000000 to 1.024000
2 ms binning
From T100_start-1 s to T100_start+1 s
Blue+Cyan dotted lines: Time interval of the scaled map
From 0.000000 to 1.024000
SN=5 or 10 sec. binning (whichever binning is satisfied first)

SN=5 or 10 sec. binning (T < 200 sec)

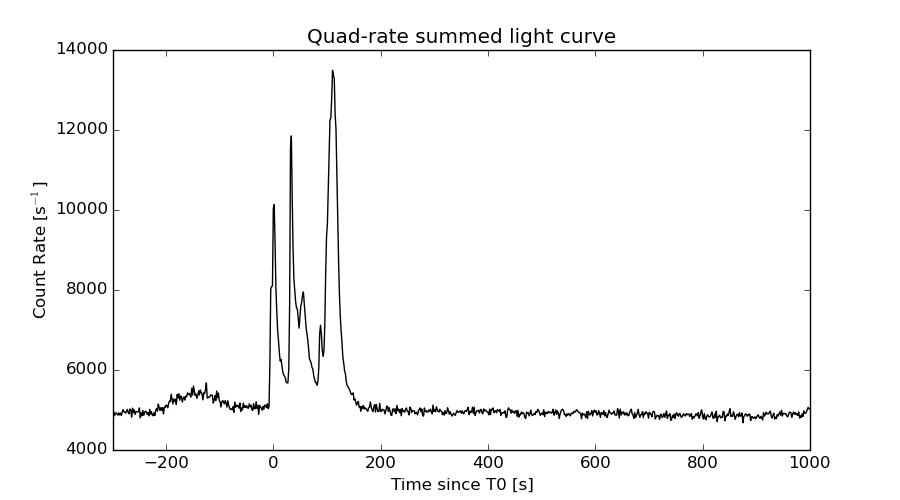
Quad-rate summed light curves (from T0-300s to T0+1000s)
Spectral Evolution

Spectra
Notes:
- 1) The fitting includes the systematic errors.
- 2) When the burst includes telescope slew time periods, the fitting uses an average response file made from multiple 5-s response files through out the slew time plus single time preiod for the non-slew times, and weighted by the total counts in the corresponding time period using addrmf. An average response file is needed becuase a spectral fit using the pre-slew DRM will introduce some errors in both a spectral shape and a normalization if the PHA file contains a lot of the slew/post-slew time interval.
- 3) For fits to more complicated models (e.g. a power-law over a cutoff power-law), the BAT team has decided to require a chi-square improvement of more than 6 for each extra dof.
Time averaged spectrum fit using the average DRM
Power-law model
Time interval is from   -5.996 sec. to  154.436 sec.

Spectral model in power-law:
------------------------------------------------------------
Parameters  : value       lower 90%   higher 90%
Photon index: 1.82769     (     )
Norm@50keV  : 1.42267E-02    (     )
------------------------------------------------------------
#Fit statistic : Chi-Squared =         122.03 using 59 PHA bins.
# Reduced chi-squared =         2.1408 for     57 degrees of freedom
# Null hypothesis probability =   1.240448e-06

Photon flux (15-150 keV)    in 160.4 sec: 1.98196 (    ) ph/cm2/s
Energy fluence (15-150 keV)             : 2.0994e-05 ( 0  0 ) ergs/cm2
Cutoff power-law model
Time interval is from   -5.996 sec. to  154.436 sec.
Spectral model in the cutoff power-law:
------------------------------------------------------------
Parameters  : value       lower 90%   higher 90%
Photon index: 1.20030     ( -0.122674   0.119758 )
Epeak [keV] : 73.0521      ( -3.70999 4.7972 )
Norm@50keV  : 2.66722E-02    ( -0.00294443   0.00338964 )
------------------------------------------------------------
#Fit statistic : Chi-Squared =          34.64 using 59 PHA bins.
# Reduced chi-squared =         0.6185 for     56 degrees of freedom
# Null hypothesis probability =   9.889438e-01

Photon flux (15-150 keV)    in 160.4 sec: 1.85653 ( -0.04161  0.04198 ) ph/cm2/s
Energy fluence (15-150 keV)             : 2.02173e-05 ( -3.25484e-07  3.25726e-07 ) ergs/cm2
Band function

Time interval is from   -5.996 sec. to  154.436 sec.


Spectral model in the Band function:
------------------------------------------------------------
Parameters  : value       lower 90%   higher 90%
alpha       :    (     )
beta        :     (     )
Epeak [keV] :       (   )
Norm@50keV   :     (     )
------------------------------------------------------------

Photon flux (15-150 keV)    in  sec:  (    ) ph/cm2/s
Energy fluence (15-150 keV)             : 0 ( 0  0 ) ergs/cm2
Single BB
Spectral model blackbody:
------------------------------------------------------------
Parameters  : value    Lower 90%  Upper 90%
kT [keV]    : 15.8530  (  )
R^2/D10^2   : 0.158933  (   )
(R is the radius in km and D10 is the distance to the source in units of 10 kpc)
------------------------------------------------------------
#Fit statistic : Chi-Squared =         865.46 using 59 PHA bins.
# Reduced chi-squared =         15.184 for     57 degrees of freedom
# Null hypothesis probability =  6.800410e-145

Energy  Fluence     90% Error
[keV]   [erg/cm2]   [erg/cm2]
15- 25  1.327e-06   4.202e-08
25- 50  5.541e-06   1.163e-07
50-150  9.700e-06   2.037e-07
15-150  1.657e-05   2.486e-07
Thermal bremsstrahlung (OTTB)
Spectral model: thermal bremsstrahlung
------------------------------------------------------------
Parameters  : value         Lower 90%    Upper 90%
kT [keV]    : 118.280       (-5.60602      7.2543)
Norm        : 8.18596       (-0.20427     0.184008)
------------------------------------------------------------
#Fit statistic : Chi-Squared =          35.84 using 59 PHA bins.
# Reduced chi-squared =         0.6288 for     57 degrees of freedom
# Null hypothesis probability =   9.872856e-01

Energy  Fluence     90% Error
[keV]   [erg/cm2]   [erg/cm2]
15- 25  3.331e-06   1.500e-07
25- 50  5.989e-06   2.013e-07
50-150  1.084e-05   2.031e-06
15-150  2.016e-05   2.109e-06
Double BB

Spectral model: bbodyrad<1> + bbodyrad<2>
------------------------------------------------------------
Parameters  : value         Lower 90%    Upper 90%
kT1 [keV]   : 7.91038        (-0.461118      0.474197)
R1^2/D10^2  : 1.32405        (-0.236188      0.307292)
kT2 [keV]   : 24.4951        (-1.22927      1.44171)
R2^2/D10^2  : 2.29199E-02    (-0.00491216   0.00564072)
------------------------------------------------------------
#Fit statistic : Chi-Squared =          48.47 using 59 PHA bins.
# Reduced chi-squared =         0.8812 for     55 degrees of freedom
# Null hypothesis probability =   7.207893e-01

Energy  Fluence     90% Error
[keV]   [erg/cm2]   [erg/cm2]
15- 25  2.770e-06   1.347e-07
25- 50  6.264e-06   1.548e-07
50-150  1.073e-05   2.823e-07
15-150  1.977e-05   4.571e-07
Peak spectrum fit
Power-law model

Time interval is from  110.996 sec. to  111.996 sec.

Spectral model in power-law:
------------------------------------------------------------
Parameters  : value       lower 90%   higher 90%
Photon index: 1.77441     ( -0.0678074   0.0685205 )
Norm@50keV  : 4.99134E-02    ( -0.00200951   0.00200295 )
------------------------------------------------------------
#Fit statistic : Chi-Squared =          52.16 using 59 PHA bins.
# Reduced chi-squared =         0.9151 for     57 degrees of freedom
# Null hypothesis probability =   6.568476e-01

Photon flux (15-150 keV)    in 1 sec: 6.81125 ( -0.27545  0.27596 ) ph/cm2/s
Energy fluence (15-150 keV)             : 4.60055e-07 ( -1.8952e-08  1.90161e-08 ) ergs/cm2
Cutoff power-law model

Time interval is from  110.996 sec. to  111.996 sec.
Spectral model in the cutoff power-law:
------------------------------------------------------------
Parameters  : value       lower 90%   higher 90%
Photon index: 1.30001     ( -0.292841   0.275209 )
Epeak [keV] : 73.4409      ( -11.8397 33.5995 )
Norm@50keV  : 8.66748E-02    ( -0.0232434   0.0343686 )
------------------------------------------------------------
#Fit statistic : Chi-Squared =          43.12 using 59 PHA bins.
# Reduced chi-squared =         0.7700 for     56 degrees of freedom
# Null hypothesis probability =   8.962879e-01

Photon flux (15-150 keV)    in 1 sec:  (    ) ph/cm2/s
Energy fluence (15-150 keV)             : 0 ( 0  0 ) ergs/cm2
Band function

Time interval is from  110.996 sec. to  111.996 sec.


Spectral model in the Band function:
------------------------------------------------------------
Parameters  : value       lower 90%   higher 90%
alpha       :    (     )
beta        :     (     )
Epeak [keV] :       (   )
Norm@50keV   :     (     )
------------------------------------------------------------

Photon flux (15-150 keV)    in  sec:  (    ) ph/cm2/s
Energy fluence (15-150 keV)             : 0 ( 0  0 ) ergs/cm2
Single BB

Spectral model blackbody:
------------------------------------------------------------
Parameters  : value    Lower 90%  Upper 90%
kT [keV]    : 13.2174  (  )
R^2/D10^2   : 1.13563  (   )
(R is the radius in km and D10 is the distance to the source in units of 10 kpc)
------------------------------------------------------------
#Fit statistic : Chi-Squared =         188.84 using 59 PHA bins.
# Reduced chi-squared =         3.3130 for     57 degrees of freedom
# Null hypothesis probability =   4.972467e-16

Energy  Fluence     90% Error
[keV]   [erg/cm2]   [erg/cm2]
15- 25  4.206e-08   3.195e-09
25- 50  1.475e-07   7.050e-09
50-150  1.644e-07   1.325e-08
15-150  3.540e-07   1.550e-08
Thermal bremsstrahlung (OTTB)

Spectral model: thermal bremsstrahlung
------------------------------------------------------------
Parameters  : value         Lower 90%    Upper 90%
kT [keV]    : 120.656       (-19.7382      19.5406)
Norm        : 28.4231       (-1.39858     1.68477)
------------------------------------------------------------
#Fit statistic : Chi-Squared =          43.44 using 59 PHA bins.
# Reduced chi-squared =         0.7621 for     57 degrees of freedom
# Null hypothesis probability =   9.071652e-01

Energy  Fluence     90% Error
[keV]   [erg/cm2]   [erg/cm2]
15- 25  7.402e-08   5.000e-09
25- 50  1.325e-07   7.100e-09
50-150  2.372e-07   5.870e-08
15-150  4.437e-07   6.355e-08
Double BB

Spectral model: bbodyrad<1> + bbodyrad<2>
------------------------------------------------------------
Parameters  : value         Lower 90%    Upper 90%
kT1 [keV]   : 6.83529        (-0.842831      0.896379)
R1^2/D10^2  : 8.34805        (-2.83285      4.93949)
kT2 [keV]   : 23.1110        (-2.69744      3.69351)
R2^2/D10^2  : 0.106268    (-0.0469965   0.0696966)
------------------------------------------------------------
#Fit statistic : Chi-Squared =          43.61 using 59 PHA bins.
# Reduced chi-squared =         0.7930 for     55 degrees of freedom
# Null hypothesis probability =   8.656851e-01

Energy  Fluence     90% Error
[keV]   [erg/cm2]   [erg/cm2]
15- 25  7.135e-08   9.380e-09
25- 50  1.357e-07   1.265e-08
50-150  2.348e-07   3.490e-08
15-150  4.419e-07   5.405e-08
Pre-slew spectrum (Pre-slew PHA with pre-slew DRM)
Power-law model

Spectral model in power-law:
------------------------------------------------------------
Parameters  : value       lower 90%   higher 90%
Photon index: 0.894482     (     )
Norm@50keV  : 1.66309E-02    (     )
------------------------------------------------------------
#Fit statistic : Chi-Squared =         120.82 using 59 PHA bins.
# Reduced chi-squared =         2.1196 for     57 degrees of freedom
# Null hypothesis probability =   1.738886e-06

Photon flux (15-150 keV)    in 17.64 sec: 1.90879 (    ) ph/cm2/s
Energy fluence (15-150 keV)             : 3.29947e-06 ( 0  0 ) ergs/cm2
Cutoff power-law model

Spectral model in the cutoff power-law:
------------------------------------------------------------
Parameters  : value       lower 90%   higher 90%
Photon index: 2.42824E-02     ( -0.190845   0.18282 )
Epeak [keV] : 138.306      ( -14.1389 20.429 )
Norm@50keV  : 3.82407E-02    ( -0.00593081   0.00729198 )
------------------------------------------------------------
#Fit statistic : Chi-Squared =          44.06 using 59 PHA bins.
# Reduced chi-squared =         0.7868 for     56 degrees of freedom
# Null hypothesis probability =   8.760701e-01

Photon flux (15-150 keV)    in 17.64 sec: 1.84499 ( -0.04653  0.04659 ) ph/cm2/s
Energy fluence (15-150 keV)             : 3.20983e-06 ( -8.28022e-08  8.26081e-08 ) ergs/cm2
Band function

Spectral model in the Band function:
------------------------------------------------------------
Parameters  : value       lower 90%   higher 90%
alpha       :    (     )
beta        :     (     )
Epeak [keV] :       (   )
Norm@50keV   :     (     )
------------------------------------------------------------

Photon flux (15-150 keV)    in  sec:  (    ) ph/cm2/s
Energy fluence (15-150 keV)             : 0 ( 0  0 ) ergs/cm2
S(25-50 keV) vs. S(50-100 keV) plot

S(25-50 keV)  = 5.97e-06
S(50-100 keV) = 6.74e-06
T90 vs. Hardness ratio plot
T90                                   = 125.699999928474 sec.
Hardness ratio (energy fluence ratio) = 1.12898
Color vs. Color plot
Count Ratio  (25-50 keV) / (15-25 keV) = 1.32722
Count Ratio (50-100 keV) / (15-25 keV) = 0.831938
Mask shadow pattern

IMX = -2.173391656766071E-01, IMY = 2.691597681904080E-02
TIME vs. PHA plot around the trigger time

Blue+Cyan dotted lines: Time interval of the scaled map
From 0.000000 to 1.024000
TIME vs. DetID plot around the trigger time
Blue+Cyan dotted lines: Time interval of the scaled map
From 0.000000 to 1.024000
100 us light curve (15-350 keV)
Blue+Cyan dotted lines: Time interval of the scaled map
From 0.000000 to 1.024000
Spacecraft aspect plot
Bright source in the pre-burst/pre-slew/post-slew images
Pre-burst image of 15-350 keV band
Time interval of the image:
-72.955380 -5.996000

# RAcent  DECcent POSerr Theta    Phi  PeakCts   SNR AngSep     Name
#  [deg]    [deg]    ['] [deg]  [deg]                   [']
274.1620 -14.0791    6.7  41.5  -64.2  -0.5223  -1.7    9.4	GX 17+2
275.9782 -30.2419   29.6  39.4  -89.2   0.1681   0.4    8.0	H1820-303
284.9509 -24.8724    8.1  30.8  -81.7   0.2214   1.4    5.5	HT1900.1-2455
288.8902  11.0464    4.9  40.4  -19.2   0.3147   2.3    8.1	GRS 1915+105
299.5392  35.1909    5.7  55.8    9.3   1.0301   2.0    2.6	Cyg X-1
287.3058  -5.2671    2.3  31.9  -43.3   0.6037   4.9 ------	UNKNOWN
Pre-slew background subtracted image of 15-350 keV band
Time interval of the image:
-5.996000 11.644600

# RAcent  DECcent POSerr Theta    Phi  PeakCts   SNR AngSep     Name
#  [deg]    [deg]    ['] [deg]  [deg]                   [']
273.9667 -13.9223    5.6  41.8  -64.0  -0.5154  -2.1    7.2	GX 17+2
276.0876 -30.2941   28.0  39.3  -89.3   0.1214   0.4    9.5	H1820-303
285.2258 -24.9953    9.1  30.5  -82.0  -0.1471  -1.3   11.3	HT1900.1-2455
288.7427  10.8917   10.5  40.4  -19.6   0.1152   1.1    4.6	GRS 1915+105
299.6619  35.1768    6.3  55.8    9.4   0.7714   1.8    3.8	Cyg X-1
 13.9687 -42.0948    2.7  53.5  156.3   1.7484   4.2 ------	UNKNOWN
322.0624  15.4632    2.4  33.8   35.1   0.5377   4.7 ------	UNKNOWN
322.0525 -29.6103    0.2  12.4 -172.9   4.4076  65.9 ------	UNKNOWN
295.3913 -16.4626    2.4  21.0  -62.2   0.3745   4.8 ------	UNKNOWN
Post-slew image of 15-350 keV band
Time interval of the image:
49.644600 962.239400

# RAcent  DECcent POSerr Theta    Phi  PeakCts   SNR AngSep     Name
#  [deg]    [deg]    ['] [deg]  [deg]                   [']
275.9536 -30.3614  202.7  39.7  -86.4   0.1832   0.1    1.5	H1820-303
284.8802 -24.7979    0.0  33.3  -74.2  -1.4916  -1.2   11.2	HT1900.1-2455
288.7416  10.8797    3.7  51.7  -26.9   5.3663   3.1    5.2	GRS 1915+105
 32.2401 -60.1284    2.4  54.9  161.6  22.1191   4.9 ------	UNKNOWN
322.0588 -29.6136    0.3   0.0  -77.5  25.0906  43.3 ------	UNKNOWN
309.9942   3.4825    2.9  35.1   -4.7   3.0256   4.0 ------	UNKNOWN
286.9688 -79.2873    2.9  51.9 -155.6   7.4099   4.0 ------	UNKNOWN
Plot creation:
Sun Dec  4 17:17:38 EST 2016