Estimated redshift from machine learning (Ukwatta et al. 2016) - may take a few minute to calcaulte
Image
Pre-slew 15.0-350.0 keV image (Event data)

#   RAcent    DECcent   POSerr    Theta     Phi              Peak Cts       SNR   Name
  298.8187   -67.6727   0.0118    29.8262   -70.0056         1.3976071     16.432 TRIG_00722642

Foreground time interval of the image:
 -6.456  13.005 (delta_t =  19.461 [sec])
Background time interval of the image:
-460.795 -442.400 (delta_t =  18.395 [sec])
-239.896  -6.456 (delta_t = 233.440 [sec])
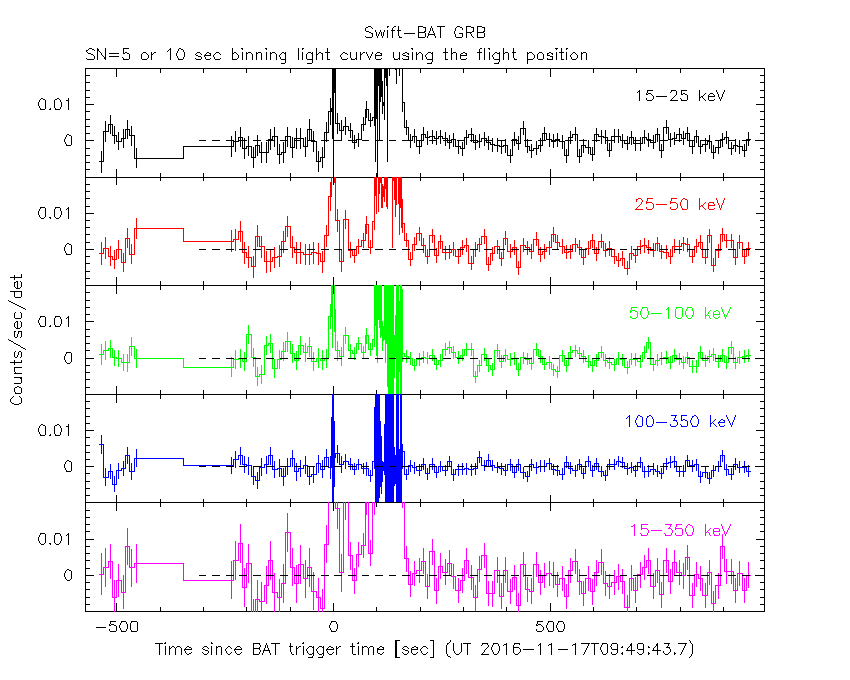
Lightcurves
Notes:
- 1) The mask-weighted light curves are using the flight position.
- 2) Multiple plots of different time binning/intervals are shown to cover all scenarios of short/long GRBs, rate/image triggers, and real/false positives.
- 3) For all the mask-weighted lightcurves, the y-axis units are counts/sec/det where a det is 0.4 x 0.4 = 0.16 sq cm.
- 4) The verticle lines correspond to following: green dotted lines are T50 interval, black dotted lines are T90 interval, blue solid line(s) is a spacecraft slew start time, and orange solid line(s) is a spacecraft slew end time.
- 5) Time of each bin is in the middle of the bin.
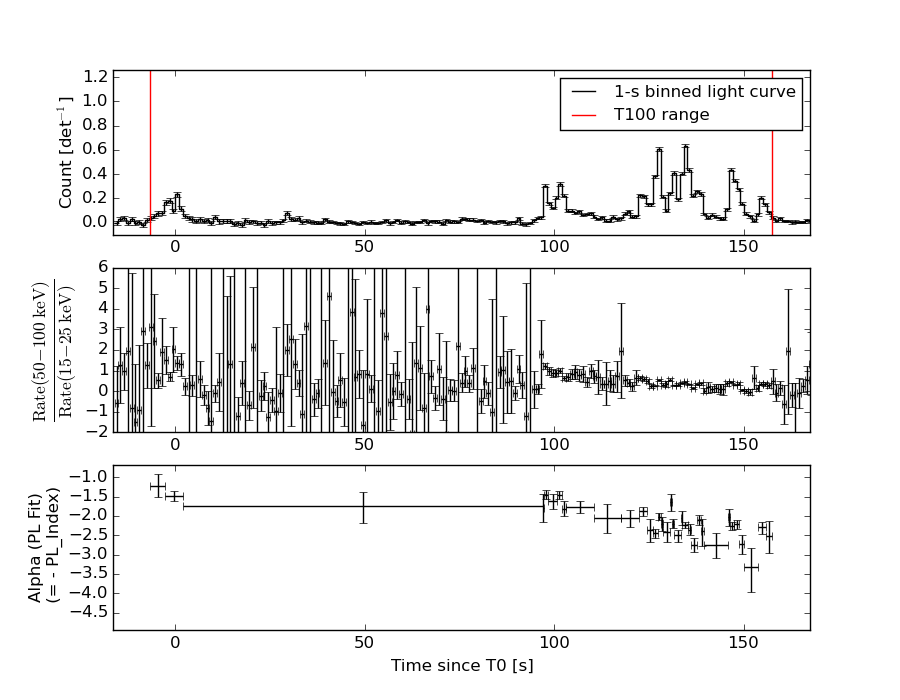
1 s binning
From T0-310 s to T0+310 s
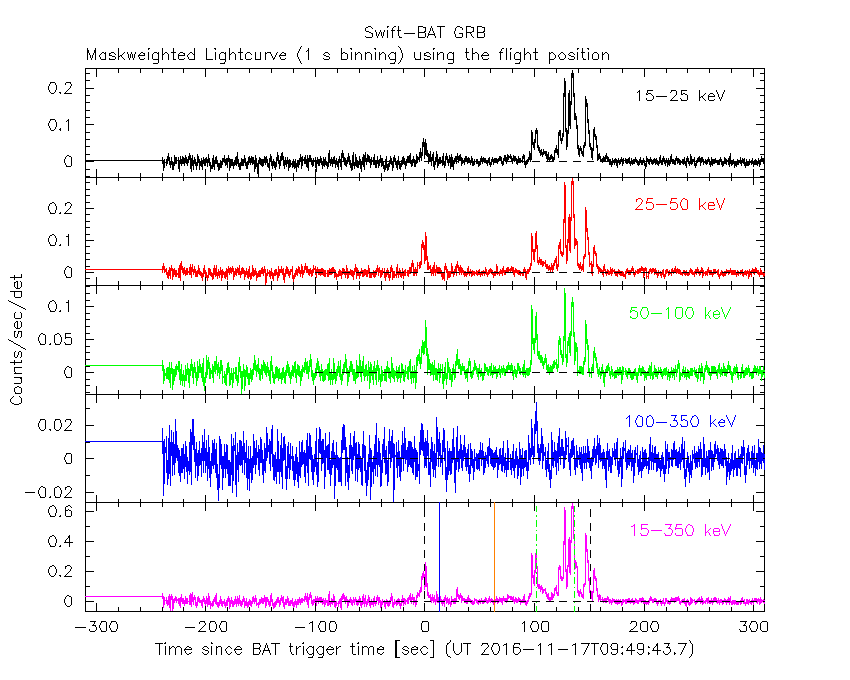
From T100_start - 20 s to T100_end + 30 s

Full time interval

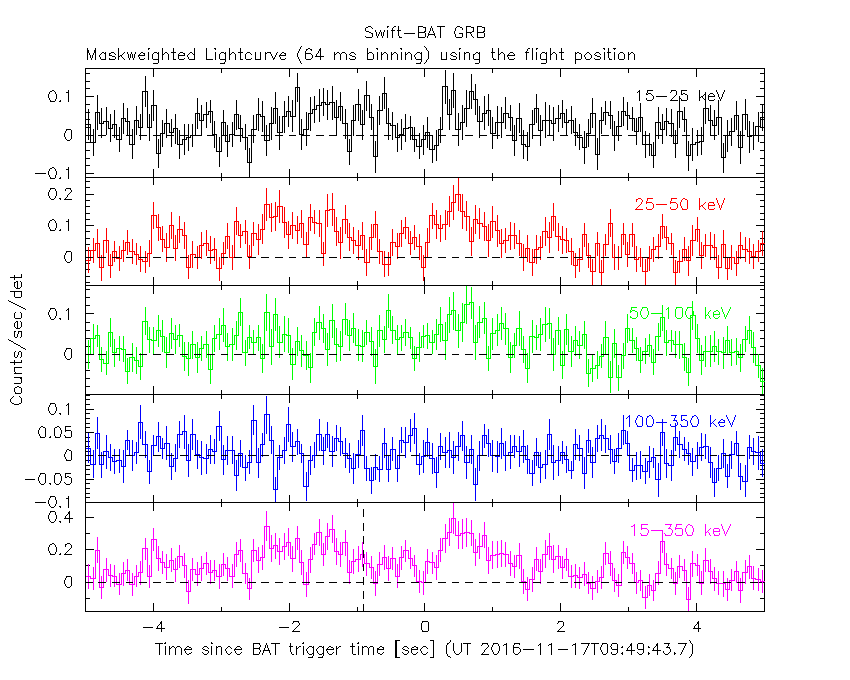
64 ms binning
Full time interval
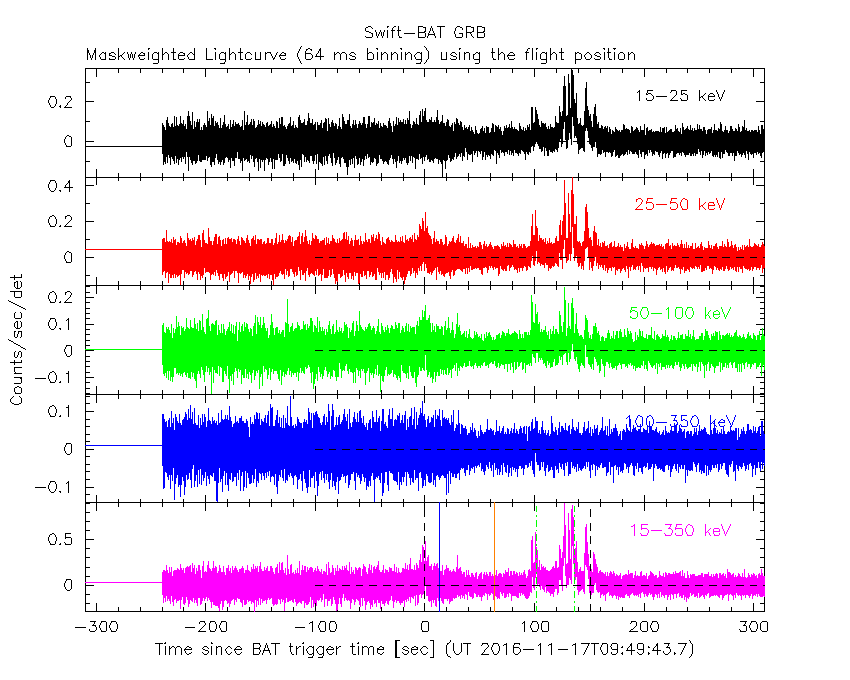
From T100_start to T100_end

From T0-5 sec to T0+5 sec
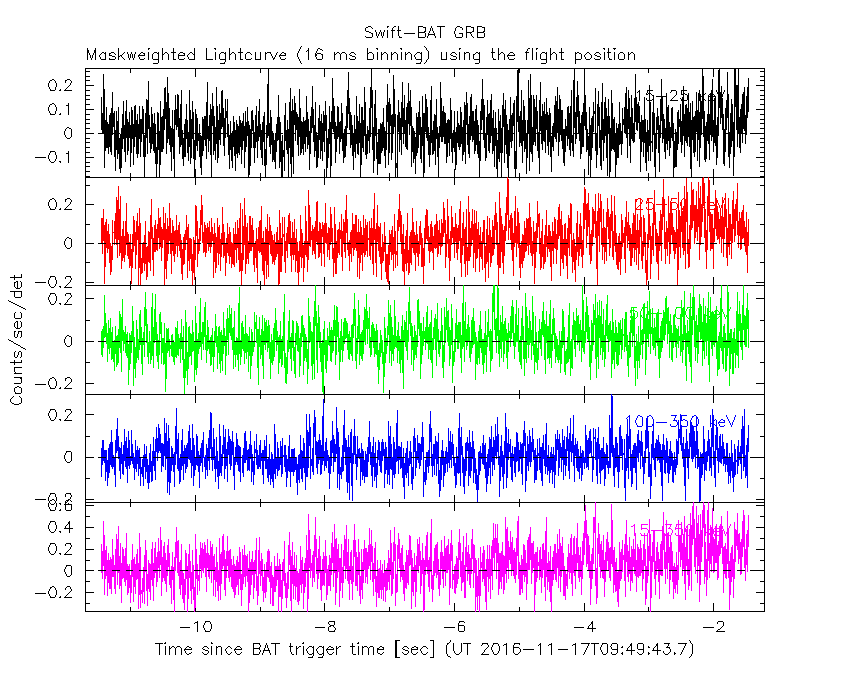
16 ms binning
From T100_start-5 s to T100_start+5 s
Blue+Cyan dotted lines: Time interval of the scaled map
From 0.000000 to 1.024000
8 ms binning
From T100_start-3 s to T100_start+3 s

Blue+Cyan dotted lines: Time interval of the scaled map
From 0.000000 to 1.024000
2 ms binning
From T100_start-1 s to T100_start+1 s

Blue+Cyan dotted lines: Time interval of the scaled map
From 0.000000 to 1.024000
SN=5 or 10 sec. binning (whichever binning is satisfied first)
SN=5 or 10 sec. binning (T < 200 sec)

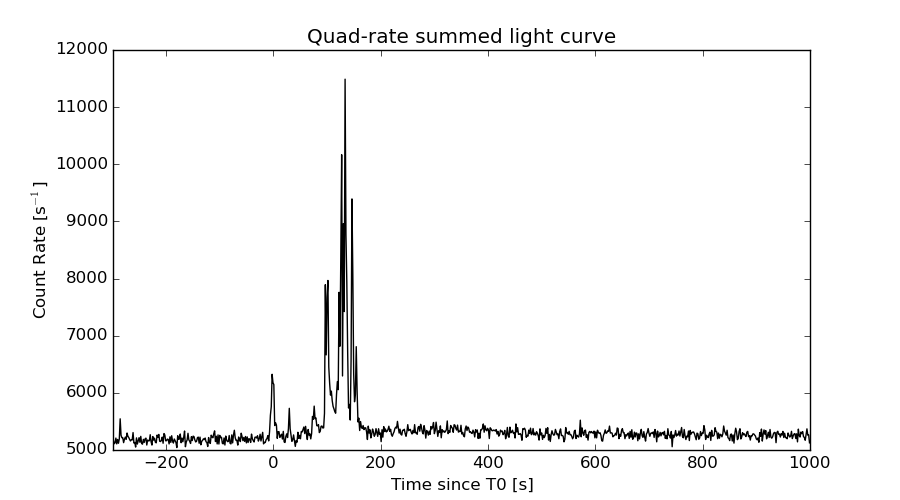
Quad-rate summed light curves (from T0-300s to T0+1000s)
Spectral Evolution
Spectra
Notes:
- 1) The fitting includes the systematic errors.
- 2) When the burst includes telescope slew time periods, the fitting uses an average response file made from multiple 5-s response files through out the slew time plus single time preiod for the non-slew times, and weighted by the total counts in the corresponding time period using addrmf. An average response file is needed becuase a spectral fit using the pre-slew DRM will introduce some errors in both a spectral shape and a normalization if the PHA file contains a lot of the slew/post-slew time interval.
- 3) For fits to more complicated models (e.g. a power-law over a cutoff power-law), the BAT team has decided to require a chi-square improvement of more than 6 for each extra dof.
Time averaged spectrum fit using the average DRM
Power-law model

Time interval is from   -6.456 sec. to  157.444 sec.

Spectral model in power-law:
------------------------------------------------------------
Parameters  : value       lower 90%   higher 90%
Photon index: 2.10947     ( -0.0589789   0.0596138 )
Norm@50keV  : 3.96963E-03    ( -0.000129343   0.000128736 )
------------------------------------------------------------
#Fit statistic : Chi-Squared =          62.31 using 59 PHA bins.
# Reduced chi-squared =          1.093 for     57 degrees of freedom
# Null hypothesis probability =   2.930626e-01

Photon flux (15-150 keV)    in 163.9 sec: 0.627516 ( -0.020034  0.020123 ) ph/cm2/s
Energy fluence (15-150 keV)             : 6.05173e-06 ( -1.82122e-07  1.82732e-07 ) ergs/cm2
Cutoff power-law model

Time interval is from   -6.456 sec. to  157.444 sec.
Spectral model in the cutoff power-law:
------------------------------------------------------------
Parameters  : value       lower 90%   higher 90%
Photon index: 1.38966     ( -0.286184   0.268537 )
Epeak [keV] : 38.8517      ( -6.19895 4.44912 )
Norm@50keV  : 9.45456E-03    ( -0.00257337   0.00384693 )
------------------------------------------------------------
#Fit statistic : Chi-Squared =          39.17 using 59 PHA bins.
# Reduced chi-squared =         0.6994 for     56 degrees of freedom
# Null hypothesis probability =   9.573356e-01

Photon flux (15-150 keV)    in 163.9 sec: 0.591572 ( -0.023332  0.023476 ) ph/cm2/s
Energy fluence (15-150 keV)             : 5.6387e-06 ( -2.27061e-07  2.29419e-07 ) ergs/cm2
Band function

Time interval is from   -6.456 sec. to  157.444 sec.


Spectral model in the Band function:
------------------------------------------------------------
Parameters  : value       lower 90%   higher 90%
alpha       :    (     )
beta        :     (     )
Epeak [keV] :       (   )
Norm@50keV   :     (     )
------------------------------------------------------------

Photon flux (15-150 keV)    in  sec:  (    ) ph/cm2/s
Energy fluence (15-150 keV)             : 0 ( 0  0 ) ergs/cm2
Single BB

Spectral model blackbody:
------------------------------------------------------------
Parameters  : value    Lower 90%  Upper 90%
kT [keV]    : 11.0662  (  )
R^2/D10^2   : 0.179422  (   )
(R is the radius in km and D10 is the distance to the source in units of 10 kpc)
------------------------------------------------------------
#Fit statistic : Chi-Squared =         209.41 using 59 PHA bins.
# Reduced chi-squared =         3.6739 for     57 degrees of freedom
# Null hypothesis probability =   2.805712e-19

Energy  Fluence     90% Error
[keV]   [erg/cm2]   [erg/cm2]
15- 25  7.533e-07   3.966e-08
25- 50  2.147e-06   6.802e-08
50-150  1.492e-06   1.096e-07
15-150  4.392e-06   1.393e-07
Thermal bremsstrahlung (OTTB)

Spectral model: thermal bremsstrahlung
------------------------------------------------------------
Parameters  : value         Lower 90%    Upper 90%
kT [keV]    : 62.4540       (-5.24374      6.00556)
Norm        : 3.10733       (-0.171634     0.18362)
------------------------------------------------------------
#Fit statistic : Chi-Squared =          39.36 using 59 PHA bins.
# Reduced chi-squared =         0.6906 for     57 degrees of freedom
# Null hypothesis probability =   9.638675e-01

Energy  Fluence     90% Error
[keV]   [erg/cm2]   [erg/cm2]
15- 25  1.288e-06   5.868e-08
25- 50  1.984e-06   5.573e-08
50-150  2.333e-06   1.623e-07
15-150  5.605e-06   1.860e-07
Double BB

Spectral model: bbodyrad<1> + bbodyrad<2>
------------------------------------------------------------
Parameters  : value         Lower 90%    Upper 90%
kT1 [keV]   : 5.32663        (-0.648425      0.740477)
R1^2/D10^2  : 1.97839        (-0.772402      1.41091)
kT2 [keV]   : 16.1969        (-1.34773      1.78985)
R2^2/D10^2  : 3.12021E-02    (-0.0117735   0.0148849)
------------------------------------------------------------
#Fit statistic : Chi-Squared =          43.86 using 59 PHA bins.
# Reduced chi-squared =         0.7975 for     55 degrees of freedom
# Null hypothesis probability =   8.596888e-01

Energy  Fluence     90% Error
[keV]   [erg/cm2]   [erg/cm2]
15- 25  1.286e-06   1.399e-07
25- 50  1.944e-06   1.418e-07
50-150  2.209e-06   2.016e-07
15-150  5.439e-06   3.999e-07
Peak spectrum fit
Power-law model

Time interval is from  134.084 sec. to  135.084 sec.

Spectral model in power-law:
------------------------------------------------------------
Parameters  : value       lower 90%   higher 90%
Photon index: 2.19317     ( -0.0823036   0.0841548 )
Norm@50keV  : 3.33090E-02    ( -0.001857   0.00184312 )
------------------------------------------------------------
#Fit statistic : Chi-Squared =          73.80 using 59 PHA bins.
# Reduced chi-squared =          1.295 for     57 degrees of freedom
# Null hypothesis probability =   6.653657e-02

Photon flux (15-150 keV)    in 1 sec: 5.49525 ( -0.26422  0.2646 ) ph/cm2/s
Energy fluence (15-150 keV)             : 3.12939e-07 ( -1.56492e-08  1.57158e-08 ) ergs/cm2
Cutoff power-law model

Time interval is from  134.084 sec. to  135.084 sec.
Spectral model in the cutoff power-law:
------------------------------------------------------------
Parameters  : value       lower 90%   higher 90%
Photon index: 0.766801     ( -0.514564   0.455642 )
Epeak [keV] : 35.8961      ( -3.92181 3.22934 )
Norm@50keV  : 0.218418    ( -0.0983894   0.215037 )
------------------------------------------------------------
#Fit statistic : Chi-Squared =          37.66 using 59 PHA bins.
# Reduced chi-squared =         0.6724 for     56 degrees of freedom
# Null hypothesis probability =   9.715954e-01

Photon flux (15-150 keV)    in 1 sec:  (    ) ph/cm2/s
Energy fluence (15-150 keV)             : 0 ( 0  0 ) ergs/cm2
Band function

Time interval is from  134.084 sec. to  135.084 sec.


Spectral model in the Band function:
------------------------------------------------------------
Parameters  : value       lower 90%   higher 90%
alpha       :    (     )
beta        :     (     )
Epeak [keV] :       (   )
Norm@50keV   :     (     )
------------------------------------------------------------

Photon flux (15-150 keV)    in  sec:  (    ) ph/cm2/s
Energy fluence (15-150 keV)             : 0 ( 0  0 ) ergs/cm2
Single BB

Spectral model blackbody:
------------------------------------------------------------
Parameters  : value    Lower 90%  Upper 90%
kT [keV]    : 9.57354  (-0.440591  0.46195)
R^2/D10^2   : 2.99390  (-0.524533   0.632487)
(R is the radius in km and D10 is the distance to the source in units of 10 kpc)
------------------------------------------------------------
#Fit statistic : Chi-Squared =          77.39 using 59 PHA bins.
# Reduced chi-squared =          1.358 for     57 degrees of freedom
# Null hypothesis probability =   3.745950e-02

Energy  Fluence     90% Error
[keV]   [erg/cm2]   [erg/cm2]
15- 25  5.498e-08   4.680e-09
25- 50  1.284e-07   6.300e-09
50-150  5.896e-08   7.430e-09
15-150  2.423e-07   1.265e-08
Thermal bremsstrahlung (OTTB)

Spectral model: thermal bremsstrahlung
------------------------------------------------------------
Parameters  : value         Lower 90%    Upper 90%
kT [keV]    : 50.6314       (-5.42505      6.58696)
Norm        : 30.9858       (-2.29719     2.77028)
------------------------------------------------------------
#Fit statistic : Chi-Squared =          41.62 using 59 PHA bins.
# Reduced chi-squared =         0.7302 for     57 degrees of freedom
# Null hypothesis probability =   9.370895e-01

Energy  Fluence     90% Error
[keV]   [erg/cm2]   [erg/cm2]
15- 25  7.598e-08   5.190e-09
25- 50  1.096e-07   5.400e-09
50-150  1.077e-07   1.145e-08
15-150  2.933e-07   1.505e-08
Double BB

Spectral model: bbodyrad<1> + bbodyrad<2>
------------------------------------------------------------
Parameters  : value         Lower 90%    Upper 90%
kT1 [keV]   : 7.32280        (-0.990293      0.850027)
R1^2/D10^2  : 6.71164        (-1.94524      3.60596)
kT2 [keV]   : 20.2182        (-4.66414      8.17456)
R2^2/D10^2  : 7.17178E-02    (-0.0545068   0.177848)
------------------------------------------------------------
#Fit statistic : Chi-Squared =          32.94 using 59 PHA bins.
# Reduced chi-squared =         0.5989 for     55 degrees of freedom
# Null hypothesis probability =   9.920520e-01

Energy  Fluence     90% Error
[keV]   [erg/cm2]   [erg/cm2]
15- 25  6.607e-08   8.105e-09
25- 50  1.184e-07   1.701e-08
50-150  1.032e-07   4.274e-08
15-150  2.877e-07   5.995e-08
Pre-slew spectrum (Pre-slew PHA with pre-slew DRM)
Power-law model

Spectral model in power-law:
------------------------------------------------------------
Parameters  : value       lower 90%   higher 90%
Photon index: 1.47595     ( -0.152778   0.153443 )
Norm@50keV  : 4.55918E-03    ( -0.000436724   0.000434802 )
------------------------------------------------------------
#Fit statistic : Chi-Squared =          51.68 using 59 PHA bins.
# Reduced chi-squared =         0.9067 for     57 degrees of freedom
# Null hypothesis probability =   6.741114e-01

Photon flux (15-150 keV)    in 19.46 sec: 0.565564 ( -0.0531485  0.0531946 ) ph/cm2/s
Energy fluence (15-150 keV)             : 8.45076e-07 ( -8.84206e-08  8.932e-08 ) ergs/cm2
Cutoff power-law model

Spectral model in the cutoff power-law:
------------------------------------------------------------
Parameters  : value       lower 90%   higher 90%
Photon index: 0.390425     ( -0.955879   0.7584 )
Epeak [keV] : 68.5219      ( -14.2073 53.687 )
Norm@50keV  : 1.74605E-02    ( -0.0105253   0.0394598 )
------------------------------------------------------------
#Fit statistic : Chi-Squared =          45.24 using 59 PHA bins.
# Reduced chi-squared =         0.8079 for     56 degrees of freedom
# Null hypothesis probability =   8.475461e-01

Photon flux (15-150 keV)    in 19.46 sec: 0.543508 ( -0.055926  0.055518 ) ph/cm2/s
Energy fluence (15-150 keV)             : 7.64237e-07 ( -1.03078e-07  1.05771e-07 ) ergs/cm2
Band function

Spectral model in the Band function:
------------------------------------------------------------
Parameters  : value       lower 90%   higher 90%
alpha       :    (     )
beta        :     (     )
Epeak [keV] :       (   )
Norm@50keV   :     (     )
------------------------------------------------------------

Photon flux (15-150 keV)    in  sec:  (    ) ph/cm2/s
Energy fluence (15-150 keV)             : 0 ( 0  0 ) ergs/cm2
S(25-50 keV) vs. S(50-100 keV) plot
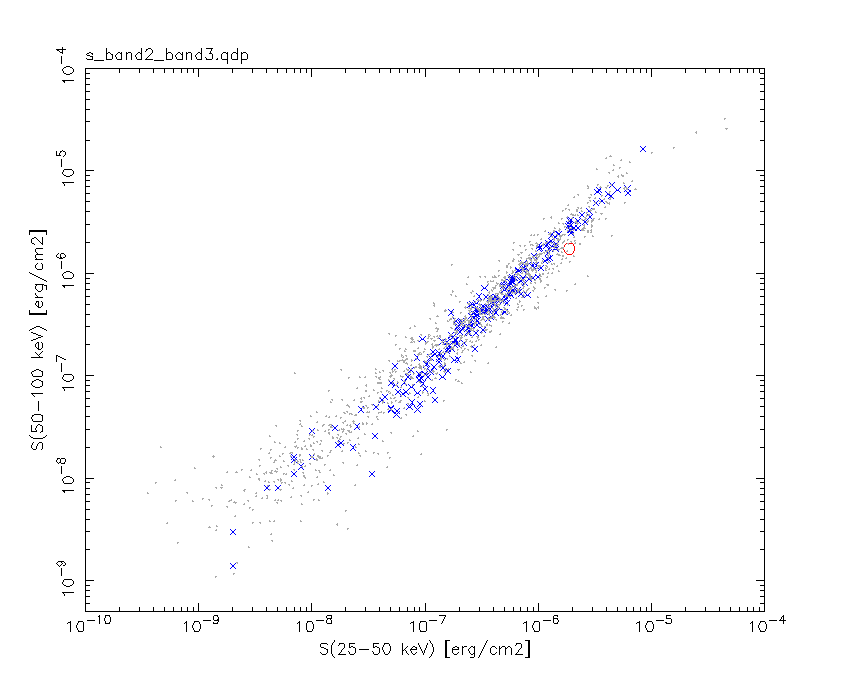
S(25-50 keV)  = 1.88e-06
S(50-100 keV) = 1.74e-06
T90 vs. Hardness ratio plot
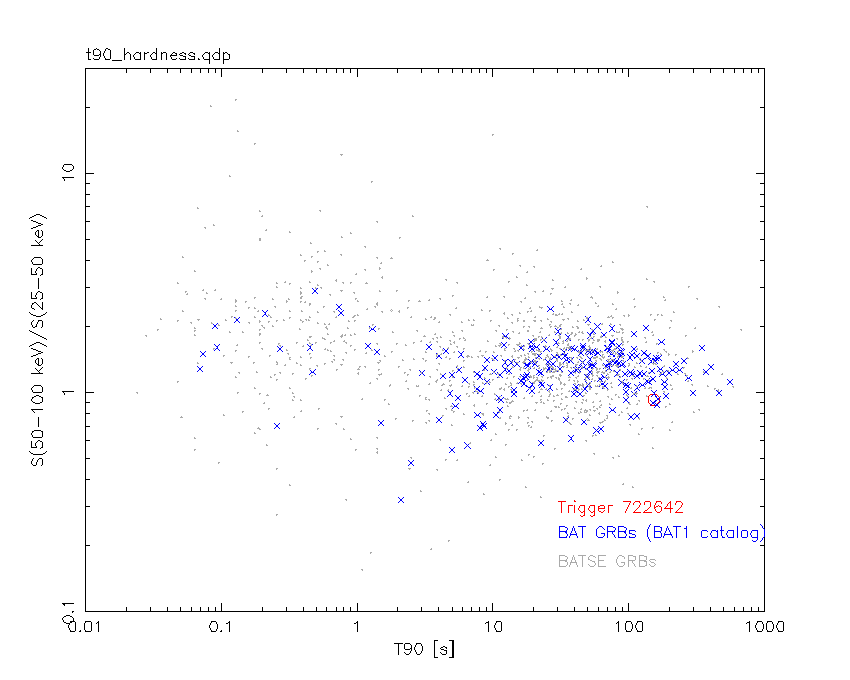
T90                                   = 152.311999976635 sec.
Hardness ratio (energy fluence ratio) = 0.925532
Color vs. Color plot

Count Ratio  (25-50 keV) / (15-25 keV) = 1.02972
Count Ratio (50-100 keV) / (15-25 keV) = 0.502858
Mask shadow pattern

IMX = 1.960316106348038E-01, IMY = 5.387574895141908E-01
TIME vs. PHA plot around the trigger time

Blue+Cyan dotted lines: Time interval of the scaled map
From 0.000000 to 1.024000
TIME vs. DetID plot around the trigger time
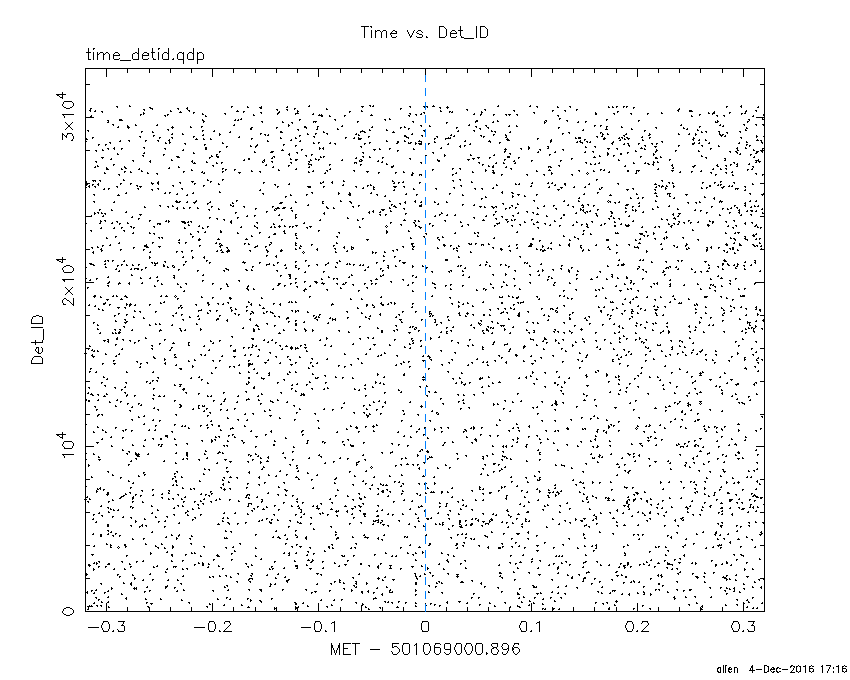
Blue+Cyan dotted lines: Time interval of the scaled map
From 0.000000 to 1.024000
100 us light curve (15-350 keV)

Blue+Cyan dotted lines: Time interval of the scaled map
From 0.000000 to 1.024000
Spacecraft aspect plot

Bright source in the pre-burst/pre-slew/post-slew images
Pre-burst image of 15-350 keV band
Time interval of the image:
-460.795400 -442.400200
-239.896000 -6.456000

# RAcent  DECcent POSerr Theta    Phi  PeakCts   SNR AngSep     Name
#  [deg]    [deg]    ['] [deg]  [deg]                   [']
 19.4876 -22.8531    3.1  41.4   65.4   3.1002   3.8 ------	UNKNOWN
342.1504 -27.7781    3.1  42.6   13.7   1.3283   3.7 ------	UNKNOWN
343.7355 -30.1288    2.8  39.9   14.3   1.3393   4.2 ------	UNKNOWN
111.7112 -50.7592    2.8  47.6 -176.9   1.7296   4.1 ------	UNKNOWN
301.3947 -30.1016    2.8  56.9  -29.8   5.8881   4.1 ------	UNKNOWN
Pre-slew background subtracted image of 15-350 keV band
Time interval of the image:
-6.456000 13.004600

# RAcent  DECcent POSerr Theta    Phi  PeakCts   SNR AngSep     Name
#  [deg]    [deg]    ['] [deg]  [deg]                   [']
135.6676 -53.6606    2.5  53.1 -158.8   0.8675   4.6 ------	UNKNOWN
298.8191 -67.6725    0.7  29.8  -70.0   1.3963  16.4 ------	UNKNOWN
Post-slew image of 15-350 keV band
Time interval of the image:
63.604620 962.134000

# RAcent  DECcent POSerr Theta    Phi  PeakCts   SNR AngSep     Name
#  [deg]    [deg]    ['] [deg]  [deg]                   [']
170.0214 -60.5466   18.2  46.5 -163.2  -0.8441  -0.6    9.8	Cen X-3
186.5953 -62.7527    2.9  40.8 -154.7   4.1077   4.0    2.0	GX 301-2
255.9907 -38.0253    0.0  37.9  -75.8   3.6928   2.1   10.9	4U 1700-377
256.6201 -36.4973   12.1  39.1  -74.1   1.7141   1.0   10.0	GX 349+2
264.6216 -44.3284   11.3  29.5  -70.1  -1.0420  -1.0    9.0	4U 1735-44
270.3866 -24.9879    6.6  46.1  -51.9   5.1715   1.7    7.8	GX 5-1
270.0826 -25.7435    7.5  45.5  -52.6  -4.2345  -1.5   11.9	GRS 1758-258
275.9579 -30.5285   21.1  39.6  -46.9   0.6026   0.6    9.8	H1820-303
284.8944 -25.0246    5.9  43.5  -33.6  -2.1238  -1.9    9.9	HT1900.1-2455
263.2192 -33.8289   17.7  39.6  -64.6  -1.3004  -0.6   11.5	GX 354-0
318.3007 -19.2614    3.5  50.0    9.1   4.8442   3.3 ------	UNKNOWN
298.8622 -67.6877    0.7   0.0  -65.9   9.9861  17.5 ------	UNKNOWN
153.8534 -72.4206    2.4  38.0 -178.7   3.9907   4.8 ------	UNKNOWN
201.5728 -60.3260    3.0  38.8 -143.4   3.7152   3.8 ------	UNKNOWN
286.3713 -11.5497    4.8  56.8  -29.8  11.7215   2.4 ------	UNKNOWN
Plot creation:
Sun Dec  4 17:16:15 EST 2016