Estimated redshift from machine learning (Ukwatta et al. 2016) - may take a few minutes to calcaulte
Image
Pre-slew 15-350 keV image (Event data; bkg subtracted)

#   RAcent  DECcent POSerr  Theta    Phi     Peak Cts     SNR  Name
  299.7379 +35.2025 0.0514    9.6 -118.7       0.2951     3.7  TRIG_00723539
------------------------------------------

Foreground time interval of the image:
 -0.408  48.281 (delta_t =  48.689 [sec])
Background time interval of the image:
-224.419  -0.408 (delta_t = 224.011 [sec])
Lightcurves
Notes:
- 1) All plots contain as much data as has been downloaded to date.
- 2) The mask-weighted light curves are using the flight position.
- 3) Multiple plots of different time binning/intervals are shown to cover all scenarios of short/long GRBs, rate/image triggers, and real/false positives.
- 4) For all the mask-weighted lightcurves, the y-axis units are counts/sec/det where a det is 0.4 x 0.4 = 0.16 sq cm.
- 5) The verticle lines correspond to following: green dotted lines are T50 interval, black dotted lines are T90 interval, blue solid line(s) is a spacecraft slew start time, and orange solid line(s) is a spacecraft slew end time.
- 6) Time of each bin is in the middle of the bin.
1 s binning
From T0-310 s to T0+310 s

From T100_start - 20 s to T100_end + 30 s

Full time interval

64 ms binning
Full time interval

From T100_start to T100_end

From T0-5 sec to T0+5 sec

16 ms binning
From T100_start-5 s to T100_start+5 s

Blue+Cyan dotted lines: Time interval of the scaled map
From 0.000000 to 4.096000
8 ms binning
From T100_start-3 s to T100_start+3 s

Blue+Cyan dotted lines: Time interval of the scaled map
From 0.000000 to 4.096000
2 ms binning
From T100_start-1 s to T100_start+1 s

Blue+Cyan dotted lines: Time interval of the scaled map
From 0.000000 to 4.096000
SN=5 or 10 sec. binning (whichever binning is satisfied first)

SN=5 or 10 sec. binning (T < 200 sec)

Spectra
Notes:
- 1) The fitting includes the systematic errors.
- 2) For long bursts, a spectral fit of the pre-slew DRM will introduce some errors in both a spectral shape and a normalization if the PHA file contains a lot of the slew/post-slew time interval.
- 3) For fits to more complicated models (e.g. a power-law over a cutoff power-law), the BAT team has decided to require a chi-square improvement of more than 6 for each extra dof.
- 4) For short bursts (T90<1sec), the specrtum is also fit with Blackbody, OTTB, and Double Blackbody.
Time averaged spectrum fit using the pre-slew DRM
Power-law model

Multiple GTIs in the spectrum
tstart tstop
-0.408000 285.480000
286.280000 425.612000

Spectral model in power-law:
------------------------------------------------------------
Parameters  : value       lower 90%   higher 90%
Photon index: 1.68821     ( -0.0624478   0.0626967 )
Norm@50keV  : 1.83332E-03    ( -6.08773e-05   6.07505e-05 )
------------------------------------------------------------
#Fit statistic : Chi-Squared =          77.11 using 59 PHA bins.
# Reduced chi-squared =          1.353 for     57 degrees of freedom
# Null hypothesis probability =   3.924441e-02

Photon flux (15-150 keV)    in 425.2 sec: 0.242491 ( -0.00838028  0.00840358 ) ph/cm2/s
Energy fluence (15-150 keV)             : 7.22445e-06 ( -2.51624e-07  2.52453e-07 ) ergs/cm2
Cutoff power-law model

Multiple GTIs in the spectrum
tstart tstop
-0.408000 285.480000
286.280000 425.612000
Spectral model in the cutoff power-law:
------------------------------------------------------------
Parameters  : value       lower 90%   higher 90%
Photon index: 1.47559     ( -0.253155   0.233475 )
Epeak [keV] : 122.123      ( -41.2868 -122.146 )
Norm@50keV  : 2.34232E-03    ( -0.000530017   0.000771702 )
------------------------------------------------------------
#Fit statistic : Chi-Squared =          74.81 using 59 PHA bins.
# Reduced chi-squared =          1.336 for     56 degrees of freedom
# Null hypothesis probability =   4.728940e-02

Photon flux (15-150 keV)    in 425.2 sec: 0.238759 ( -0.009293  0.009312 ) ph/cm2/s
Energy fluence (15-150 keV)             : 7.0829e-06 ( -2.99426e-07  2.9832e-07 ) ergs/cm2
Band function

Multiple GTIs in the spectrum
tstart tstop
-0.408000 285.480000
286.280000 425.612000

Spectral model in the Band function:
------------------------------------------------------------
Parameters  : value       lower 90%   higher 90%
alpha       : 1.54798   ( -3.702   -2.73576 )
beta        : -1.77705    ( -0.0857861   0.081534 )
Epeak [keV] : 30.0269      ( -3.87087 23.5445 )
Norm@50keV   : 0.350067    ( -0.348417   64.5038 )
------------------------------------------------------------
#Fit statistic : Chi-Squared =          67.93 using 59 PHA bins.
# Reduced chi-squared =          1.235 for     55 degrees of freedom
# Null hypothesis probability =   1.131313e-01

Photon flux (15-150 keV)    in 425.2 sec:  (    ) ph/cm2/s
Energy fluence (15-150 keV)             : 7.04118e-06 ( -7.03821e-06  -2.7047e-07 ) ergs/cm2
Single BB

Spectral model blackbody:
------------------------------------------------------------
Parameters  : value    Lower 90%  Upper 90%
kT [keV]    : 13.6451  (  )
R^2/D10^2   : 3.51764E-02  (   )
(R is the radius in km and D10 is the distance to the source in units of 10 kpc)
------------------------------------------------------------
#Fit statistic : Chi-Squared =         279.45 using 59 PHA bins.
# Reduced chi-squared =         4.9026 for     57 degrees of freedom
# Null hypothesis probability =   4.459781e-31

Energy  Fluence     90% Error
[keV]   [erg/cm2]   [erg/cm2]
15- 25  5.895e-07   4.103e-08
25- 50  2.136e-06   9.163e-08
50-150  2.584e-06   1.805e-07
15-150  5.310e-06   1.935e-07
Thermal bremsstrahlung (OTTB)

Spectral model: thermal bremsstrahlung
------------------------------------------------------------
Parameters  : value         Lower 90%    Upper 90%
kT [keV]    : 146.385       (-24.268      26.0606)
Norm        : 0.985321       (-0.0389973     0.0493685)
------------------------------------------------------------
#Fit statistic : Chi-Squared =          76.31 using 59 PHA bins.
# Reduced chi-squared =          1.339 for     57 degrees of freedom
# Null hypothesis probability =   4.475078e-02

Energy  Fluence     90% Error
[keV]   [erg/cm2]   [erg/cm2]
15- 25  1.078e-06   6.399e-08
25- 50  1.991e-06   1.225e-07
50-150  3.891e-06   9.720e-07
15-150  6.961e-06   1.084e-06
Double BB

Spectral model: bbodyrad<1> + bbodyrad<2>
------------------------------------------------------------
Parameters  : value         Lower 90%    Upper 90%
kT1 [keV]   : 7.23708        (-0.723215      0.771211)
R1^2/D10^2  : 0.249649        (-0.0722234      0.110822)
kT2 [keV]   : 26.9384        (-3.36565      4.77427)
R2^2/D10^2  : 2.31126E-03    (-0.00100805   0.00147523)
------------------------------------------------------------
#Fit statistic : Chi-Squared =          71.27 using 59 PHA bins.
# Reduced chi-squared =          1.296 for     55 degrees of freedom
# Null hypothesis probability =   6.909178e-02

Energy  Fluence     90% Error
[keV]   [erg/cm2]   [erg/cm2]
15- 25  1.042e-06   1.106e-07
25- 50  2.047e-06   1.484e-07
50-150  3.963e-06   5.083e-07
15-150  7.052e-06   6.314e-07
Peak spectrum fit
Power-law model

Time interval is from    2.448 sec. to    3.448 sec.

Spectral model in power-law:
------------------------------------------------------------
Parameters  : value       lower 90%   higher 90%
Photon index: 1.54758     ( -0.320683   0.328433 )
Norm@50keV  : 5.70753E-03    ( -0.00115334   0.00113096 )
------------------------------------------------------------
#Fit statistic : Chi-Squared =          49.87 using 59 PHA bins.
# Reduced chi-squared =         0.8749 for     57 degrees of freedom
# Null hypothesis probability =   7.371308e-01

Photon flux (15-150 keV)    in 1 sec: 0.722032 ( -0.136204  0.136293 ) ph/cm2/s
Energy fluence (15-150 keV)             : 5.37502e-08 ( -1.16502e-08  1.19269e-08 ) ergs/cm2
Cutoff power-law model

Time interval is from    2.448 sec. to    3.448 sec.
Spectral model in the cutoff power-law:
------------------------------------------------------------
Parameters  : value       lower 90%   higher 90%
Photon index: 1.24056     ( -1.4515   0.61867 )
Epeak [keV] : 114.370      ( -114.372 -114.372 )
Norm@50keV  : 8.39258E-03    ( -0.00469942   0.0439589 )
------------------------------------------------------------
#Fit statistic : Chi-Squared =          49.67 using 59 PHA bins.
# Reduced chi-squared =         0.8869 for     56 degrees of freedom
# Null hypothesis probability =   7.119468e-01

Photon flux (15-150 keV)    in 1 sec: 0.715054 ( -0.138878  0.137404 ) ph/cm2/s
Energy fluence (15-150 keV)             : 5.22332e-08 ( -1.31025e-08  1.30002e-08 ) ergs/cm2
Band function

Time interval is from    2.448 sec. to    3.448 sec.

Spectral model in the Band function:
------------------------------------------------------------
Parameters  : value       lower 90%   higher 90%
alpha       : 4.66062   ( -4.66062   -4.66062 )
beta        : -1.78595    ( -0.526681   0.415073 )
Epeak [keV] : 27.8183      ( -10.8363 7.50099 )
Norm@50keV   : 202.374    ( -37.5446   3.53819e+06 )
------------------------------------------------------------
#Fit statistic : Chi-Squared =          48.37 using 59 PHA bins.
# Reduced chi-squared =         0.8795 for     55 degrees of freedom
# Null hypothesis probability =   7.240703e-01

Photon flux (15-150 keV)    in 1 sec:  (    ) ph/cm2/s
Energy fluence (15-150 keV)             : 0 ( 0  0 ) ergs/cm2
Single BB

Spectral model blackbody:
------------------------------------------------------------
Parameters  : value    Lower 90%  Upper 90%
kT [keV]    : 12.7553  (-2.95731  4.20838)
R^2/D10^2   : 0.143832  (-0.0914961   0.22782)
(R is the radius in km and D10 is the distance to the source in units of 10 kpc)
------------------------------------------------------------
#Fit statistic : Chi-Squared =          56.82 using 59 PHA bins.
# Reduced chi-squared =         0.9969 for     57 degrees of freedom
# Null hypothesis probability =   4.817043e-01

Energy  Fluence     90% Error
[keV]   [erg/cm2]   [erg/cm2]
15- 25  4.963e-09   1.744e-09
25- 50  1.674e-08   5.399e-09
50-150  1.703e-08   7.287e-09
15-150  3.874e-08   1.412e-08
Thermal bremsstrahlung (OTTB)

Spectral model: thermal bremsstrahlung
------------------------------------------------------------
Parameters  : value         Lower 90%    Upper 90%
kT [keV]    : 195.090       (-114.199      -194.332)
Norm        : 2.95567       (-0.556111     0.691703)
------------------------------------------------------------
#Fit statistic : Chi-Squared =          49.64 using 59 PHA bins.
# Reduced chi-squared =         0.8710 for     57 degrees of freedom
# Null hypothesis probability =   7.446619e-01

Energy  Fluence     90% Error
[keV]   [erg/cm2]   [erg/cm2]
15- 25  7.381e-09   4.323e-09
25- 50  1.416e-08   8.100e-09
50-150  3.083e-08   1.716e-08
15-150  5.238e-08   2.897e-08
Double BB

Spectral model: bbodyrad<1> + bbodyrad<2>
------------------------------------------------------------
Parameters  : value         Lower 90%    Upper 90%
kT1 [keV]   : 7.13385        (-2.65321      3.80159)
R1^2/D10^2  : 0.814639        (-0.606921      3.23528)
kT2 [keV]   : 29.0035        (-24.5162      170.133)
R2^2/D10^2  : 6.05385E-03    (-0.0059589   0.0404048)
------------------------------------------------------------
#Fit statistic : Chi-Squared =          48.48 using 59 PHA bins.
# Reduced chi-squared =         0.8815 for     55 degrees of freedom
# Null hypothesis probability =   7.202506e-01

Energy  Fluence     90% Error
[keV]   [erg/cm2]   [erg/cm2]
15- 25  7.603e-09   4.409e-09
25- 50  1.459e-08   7.730e-09
50-150  3.147e-08   1.863e-08
15-150  5.366e-08   2.786e-08
Pre-slew spectrum (Pre-slew PHA with pre-slew DRM)
Power-law model

Spectral model in power-law:
------------------------------------------------------------
Parameters  : value       lower 90%   higher 90%
Photon index: 1.72110     ( -0.136045   0.138553 )
Norm@50keV  : 1.94581E-03    ( -0.000168357   0.000166403 )
------------------------------------------------------------
#Fit statistic : Chi-Squared =          63.41 using 59 PHA bins.
# Reduced chi-squared =          1.112 for     57 degrees of freedom
# Null hypothesis probability =   2.607148e-01

Photon flux (15-150 keV)    in 48.69 sec: 0.260360 ( -0.0200196  0.0200272 ) ph/cm2/s
Energy fluence (15-150 keV)             : 8.75821e-07 ( -7.89353e-08  8.00035e-08 ) ergs/cm2
Cutoff power-law model

Spectral model in the cutoff power-law:
------------------------------------------------------------
Parameters  : value       lower 90%   higher 90%
Photon index: 1.25281     ( -0.637624   0.521078 )
Epeak [keV] : 68.8825      ( -19.6827 -68.9282 )
Norm@50keV  : 3.58305E-03    ( -0.00170966   0.00463018 )
------------------------------------------------------------
#Fit statistic : Chi-Squared =          61.29 using 59 PHA bins.
# Reduced chi-squared =          1.094 for     56 degrees of freedom
# Null hypothesis probability =   2.921153e-01

Photon flux (15-150 keV)    in 48.69 sec: 0.255241 ( -0.020903  0.02087 ) ph/cm2/s
Energy fluence (15-150 keV)             : 8.28864e-07 ( -9.51549e-08  9.65961e-08 ) ergs/cm2
Band function

Spectral model in the Band function:
------------------------------------------------------------
Parameters  : value       lower 90%   higher 90%
alpha       : 4.61089   ( -4.86522   -4.61089 )
beta        : -1.97138    ( -0.207818   0.188276 )
Epeak [keV] : 26.9200      ( -3.21099 2.9779 )
Norm@50keV   : 86.9090    ( -6.5716   411.124 )
------------------------------------------------------------
#Fit statistic : Chi-Squared =          54.54 using 59 PHA bins.
# Reduced chi-squared =         0.9916 for     55 degrees of freedom
# Null hypothesis probability =   4.923259e-01

Photon flux (15-150 keV)    in 48.69 sec:  (    ) ph/cm2/s
Energy fluence (15-150 keV)             : 8.36489e-07 ( -8.36149e-07  -8.16921e-08 ) ergs/cm2
S(25-50 keV) vs. S(50-100 keV) plot

S(25-50 keV)  = 1.95e-06
S(50-100 keV) = 2.42e-06
T90 vs. Hardness ratio plot

T90                                   = 405.827999949455 sec.
Hardness ratio (energy fluence ratio) = 1.24103
Color vs. Color plot

Count Ratio  (25-50 keV) / (15-25 keV) = 1.32272
Count Ratio (50-100 keV) / (15-25 keV) = 0.829065
Mask shadow pattern

IMX = -8.120808237941761E-02, IMY = 1.484304951506818E-01
TIME vs. PHA plot around the trigger time

Blue+Cyan dotted lines: Time interval of the scaled map
From 0.000000 to 4.096000
TIME vs. DetID plot around the trigger time

Blue+Cyan dotted lines: Time interval of the scaled map
From 0.000000 to 4.096000
100 us light curve (15-350 keV)
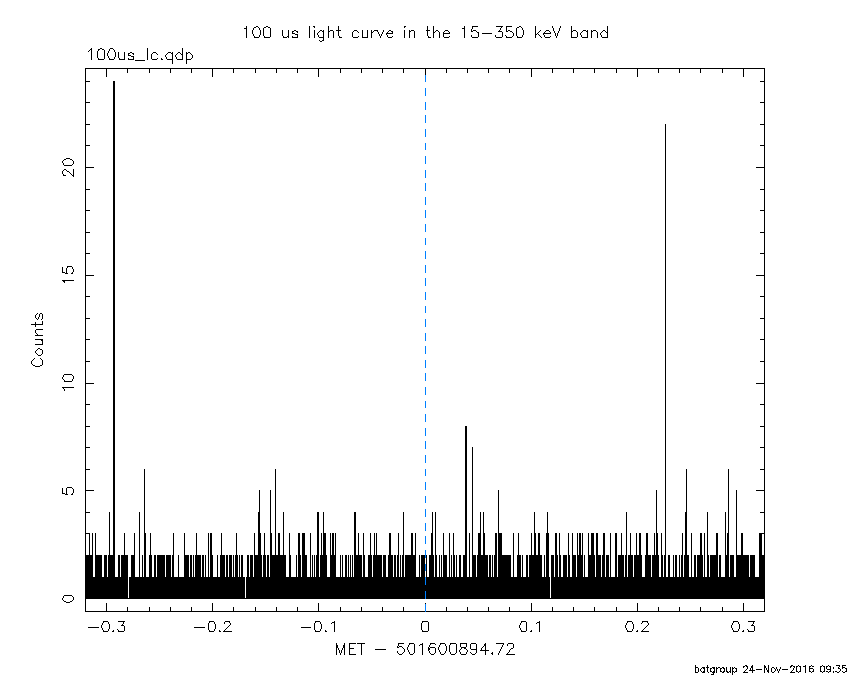
Blue+Cyan dotted lines: Time interval of the scaled map
From 0.000000 to 4.096000
Spacecraft aspect plot

Bright source in the pre-burst/pre-slew/post-slew images
Pre-burst image of 15-350 keV band
Time interval of the image:
-224.419400 -0.408000

# RAcent  DECcent POSerr Theta    Phi  PeakCts   SNR AngSep     Name
#  [deg]    [deg]    ['] [deg]  [deg]                   [']
254.4578  35.3334   85.6  39.3  -50.6   0.0558   0.1    0.5	Her X-1
288.8030  10.9527    3.0  35.8 -117.8   1.5401   3.9    0.5	GRS 1915+105
299.5908  35.1985    0.3   9.7 -118.0   6.5378  34.2    0.2	Cyg X-1
308.0891  40.9329    1.8   3.7  176.2   1.3521   6.5    1.5	Cyg X-3
326.2970  38.2969    4.1  16.9  136.1   0.6348   2.8    6.1	Cyg X-2
331.5903  80.4414    3.1  37.8   41.0   1.4363   3.7 ------	UNKNOWN
313.3718   9.7473    2.8  34.9 -160.3   1.0037   4.1 ------	UNKNOWN
312.1314 -12.9786    3.5  57.2 -154.1   4.5750   3.3 ------	UNKNOWN
240.0538  33.3574    2.9  50.6  -44.6   4.1569   4.0 ------	UNKNOWN
247.5445  29.7193    2.6  47.2  -53.2   4.1992   4.4 ------	UNKNOWN
Pre-slew background subtracted image of 15-350 keV band
Time interval of the image:
-0.408000 48.280610

# RAcent  DECcent POSerr Theta    Phi  PeakCts   SNR AngSep     Name
#  [deg]    [deg]    ['] [deg]  [deg]                   [']
254.4709  35.1788    4.6  39.4  -50.9   0.3992   2.5    9.8	Her X-1
288.7627  10.8823    5.5  35.9 -117.8   0.3543   2.1    4.3	GRS 1915+105
299.7379  35.2025    3.1   9.6 -118.7   0.2951   3.7    7.2	Cyg X-1
308.0481  40.8535    2.9   3.7  177.3   0.3235   4.0    6.6	Cyg X-3
326.1578  38.2539   11.6  16.8  136.4  -0.0858  -1.0    4.1	Cyg X-2
353.9196  26.3442    1.9  42.9  131.6   1.6390   6.0 ------	UNKNOWN
343.8461   1.5326    2.4  54.5  163.9   2.1063   4.8 ------	UNKNOWN
289.9957   1.0778    2.0  44.9 -124.3   1.7649   5.8 ------	UNKNOWN
Post-slew image of 15-350 keV band
Time interval of the image:
79.380590 285.480000
286.280000 366.080590

# RAcent  DECcent POSerr Theta    Phi  PeakCts   SNR AngSep     Name
#  [deg]    [deg]    ['] [deg]  [deg]                   [']
254.6581  35.3777    9.2  36.3  -41.7   0.4963   1.3   10.0	Her X-1
288.7720  10.9531    1.8  26.2 -120.7   2.2716   6.5    1.6	GRS 1915+105
299.5992  35.2100    0.3   0.0  138.2   8.9721  36.0    0.7	Cyg X-1
308.1304  41.0119    1.0   8.9   81.3   2.7647  11.4    3.7	Cyg X-3
326.2222  38.3315    3.5  21.5  108.4   0.9838   3.3    2.5	Cyg X-2
334.6768   2.0405    2.3  46.5  162.2   3.4409   5.0 ------	UNKNOWN
322.1620  25.5579    2.3  21.7  144.9   1.3324   5.1 ------	UNKNOWN
258.0413  56.5413    2.8  35.1   -4.9   1.3596   4.2 ------	UNKNOWN
307.4352 -21.5118    3.2  57.2 -154.1   5.8619   3.6 ------	UNKNOWN
Plot creation:
Thu Nov 24 09:35:34 EST 2016