Special notes of this burst
Image
Pre-slew 15.0-350.0 keV image (Event data)

#   RAcent    DECcent   POSerr    Theta     Phi              Peak Cts       SNR   Name
   91.7160   -26.8013   0.0052    39.3860   174.0539         2.6871238     36.640 TRIG_00727541

Foreground time interval of the image:
 -0.536   8.376 (delta_t =   8.912 [sec])
Background time interval of the image:
-239.640  -0.536 (delta_t = 239.104 [sec])
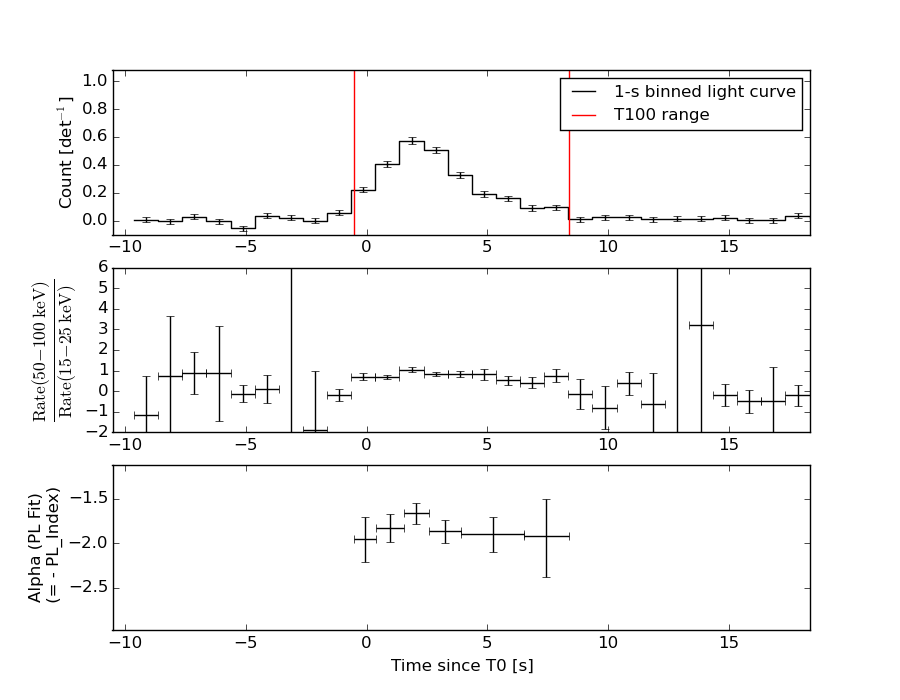
Lightcurves
Notes:
- 1) The mask-weighted light curves are using the flight position.
- 2) Multiple plots of different time binning/intervals are shown to cover all scenarios of short/long GRBs, rate/image triggers, and real/false positives.
- 3) For all the mask-weighted lightcurves, the y-axis units are counts/sec/det where a det is 0.4 x 0.4 = 0.16 sq cm.
- 4) The verticle lines correspond to following: green dotted lines are T50 interval, black dotted lines are T90 interval, blue solid line(s) is a spacecraft slew start time, and orange solid line(s) is a spacecraft slew end time.
- 5) Time of each bin is in the middle of the bin.
1 s binning
From T0-310 s to T0+310 s

From T100_start - 20 s to T100_end + 30 s

Full time interval
64 ms binning
Full time interval
From T100_start to T100_end

From T0-5 sec to T0+5 sec
16 ms binning
From T100_start-5 s to T100_start+5 s

Blue+Cyan dotted lines: Time interval of the scaled map
From 0.000000 to 0.512000
8 ms binning
From T100_start-3 s to T100_start+3 s
Blue+Cyan dotted lines: Time interval of the scaled map
From 0.000000 to 0.512000
2 ms binning
From T100_start-1 s to T100_start+1 s

Blue+Cyan dotted lines: Time interval of the scaled map
From 0.000000 to 0.512000
SN=5 or 10 sec. binning (whichever binning is satisfied first)
SN=5 or 10 sec. binning (T < 200 sec)

Quad-rate summed light curves (from T0-300s to T0+1000s)

Spectral Evolution
Spectra
Notes:
- 1) The fitting includes the systematic errors.
- 2) When the burst includes telescope slew time periods, the fitting uses an average response file made from multiple 5-s response files through out the slew time plus single time preiod for the non-slew times, and weighted by the total counts in the corresponding time period using addrmf. An average response file is needed becuase a spectral fit using the pre-slew DRM will introduce some errors in both a spectral shape and a normalization if the PHA file contains a lot of the slew/post-slew time interval.
- 3) For fits to more complicated models (e.g. a power-law over a cutoff power-law), the BAT team has decided to require a chi-square improvement of more than 6 for each extra dof.
Time averaged spectrum fit using the average DRM
Power-law model

Time interval is from   -0.536 sec. to    8.376 sec.

Spectral model in power-law:
------------------------------------------------------------
Parameters  : value       lower 90%   higher 90%
Photon index: 1.84416     ( -0.0790899   0.0800909 )
Norm@50keV  : 1.87926E-02    ( -0.000878568   0.00087453 )
------------------------------------------------------------
#Fit statistic : Chi-Squared =          53.08 using 59 PHA bins.
# Reduced chi-squared =         0.9312 for     57 degrees of freedom
# Null hypothesis probability =   6.230034e-01

Photon flux (15-150 keV)    in 8.912 sec: 2.63540 ( -0.12238  0.12267 ) ph/cm2/s
Energy fluence (15-150 keV)             : 1.54033e-06 ( -7.24028e-08  7.26336e-08 ) ergs/cm2
Cutoff power-law model

Time interval is from   -0.536 sec. to    8.376 sec.
Spectral model in the cutoff power-law:
------------------------------------------------------------
Parameters  : value       lower 90%   higher 90%
Photon index: 1.29361     ( -0.366627   0.337473 )
Epeak [keV] : 61.8766      ( -9.26421 24.5389 )
Norm@50keV  : 3.61368E-02    ( -0.0117173   0.0194173 )
------------------------------------------------------------
#Fit statistic : Chi-Squared =          44.96 using 59 PHA bins.
# Reduced chi-squared =         0.8029 for     56 degrees of freedom
# Null hypothesis probability =   8.545634e-01

Photon flux (15-150 keV)    in 8.912 sec: 2.55482 ( -0.13102  0.13141 ) ph/cm2/s
Energy fluence (15-150 keV)             : 0 ( 0  0 ) ergs/cm2
Band function

Time interval is from   -0.536 sec. to    8.376 sec.


Spectral model in the Band function:
------------------------------------------------------------
Parameters  : value       lower 90%   higher 90%
alpha       :    (     )
beta        :     (     )
Epeak [keV] :       (   )
Norm@50keV   :     (     )
------------------------------------------------------------

Photon flux (15-150 keV)    in  sec:  (    ) ph/cm2/s
Energy fluence (15-150 keV)             : 0 ( 0  0 ) ergs/cm2
Single BB

Spectral model blackbody:
------------------------------------------------------------
Parameters  : value    Lower 90%  Upper 90%
kT [keV]    : 12.3463  (  )
R^2/D10^2   : 0.554513  (   )
(R is the radius in km and D10 is the distance to the source in units of 10 kpc)
------------------------------------------------------------
#Fit statistic : Chi-Squared =         138.34 using 59 PHA bins.
# Reduced chi-squared =         2.4270 for     57 degrees of freedom
# Null hypothesis probability =   1.029416e-08

Energy  Fluence     90% Error
[keV]   [erg/cm2]   [erg/cm2]
15- 25  1.596e-07   1.337e-08
25- 50  5.192e-07   2.847e-08
50-150  4.848e-07   4.438e-08
15-150  1.164e-06   5.615e-08
Thermal bremsstrahlung (OTTB)

Spectral model: thermal bremsstrahlung
------------------------------------------------------------
Parameters  : value         Lower 90%    Upper 90%
kT [keV]    : 97.7740       (-14.2735      18.5445)
Norm        : 11.5961       (-0.761291     0.830194)
------------------------------------------------------------
#Fit statistic : Chi-Squared =          44.82 using 59 PHA bins.
# Reduced chi-squared =         0.7863 for     57 degrees of freedom
# Null hypothesis probability =   8.790235e-01

Energy  Fluence     90% Error
[keV]   [erg/cm2]   [erg/cm2]
15- 25  2.701e-07   2.175e-08
25- 50  4.649e-07   2.415e-08
50-150  7.437e-07   1.970e-07
15-150  1.479e-06   2.090e-07
Double BB

Spectral model: bbodyrad<1> + bbodyrad<2>
------------------------------------------------------------
Parameters  : value         Lower 90%    Upper 90%
kT1 [keV]   : 7.47459        (-1.10939      1.12188)
R1^2/D10^2  : 2.51255        (-0.891608      1.72275)
kT2 [keV]   : 24.2567        (-4.2941      7.26088)
R2^2/D10^2  : 2.96884E-02    (-0.0186844   0.0366094)
------------------------------------------------------------
#Fit statistic : Chi-Squared =          47.05 using 59 PHA bins.
# Reduced chi-squared =         0.8555 for     55 degrees of freedom
# Null hypothesis probability =   7.682849e-01

Energy  Fluence     90% Error
[keV]   [erg/cm2]   [erg/cm2]
15- 25  2.415e-07   3.378e-08
25- 50  4.852e-07   5.735e-08
50-150  7.413e-07   1.907e-07
15-150  1.468e-06   2.678e-07
Peak spectrum fit
Power-law model

Time interval is from    1.556 sec. to    2.556 sec.

Spectral model in power-law:
------------------------------------------------------------
Parameters  : value       lower 90%   higher 90%
Photon index: 1.66940     ( -0.112971   0.114646 )
Norm@50keV  : 4.02942E-02    ( -0.00289238   0.0028778 )
------------------------------------------------------------
#Fit statistic : Chi-Squared =          91.72 using 59 PHA bins.
# Reduced chi-squared =          1.609 for     57 degrees of freedom
# Null hypothesis probability =   2.417836e-03

Photon flux (15-150 keV)    in 1 sec: 5.29579 ( -0.37249  0.37294 ) ph/cm2/s
Energy fluence (15-150 keV)             : 3.74111e-07 ( -2.80999e-08  2.82446e-08 ) ergs/cm2
Cutoff power-law model

Time interval is from    1.556 sec. to    2.556 sec.
Spectral model in the cutoff power-law:
------------------------------------------------------------
Parameters  : value       lower 90%   higher 90%
Photon index: 0.851897     ( -0.604212   0.525392 )
Epeak [keV] : 66.9895      ( -11.7911 36.9951 )
Norm@50keV  : 0.108628    ( -0.0505174   0.116262 )
------------------------------------------------------------
#Fit statistic : Chi-Squared =          84.24 using 59 PHA bins.
# Reduced chi-squared =          1.504 for     56 degrees of freedom
# Null hypothesis probability =   8.674589e-03

Photon flux (15-150 keV)    in 1 sec: 4.40546 ( -0.44189  0.47416 ) ph/cm2/s
Energy fluence (15-150 keV)             : 3.54111e-07 ( -3.13434e-08  3.13319e-08 ) ergs/cm2
Band function

Time interval is from    1.556 sec. to    2.556 sec.


Spectral model in the Band function:
------------------------------------------------------------
Parameters  : value       lower 90%   higher 90%
alpha       :    (     )
beta        :     (     )
Epeak [keV] :       (   )
Norm@50keV   :     (     )
------------------------------------------------------------

Photon flux (15-150 keV)    in  sec:  (    ) ph/cm2/s
Energy fluence (15-150 keV)             : 0 ( 0  0 ) ergs/cm2
Single BB

Spectral model blackbody:
------------------------------------------------------------
Parameters  : value    Lower 90%  Upper 90%
kT [keV]    : 12.9431  (-0.974855  1.06806)
R^2/D10^2   : 1.01750  (-0.258773   0.339875)
(R is the radius in km and D10 is the distance to the source in units of 10 kpc)
------------------------------------------------------------
#Fit statistic : Chi-Squared =         112.63 using 59 PHA bins.
# Reduced chi-squared =         1.9760 for     57 degrees of freedom
# Null hypothesis probability =   1.600641e-05

Energy  Fluence     90% Error
[keV]   [erg/cm2]   [erg/cm2]
15- 25  3.615e-08   4.220e-09
25- 50  1.239e-07   1.035e-08
50-150  1.309e-07   1.985e-08
15-150  2.910e-07   2.255e-08
Thermal bremsstrahlung (OTTB)

Spectral model: thermal bremsstrahlung
------------------------------------------------------------
Parameters  : value         Lower 90%    Upper 90%
kT [keV]    : 143.818       (-37.8978      53.7175)
Norm        : 21.8606       (-1.74742     1.88672)
------------------------------------------------------------
#Fit statistic : Chi-Squared =          86.01 using 59 PHA bins.
# Reduced chi-squared =          1.509 for     57 degrees of freedom
# Null hypothesis probability =   7.800873e-03

Energy  Fluence     90% Error
[keV]   [erg/cm2]   [erg/cm2]
15- 25  5.634e-08   5.395e-09
25- 50  1.038e-07   1.272e-08
50-150  2.013e-07   7.426e-08
15-150  3.614e-07   8.795e-08
Double BB

Spectral model: bbodyrad<1> + bbodyrad<2>
------------------------------------------------------------
Parameters  : value         Lower 90%    Upper 90%
kT1 [keV]   : 9.68995        (-1.91169      2.26996)
R1^2/D10^2  : 2.36049        (-0.875107      1.96384)
kT2 [keV]   : 40.8367        (-18.0578      -41.2722)
R2^2/D10^2  : 1.00789E-02    (-0.00911655   0.0673733)
------------------------------------------------------------
#Fit statistic : Chi-Squared =          80.26 using 59 PHA bins.
# Reduced chi-squared =          1.459 for     55 degrees of freedom
# Null hypothesis probability =   1.475100e-02

Energy  Fluence     90% Error
[keV]   [erg/cm2]   [erg/cm2]
15- 25  4.676e-08   8.245e-09
25- 50  1.207e-07   2.325e-08
50-150  1.942e-07   8.493e-08
15-150  3.617e-07   1.052e-07
Pre-slew spectrum (Pre-slew PHA with pre-slew DRM)
Power-law model

Spectral model in power-law:
------------------------------------------------------------
Parameters  : value       lower 90%   higher 90%
Photon index: 1.84416     ( -0.0790899   0.0800909 )
Norm@50keV  : 1.87926E-02    ( -0.000878568   0.00087453 )
------------------------------------------------------------
#Fit statistic : Chi-Squared =          53.08 using 59 PHA bins.
# Reduced chi-squared =         0.9312 for     57 degrees of freedom
# Null hypothesis probability =   6.230034e-01

Photon flux (15-150 keV)    in 8.912 sec: 2.63525 ( -0.122366  0.122661 ) ph/cm2/s
Energy fluence (15-150 keV)             : 1.54007e-06 ( -7.24135e-08  7.26422e-08 ) ergs/cm2
Cutoff power-law model

Spectral model in the cutoff power-law:
------------------------------------------------------------
Parameters  : value       lower 90%   higher 90%
Photon index: 1.29359     ( -0.366621   0.337478 )
Epeak [keV] : 61.8760      ( -9.26413 24.5398 )
Norm@50keV  : 3.61377E-02    ( -0.0117174   0.0194172 )
------------------------------------------------------------
#Fit statistic : Chi-Squared =          44.96 using 59 PHA bins.
# Reduced chi-squared =         0.8029 for     56 degrees of freedom
# Null hypothesis probability =   8.545633e-01

Photon flux (15-150 keV)    in 8.912 sec: 2.55437 ( -0.13096  0.13134 ) ph/cm2/s
Energy fluence (15-150 keV)             : 1.4785e-06 ( -8.19637e-08  8.19191e-08 ) ergs/cm2
Band function

Spectral model in the Band function:
------------------------------------------------------------
Parameters  : value       lower 90%   higher 90%
alpha       :    (     )
beta        :     (     )
Epeak [keV] :       (   )
Norm@50keV   :     (     )
------------------------------------------------------------

Photon flux (15-150 keV)    in  sec:  (    ) ph/cm2/s
Energy fluence (15-150 keV)             : 0 ( 0  0 ) ergs/cm2
S(25-50 keV) vs. S(50-100 keV) plot

S(25-50 keV)  = 4.41e-07
S(50-100 keV) = 4.91e-07
T90 vs. Hardness ratio plot

T90                                   = 6.93199992179871 sec.
Hardness ratio (energy fluence ratio) = 1.11338
Color vs. Color plot

Count Ratio  (25-50 keV) / (15-25 keV) = 1.34481
Count Ratio (50-100 keV) / (15-25 keV) = 0.794058
Mask shadow pattern

IMX = -8.165842059037335E-01, IMY = -8.505038678301831E-02
TIME vs. PHA plot around the trigger time

Blue+Cyan dotted lines: Time interval of the scaled map
From 0.000000 to 0.512000
TIME vs. DetID plot around the trigger time
Blue+Cyan dotted lines: Time interval of the scaled map
From 0.000000 to 0.512000
100 us light curve (15-350 keV)
Blue+Cyan dotted lines: Time interval of the scaled map
From 0.000000 to 0.512000
Spacecraft aspect plot

Bright source in the pre-burst/pre-slew/post-slew images
Pre-burst image of 15-350 keV band
Time interval of the image:
-239.640000 -0.536000

# RAcent  DECcent POSerr Theta    Phi  PeakCts   SNR AngSep     Name
#  [deg]    [deg]    ['] [deg]  [deg]                   [']
 83.6356  22.0162    0.3  22.3   68.5   9.8289  37.3    0.2	Crab
108.8711 -16.3582    2.2  45.7  147.3   3.6948   5.3 ------	UNKNOWN
 82.6723  28.8121    2.6  27.1   56.7   1.3838   4.5 ------	UNKNOWN
 41.6312   0.9536    2.3  26.9  -70.4   1.5464   5.1 ------	UNKNOWN
 26.0660  25.4912    3.1  45.1  -30.8   1.6815   3.8 ------	UNKNOWN
 75.6335 -50.6291    2.8  56.4 -157.5   6.5551   4.1 ------	UNKNOWN
 71.4186 -51.7313    4.4  57.2 -154.2   5.0114   2.6 ------	UNKNOWN
Pre-slew background subtracted image of 15-350 keV band
Time interval of the image:
-0.536000 8.376000

# RAcent  DECcent POSerr Theta    Phi  PeakCts   SNR AngSep     Name
#  [deg]    [deg]    ['] [deg]  [deg]                   [']
 83.6269  22.0372   37.0  22.3   68.4  -0.0168  -0.3    1.4	Crab
 78.1352  26.7781    2.2  23.4   50.8   0.2654   5.3 ------	UNKNOWN
 91.7161 -26.8004    0.3  39.4  174.1   2.7015  36.8 ------	UNKNOWN
 63.2393  -4.9715    2.6  11.5 -126.0   0.1707   4.4 ------	UNKNOWN
 23.8612  36.0101    2.4  50.9  -18.7   0.4964   4.8 ------	UNKNOWN
 54.4571 -21.9187    2.4  30.5 -126.0   0.2829   4.8 ------	UNKNOWN
 72.0510 -49.1232    2.7  54.6 -154.9   0.8275   4.3 ------	UNKNOWN
Post-slew image of 15-350 keV band
Time interval of the image:
90.660590 962.455900

# RAcent  DECcent POSerr Theta    Phi  PeakCts   SNR AngSep     Name
#  [deg]    [deg]    ['] [deg]  [deg]                   [']
135.5744 -40.6264    3.4  38.6 -143.1   3.0522   3.4    4.8	Vela X-1
 97.0162  13.5643    2.9  40.7  102.4   7.8665   4.0 ------	UNKNOWN
 40.4958  -3.3441    3.6  54.2   20.9  12.3530   3.3 ------	UNKNOWN
 84.0848 -20.1093    2.8   9.7   46.6   1.9721   4.1 ------	UNKNOWN
 26.9853 -20.9249    3.8  58.9   -4.9  12.1937   3.0 ------	UNKNOWN
 26.7253 -21.7396    2.5  58.8   -5.9  18.1891   4.6 ------	UNKNOWN
157.6447 -33.7981    3.8  56.4 -151.2   9.6577   3.0 ------	UNKNOWN
124.4898 -62.3410    3.7  41.6 -107.8   8.8334   3.2 ------	UNKNOWN
 32.5382 -53.8173    4.0  50.6  -44.6   9.4335   2.9 ------	UNKNOWN
Plot creation:
Thu Jan  5 10:36:36 EST 2017