Estimated redshift from machine learning (Ukwatta et al. 2016) - may take a few minute to calcaulte
Image
Pre-slew 15.0-350.0 keV image (Event data)
#   RAcent    DECcent   POSerr    Theta     Phi              Peak Cts       SNR   Name
   15.2321   -17.2326   0.0239    16.0602     2.0205         0.0247262      8.088 TRIG_00732188

Foreground time interval of the image:
 -0.004   0.056 (delta_t =   0.060 [sec])
Background time interval of the image:
-239.560  -0.004 (delta_t = 239.556 [sec])
Lightcurves
Notes:
- 1) The mask-weighted light curves are using the flight position.
- 2) Multiple plots of different time binning/intervals are shown to cover all scenarios of short/long GRBs, rate/image triggers, and real/false positives.
- 3) For all the mask-weighted lightcurves, the y-axis units are counts/sec/det where a det is 0.4 x 0.4 = 0.16 sq cm.
- 4) The verticle lines correspond to following: green dotted lines are T50 interval, black dotted lines are T90 interval, blue solid line(s) is a spacecraft slew start time, and orange solid line(s) is a spacecraft slew end time.
- 5) Time of each bin is in the middle of the bin.
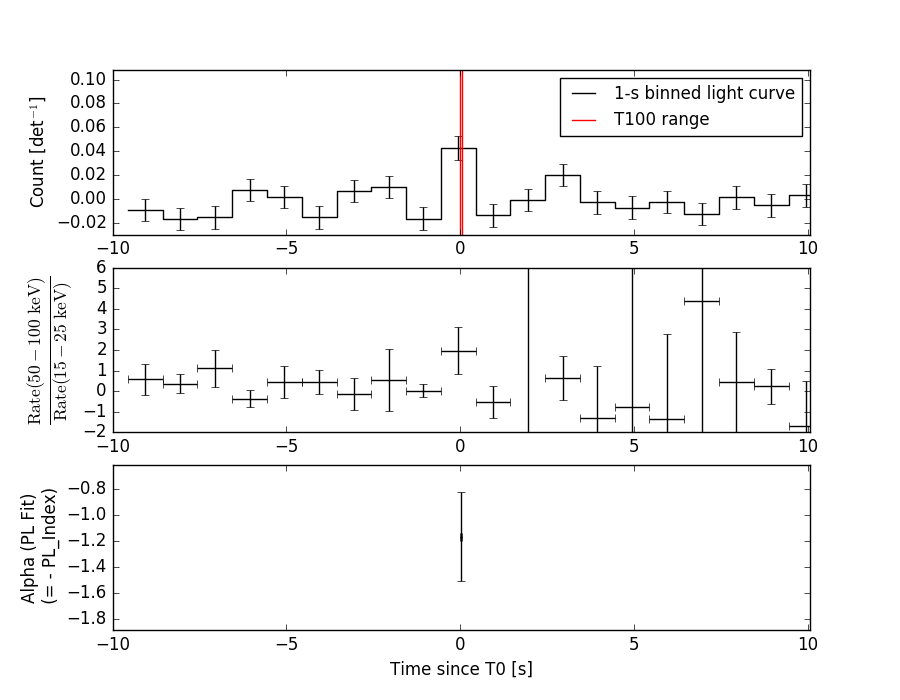
1 s binning
From T0-310 s to T0+310 s
From T100_start - 20 s to T100_end + 30 s

Full time interval

64 ms binning
Full time interval
From T100_start to T100_end

From T0-5 sec to T0+5 sec
16 ms binning
From T100_start-5 s to T100_start+5 s
Blue+Cyan dotted lines: Time interval of the scaled map
From 0.000000 to 0.064000
8 ms binning
From T100_start-3 s to T100_start+3 s

Blue+Cyan dotted lines: Time interval of the scaled map
From 0.000000 to 0.064000
2 ms binning
From T100_start-1 s to T100_start+1 s
Blue+Cyan dotted lines: Time interval of the scaled map
From 0.000000 to 0.064000
SN=5 or 10 sec. binning (whichever binning is satisfied first)
SN=5 or 10 sec. binning (T < 200 sec)
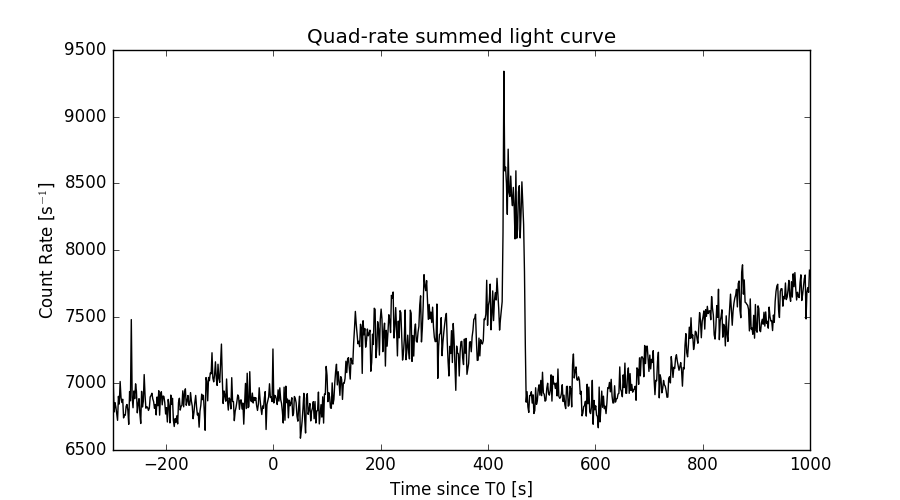
Quad-rate summed light curves (from T0-300s to T0+1000s)
Spectral Evolution
Spectra
Notes:
- 1) The fitting includes the systematic errors.
- 2) When the burst includes telescope slew time periods, the fitting uses an average response file made from multiple 5-s response files through out the slew time plus single time preiod for the non-slew times, and weighted by the total counts in the corresponding time period using addrmf. An average response file is needed becuase a spectral fit using the pre-slew DRM will introduce some errors in both a spectral shape and a normalization if the PHA file contains a lot of the slew/post-slew time interval.
- 3) For fits to more complicated models (e.g. a power-law over a cutoff power-law), the BAT team has decided to require a chi-square improvement of more than 6 for each extra dof.
Time averaged spectrum fit using the average DRM
Power-law model

Time interval is from   -0.004 sec. to    0.056 sec.

Spectral model in power-law:
------------------------------------------------------------
Parameters  : value       lower 90%   higher 90%
Photon index: 1.16862     ( -0.334413   0.348186 )
Norm@50keV  : 2.07762E-02    ( -0.00537981   0.00537643 )
------------------------------------------------------------
#Fit statistic : Chi-Squared =          78.01 using 59 PHA bins.
# Reduced chi-squared =          1.369 for     57 degrees of freedom
# Null hypothesis probability =   3.372855e-02

Photon flux (15-150 keV)    in 0.06 sec: 2.42782 ( -0.62546  0.62611 ) ph/cm2/s
Energy fluence (15-150 keV)             : 1.27865e-08 ( -3.61137e-09  3.69178e-09 ) ergs/cm2
Cutoff power-law model
Time interval is from   -0.004 sec. to    0.056 sec.
Spectral model in the cutoff power-law:
------------------------------------------------------------
Parameters  : value       lower 90%   higher 90%
Photon index: -3.47622     ( -4.24666   2.34308 )
Epeak [keV] : 65.2248      ( -10.1269 14.0539 )
Norm@50keV  : 2.64642    ( -3.08905   154.921 )
------------------------------------------------------------
#Fit statistic : Chi-Squared =          61.77 using 59 PHA bins.
# Reduced chi-squared =          1.103 for     56 degrees of freedom
# Null hypothesis probability =   2.777112e-01

Photon flux (15-150 keV)    in 0.06 sec: 2.35610 ( -0.57792  0.60221 ) ph/cm2/s
Energy fluence (15-150 keV)             : 1.22059e-08 ( -3.28065e-09  3.52924e-09 ) ergs/cm2
Band function

Time interval is from   -0.004 sec. to    0.056 sec.


Spectral model in the Band function:
------------------------------------------------------------
Parameters  : value       lower 90%   higher 90%
alpha       :    (     )
beta        :     (     )
Epeak [keV] :       (   )
Norm@50keV   :     (     )
------------------------------------------------------------

Photon flux (15-150 keV)    in  sec:  (    ) ph/cm2/s
Energy fluence (15-150 keV)             : 0 ( 0  0 ) ergs/cm2
Single BB
Spectral model blackbody:
------------------------------------------------------------
Parameters  : value    Lower 90%  Upper 90%
kT [keV]    : 18.1023  (-3.19696  3.88869)
R^2/D10^2   : 0.196485  (-0.0953652   0.171092)
(R is the radius in km and D10 is the distance to the source in units of 10 kpc)
------------------------------------------------------------
#Fit statistic : Chi-Squared =          63.70 using 59 PHA bins.
# Reduced chi-squared =          1.118 for     57 degrees of freedom
# Null hypothesis probability =   2.524925e-01

Energy  Fluence     90% Error
[keV]   [erg/cm2]   [erg/cm2]
15- 25  7.721e-10   3.262e-10
25- 50  3.586e-09   1.230e-09
50-150  8.542e-09   3.946e-09
15-150  1.290e-08   4.811e-09
Thermal bremsstrahlung (OTTB)

Spectral model: thermal bremsstrahlung
------------------------------------------------------------
Parameters  : value         Lower 90%    Upper 90%
kT [keV]    : 200.000       (-84.7187      -200)
Norm        : 9.75516       (-2.54724     2.54724)
------------------------------------------------------------
#Fit statistic : Chi-Squared =          79.13 using 59 PHA bins.
# Reduced chi-squared =          1.388 for     57 degrees of freedom
# Null hypothesis probability =   2.788729e-02

Energy  Fluence     90% Error
[keV]   [erg/cm2]   [erg/cm2]
15- 25  1.457e-09   8.799e-10
25- 50  2.803e-09   1.718e-09
50-150  6.148e-09   3.720e-09
15-150  1.041e-08   6.453e-09
Double BB

# Reduced chi-squared =          1.147 for     55 degrees of freedom
# Reduced chi-squared =          1.143 for     55 degrees of freedom
# Reduced chi-squared =          1.141 for     55 degrees of freedom
# Reduced chi-squared =          1.140 for     55 degrees of freedom
# Reduced chi-squared =          1.139 for     55 degrees of freedom
# Reduced chi-squared =          1.139 for     55 degrees of freedom
# Null hypothesis probability =   1.969646e-01
# Null hypothesis probability =   2.126511e-01
# Null hypothesis probability =   2.174643e-01
# Null hypothesis probability =   2.204470e-01
# Null hypothesis probability =   2.220467e-01
# Null hypothesis probability =   2.228321e-01
# Null hypothesis probability =   2.232273e-01

Energy  Fluence     90% Error
[keV]   [erg/cm2]   [erg/cm2]
15- 25  0.000e+00   0.000e+00
25- 50  0.000e+00   0.000e+00
50-150  0.000e+00   0.000e+00
15-150  0.000e+00   0.000e+00
Peak spectrum fit
Power-law model
Time interval is from   -0.472 sec. to    0.528 sec.

Spectral model in power-law:
------------------------------------------------------------
Parameters  : value       lower 90%   higher 90%
Photon index: 1.30708     ( -0.539646   0.555298 )
Norm@50keV  : 2.90305E-03    ( -0.00101808   0.00101055 )
------------------------------------------------------------
#Fit statistic : Chi-Squared =          45.34 using 59 PHA bins.
# Reduced chi-squared =         0.7954 for     57 degrees of freedom
# Null hypothesis probability =   8.672664e-01

Photon flux (15-150 keV)    in 1 sec: 0.346834 ( -0.119679  0.120069 ) ph/cm2/s
Energy fluence (15-150 keV)             : 2.86273e-08 ( -1.09017e-08  1.13663e-08 ) ergs/cm2
Cutoff power-law model

Time interval is from   -0.472 sec. to    0.528 sec.
Spectral model in the cutoff power-law:
------------------------------------------------------------
Parameters  : value       lower 90%   higher 90%
Photon index: -0.803126     ( -5.94117   2.27179 )
Epeak [keV] : 73.0531      ( -22.3328 -72.9123 )
Norm@50keV  : 2.70193E-02    ( -0.0283308   2.52262 )
------------------------------------------------------------
#Fit statistic : Chi-Squared =          42.76 using 59 PHA bins.
# Reduced chi-squared =         0.7635 for     56 degrees of freedom
# Null hypothesis probability =   9.035627e-01

Photon flux (15-150 keV)    in 1 sec: 0.322345 ( -0.12216  0.123252 ) ph/cm2/s
Energy fluence (15-150 keV)             : 2.65797e-08 ( -1.00494e-08  1.13108e-08 ) ergs/cm2
Band function

Time interval is from   -0.472 sec. to    0.528 sec.


Spectral model in the Band function:
------------------------------------------------------------
Parameters  : value       lower 90%   higher 90%
alpha       :    (     )
beta        :     (     )
Epeak [keV] :       (   )
Norm@50keV   :     (     )
------------------------------------------------------------

Photon flux (15-150 keV)    in  sec:  (    ) ph/cm2/s
Energy fluence (15-150 keV)             : 0 ( 0  0 ) ergs/cm2
Single BB
Spectral model blackbody:
------------------------------------------------------------
Parameters  : value    Lower 90%  Upper 90%
kT [keV]    : 18.1506  (-5.31105  7.50214)
R^2/D10^2   : 2.36378E-02  (-0.0236347   0.0501041)
(R is the radius in km and D10 is the distance to the source in units of 10 kpc)
------------------------------------------------------------
#Fit statistic : Chi-Squared =          42.72 using 59 PHA bins.
# Reduced chi-squared =         0.7494 for     57 degrees of freedom
# Null hypothesis probability =   9.200280e-01

Energy  Fluence     90% Error
[keV]   [erg/cm2]   [erg/cm2]
15- 25  1.555e-09   1.014e-09
25- 50  7.236e-09   4.320e-09
50-150  1.734e-08   1.213e-08
15-150  2.613e-08   1.680e-08
Thermal bremsstrahlung (OTTB)
Spectral model: thermal bremsstrahlung
------------------------------------------------------------
Parameters  : value         Lower 90%    Upper 90%
kT [keV]    : 199.361       (-199.362      -199.362)
Norm        : 1.43304       (-0.490936     0.491491)
------------------------------------------------------------
#Fit statistic : Chi-Squared =          45.19 using 59 PHA bins.
# Reduced chi-squared =         0.7928 for     57 degrees of freedom
# Null hypothesis probability =   8.706390e-01

Energy  Fluence     90% Error
[keV]   [erg/cm2]   [erg/cm2]
15- 25  3.568e-09   2.313e-09
25- 50  6.864e-09   4.380e-09
50-150  1.506e-08   9.345e-09
15-150  2.549e-08   1.582e-08
Double BB

Spectral model: bbodyrad<1> + bbodyrad<2>
------------------------------------------------------------
Parameters  : value         Lower 90%    Upper 90%
kT1 [keV]   : 5.41738        (-5.39299      -5.39299)
R1^2/D10^2  : 0.357367        (-0.379728      -0.379728)
kT2 [keV]   : 19.8098        (-19.8423      -19.8423)
R2^2/D10^2  : 1.63626E-02    (-0.0162683   0.0489949)
------------------------------------------------------------
#Fit statistic : Chi-Squared =          42.20 using 59 PHA bins.
# Reduced chi-squared =         0.7673 for     55 degrees of freedom
# Null hypothesis probability =   8.970771e-01

Energy  Fluence     90% Error
[keV]   [erg/cm2]   [erg/cm2]
15- 25  2.428e-09   1.615e-09
25- 50  7.088e-09   4.261e-09
50-150  1.792e-08   1.135e-08
15-150  2.744e-08   1.606e-08
Pre-slew spectrum (Pre-slew PHA with pre-slew DRM)
Power-law model

Spectral model in power-law:
------------------------------------------------------------
Parameters  : value       lower 90%   higher 90%
Photon index: 1.16862     ( -0.334413   0.348186 )
Norm@50keV  : 2.07762E-02    ( -0.00537981   0.00537643 )
------------------------------------------------------------
#Fit statistic : Chi-Squared =          78.01 using 59 PHA bins.
# Reduced chi-squared =          1.369 for     57 degrees of freedom
# Null hypothesis probability =   3.372855e-02

Photon flux (15-150 keV)    in 0.06 sec: 2.42795 ( -0.62533  0.626212 ) ph/cm2/s
Energy fluence (15-150 keV)             : 1.27898e-08 ( -3.60937e-09  3.69004e-09 ) ergs/cm2
Cutoff power-law model

Spectral model in the cutoff power-law:
------------------------------------------------------------
Parameters  : value       lower 90%   higher 90%
Photon index: -3.47879     ( -4.13373   2.45596 )
Epeak [keV] : 65.2197      ( -10.2081 12.5938 )
Norm@50keV  : 2.65308    ( -3.0993   156.108 )
------------------------------------------------------------
#Fit statistic : Chi-Squared =          61.77 using 59 PHA bins.
# Reduced chi-squared =          1.103 for     56 degrees of freedom
# Null hypothesis probability =   2.777194e-01

Photon flux (15-150 keV)    in 0.06 sec: 2.35578 ( -0.57774  0.60245 ) ph/cm2/s
Energy fluence (15-150 keV)             : 1.2212e-08 ( -3.28512e-09  3.53142e-09 ) ergs/cm2
Band function
Spectral model in the Band function:
------------------------------------------------------------
Parameters  : value       lower 90%   higher 90%
alpha       :    (     )
beta        :     (     )
Epeak [keV] :       (   )
Norm@50keV   :     (     )
------------------------------------------------------------

Photon flux (15-150 keV)    in  sec:  (    ) ph/cm2/s
Energy fluence (15-150 keV)             : 0 ( 0  0 ) ergs/cm2
S(25-50 keV) vs. S(50-100 keV) plot
S(25-50 keV)  = 2.63e-09
S(50-100 keV) = 4.69e-09
T90 vs. Hardness ratio plot
T90                                   = 0.0559999346733093 sec.
Hardness ratio (energy fluence ratio) = 1.78327
Color vs. Color plot
Count Ratio  (25-50 keV) / (15-25 keV) = 7.67865
Count Ratio (50-100 keV) / (15-25 keV) = 7.62904
Mask shadow pattern

IMX = 2.877037957125862E-01, IMY = -1.014993723661688E-02
TIME vs. PHA plot around the trigger time

Blue+Cyan dotted lines: Time interval of the scaled map
From 0.000000 to 0.064000
TIME vs. DetID plot around the trigger time

Blue+Cyan dotted lines: Time interval of the scaled map
From 0.000000 to 0.064000
100 us light curve (15-350 keV)
Blue+Cyan dotted lines: Time interval of the scaled map
From 0.000000 to 0.064000
Spacecraft aspect plot
Bright source in the pre-burst/pre-slew/post-slew images
Pre-burst image of 15-350 keV band
Time interval of the image:
-239.560000 -0.004000

# RAcent  DECcent POSerr Theta    Phi  PeakCts   SNR AngSep     Name
#  [deg]    [deg]    ['] [deg]  [deg]                   [']
 54.7969 -35.0818    2.6  28.3  126.1   1.1839   4.5 ------	UNKNOWN
 25.6239 -10.8556    2.6  22.1   34.2   0.9002   4.5 ------	UNKNOWN
 24.7525 -19.2891    3.1  13.7   37.6   0.6490   3.7 ------	UNKNOWN
348.1739  -6.3784    3.4  40.0  -35.0   1.0283   3.4 ------	UNKNOWN
346.8138  -0.8920    5.7  44.9  -30.9   0.6852   2.0 ------	UNKNOWN
324.4027 -58.6525    2.3  45.4 -121.2   4.3462   5.0 ------	UNKNOWN
Pre-slew background subtracted image of 15-350 keV band
Time interval of the image:
-0.004000 0.056000

# RAcent  DECcent POSerr Theta    Phi  PeakCts   SNR AngSep     Name
#  [deg]    [deg]    ['] [deg]  [deg]                   [']
 15.2321 -17.2327    1.4  16.1    2.0   0.0247   8.1 ------	UNKNOWN
 33.2299 -77.9059    2.2  45.7 -162.3   0.0317   5.1 ------	UNKNOWN
359.7248 -71.1358    2.1  40.3 -148.3   0.0290   5.5 ------	UNKNOWN
Post-slew image of 15-350 keV band
Time interval of the image:
46.540590 962.538200

# RAcent  DECcent POSerr Theta    Phi  PeakCts   SNR AngSep     Name
#  [deg]    [deg]    ['] [deg]  [deg]                   [']
 55.8480  -9.3095    3.3  40.2  102.9   8.0163   3.5 ------	UNKNOWN
 19.6315  -4.1286    2.9  13.7   37.6   1.9784   4.0 ------	UNKNOWN
 29.5462 -39.2060    3.8  25.3  172.2   1.7686   3.0 ------	UNKNOWN
 12.8131 -48.8574    3.5  31.7 -158.2   2.0553   3.4 ------	UNKNOWN
351.6979 -57.1899    3.7  43.7 -142.9   3.6406   3.1 ------	UNKNOWN
Plot creation:
Fri Feb 10 17:55:21 EST 2017