Special notes of this burst
Image
Pre-slew 15.0-350.0 keV image (Event data)

#   RAcent    DECcent   POSerr    Theta     Phi              Peak Cts       SNR   Name
   61.7491   -71.9361   0.0094    14.5526   109.1566         0.8368551     20.445 TRIG_00732526

Foreground time interval of the image:
 -0.608  12.365 (delta_t =  12.973 [sec])
Background time interval of the image:
-617.735 -598.699 (delta_t =  19.036 [sec])
-239.936  -0.608 (delta_t = 239.328 [sec])
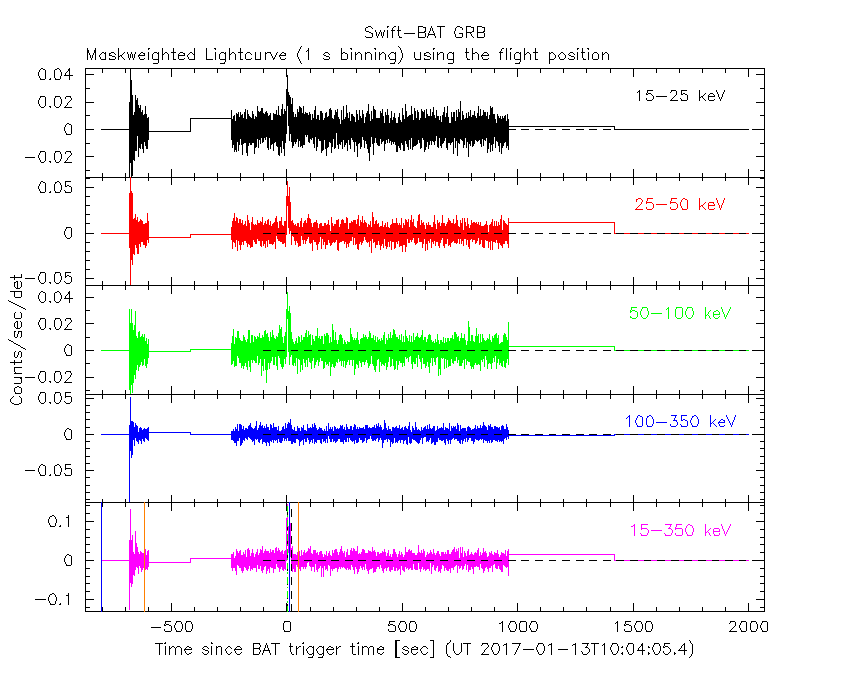
Lightcurves
Notes:
- 1) The mask-weighted light curves are using the flight position.
- 2) Multiple plots of different time binning/intervals are shown to cover all scenarios of short/long GRBs, rate/image triggers, and real/false positives.
- 3) For all the mask-weighted lightcurves, the y-axis units are counts/sec/det where a det is 0.4 x 0.4 = 0.16 sq cm.
- 4) The verticle lines correspond to following: green dotted lines are T50 interval, black dotted lines are T90 interval, blue solid line(s) is a spacecraft slew start time, and orange solid line(s) is a spacecraft slew end time.
- 5) Time of each bin is in the middle of the bin.
1 s binning
From T0-310 s to T0+310 s

From T100_start - 20 s to T100_end + 30 s

Full time interval
64 ms binning
Full time interval

From T100_start to T100_end

From T0-5 sec to T0+5 sec

16 ms binning
From T100_start-5 s to T100_start+5 s

Blue+Cyan dotted lines: Time interval of the scaled map
From 0.000000 to 1.024000
8 ms binning
From T100_start-3 s to T100_start+3 s

Blue+Cyan dotted lines: Time interval of the scaled map
From 0.000000 to 1.024000
2 ms binning
From T100_start-1 s to T100_start+1 s

Blue+Cyan dotted lines: Time interval of the scaled map
From 0.000000 to 1.024000
SN=5 or 10 sec. binning (whichever binning is satisfied first)

SN=5 or 10 sec. binning (T < 200 sec)

Quad-rate summed light curves (from T0-300s to T0+1000s)

Spectral Evolution

Spectra
Notes:
- 1) The fitting includes the systematic errors.
- 2) When the burst includes telescope slew time periods, the fitting uses an average response file made from multiple 5-s response files through out the slew time plus single time preiod for the non-slew times, and weighted by the total counts in the corresponding time period using addrmf. An average response file is needed becuase a spectral fit using the pre-slew DRM will introduce some errors in both a spectral shape and a normalization if the PHA file contains a lot of the slew/post-slew time interval.
- 3) For fits to more complicated models (e.g. a power-law over a cutoff power-law), the BAT team has decided to require a chi-square improvement of more than 6 for each extra dof.
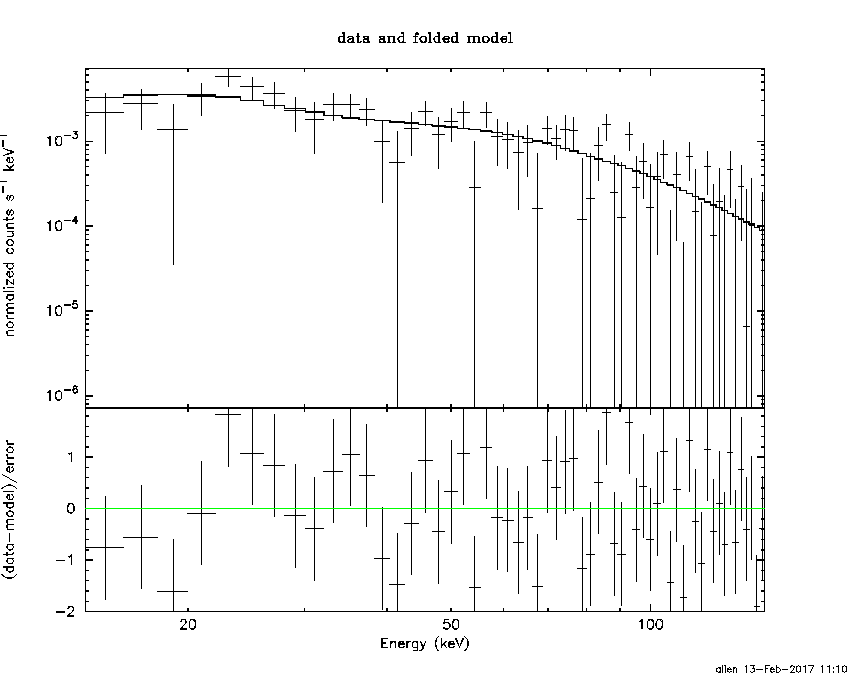
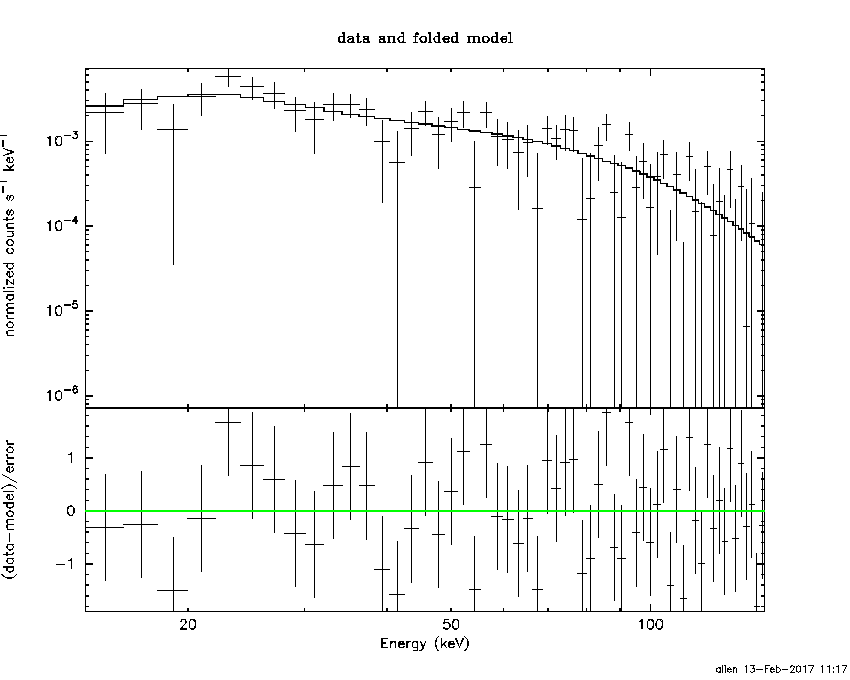
Time averaged spectrum fit using the average DRM
Power-law model

Time interval is from   -0.608 sec. to   22.932 sec.

Spectral model in power-law:
------------------------------------------------------------
Parameters  : value       lower 90%   higher 90%
Photon index: 1.57293     ( -0.123133   0.124996 )
Norm@50keV  : 3.24103E-03    ( -0.000240956   0.000239348 )
------------------------------------------------------------
#Fit statistic : Chi-Squared =          75.75 using 59 PHA bins.
# Reduced chi-squared =          1.329 for     57 degrees of freedom
# Null hypothesis probability =   4.898541e-02

Photon flux (15-150 keV)    in 23.54 sec: 0.413084 ( -0.029125  0.029148 ) ph/cm2/s
Energy fluence (15-150 keV)             : 7.16073e-07 ( -5.77688e-08  5.84364e-08 ) ergs/cm2
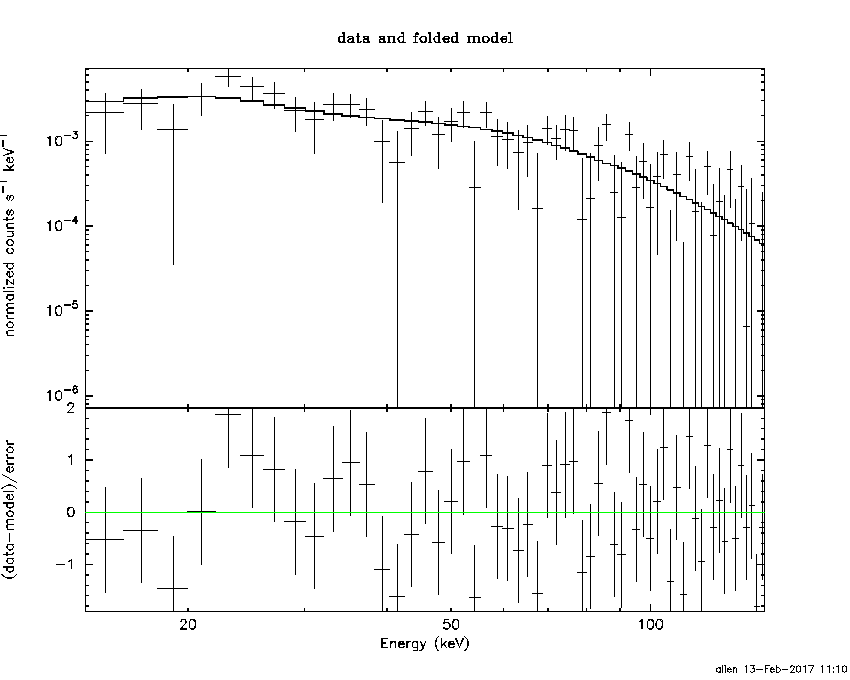
Cutoff power-law model
Time interval is from   -0.608 sec. to   22.932 sec.
Spectral model in the cutoff power-law:
------------------------------------------------------------
Parameters  : value       lower 90%   higher 90%
Photon index: 0.740936     ( -0.632466   0.549575 )
Epeak [keV] : 71.8058      ( -13.8714 48.3201 )
Norm@50keV  : 8.81318E-03    ( -0.00419825   0.00985906 )
------------------------------------------------------------
#Fit statistic : Chi-Squared =          68.66 using 59 PHA bins.
# Reduced chi-squared =          1.226 for     56 degrees of freedom
# Null hypothesis probability =   1.193269e-01

Photon flux (15-150 keV)    in 23.54 sec: 0.396412 ( -0.031022  0.031012 ) ph/cm2/s
Energy fluence (15-150 keV)             : 6.63463e-07 ( -6.57588e-08  6.71483e-08 ) ergs/cm2
Band function

Time interval is from   -0.608 sec. to   22.932 sec.


Spectral model in the Band function:
------------------------------------------------------------
Parameters  : value       lower 90%   higher 90%
alpha       :    (     )
beta        :     (     )
Epeak [keV] :       (   )
Norm@50keV   :     (     )
------------------------------------------------------------

Photon flux (15-150 keV)    in  sec:  (    ) ph/cm2/s
Energy fluence (15-150 keV)             : 0 ( 0  0 ) ergs/cm2
Single BB

Spectral model blackbody:
------------------------------------------------------------
Parameters  : value    Lower 90%  Upper 90%
kT [keV]    : 13.6012  (-1.09242  1.20774)
R^2/D10^2   : 6.57336E-02  (-0.0172672   0.0230105)
(R is the radius in km and D10 is the distance to the source in units of 10 kpc)
------------------------------------------------------------
#Fit statistic : Chi-Squared =          92.73 using 59 PHA bins.
# Reduced chi-squared =          1.627 for     57 degrees of freedom
# Null hypothesis probability =   1.945437e-03

Energy  Fluence     90% Error
[keV]   [erg/cm2]   [erg/cm2]
15- 25  6.061e-08   7.839e-09
25- 50  2.189e-07   1.709e-08
50-150  2.626e-07   4.095e-08
15-150  5.421e-07   4.590e-08
Thermal bremsstrahlung (OTTB)
Spectral model: thermal bremsstrahlung
------------------------------------------------------------
Parameters  : value         Lower 90%    Upper 90%
kT [keV]    : 172.689       (-51.59      -172.656)
Norm        : 1.69589       (-0.125737     0.138594)
------------------------------------------------------------
#Fit statistic : Chi-Squared =          71.11 using 59 PHA bins.
# Reduced chi-squared =          1.248 for     57 degrees of freedom
# Null hypothesis probability =   9.902259e-02

Energy  Fluence     90% Error
[keV]   [erg/cm2]   [erg/cm2]
15- 25  1.011e-07   1.254e-08
25- 50  1.911e-07   4.826e-08
50-150  3.987e-07   1.842e-07
15-150  6.909e-07   2.307e-07
Double BB
Spectral model: bbodyrad<1> + bbodyrad<2>
------------------------------------------------------------
Parameters  : value         Lower 90%    Upper 90%
kT1 [keV]   : 7.05138        (-2.55262      2.79397)
R1^2/D10^2  : 0.359575        (-0.214072      1.25292)
kT2 [keV]   : 20.9700        (-4.66225      13.5869)
R2^2/D10^2  : 1.05705E-02    (-0.00904124   0.0195686)
------------------------------------------------------------
#Fit statistic : Chi-Squared =          69.94 using 59 PHA bins.
# Reduced chi-squared =          1.272 for     55 degrees of freedom
# Null hypothesis probability =   8.460934e-02

Energy  Fluence     90% Error
[keV]   [erg/cm2]   [erg/cm2]
15- 25  8.881e-08   3.576e-08
25- 50  2.009e-07   8.051e-08
50-150  3.642e-07   1.798e-07
15-150  6.539e-07   2.185e-07
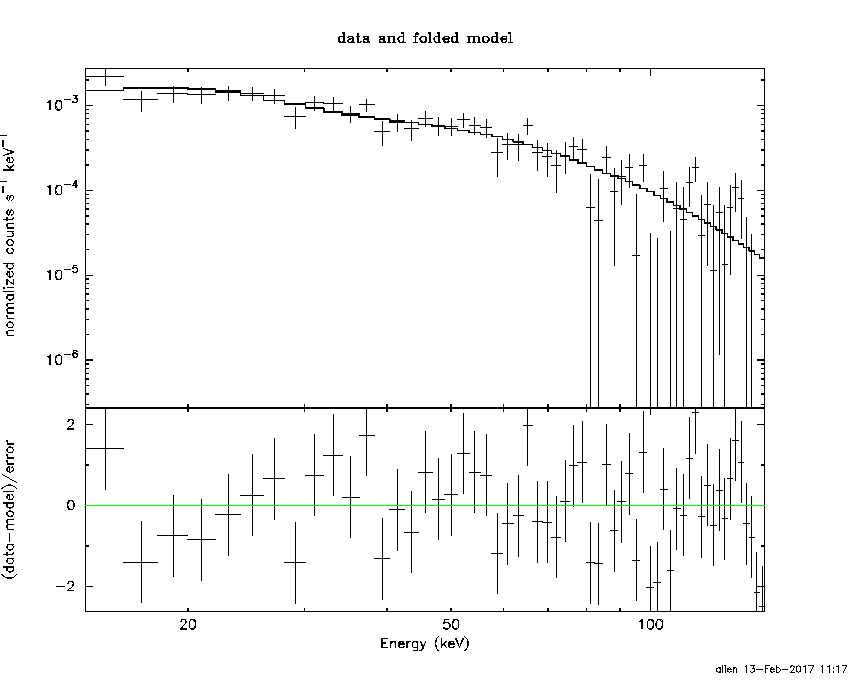
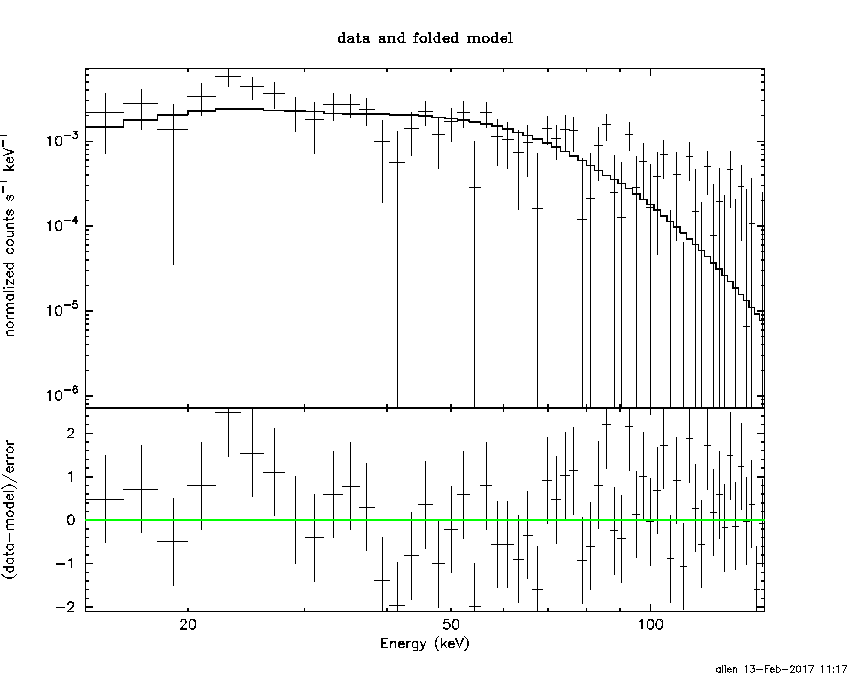
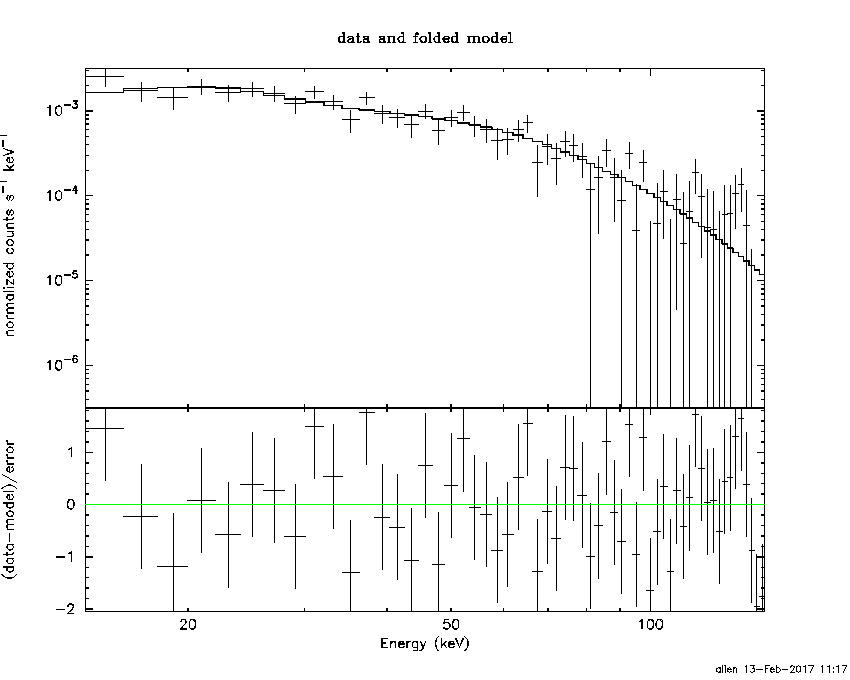
Peak spectrum fit
Power-law model
Time interval is from    1.632 sec. to    2.632 sec.

Spectral model in power-law:
------------------------------------------------------------
Parameters  : value       lower 90%   higher 90%
Photon index: 1.27602     ( -0.224978   0.223172 )
Norm@50keV  : 9.03707E-03    ( -0.00119414   0.0011913 )
------------------------------------------------------------
#Fit statistic : Chi-Squared =          53.96 using 59 PHA bins.
# Reduced chi-squared =         0.9467 for     57 degrees of freedom
# Null hypothesis probability =   5.897724e-01

Photon flux (15-150 keV)    in 1 sec: 1.07354 ( -0.142008  0.14214 ) ph/cm2/s
Energy fluence (15-150 keV)             : 8.98463e-08 ( -1.33994e-08  1.35869e-08 ) ergs/cm2
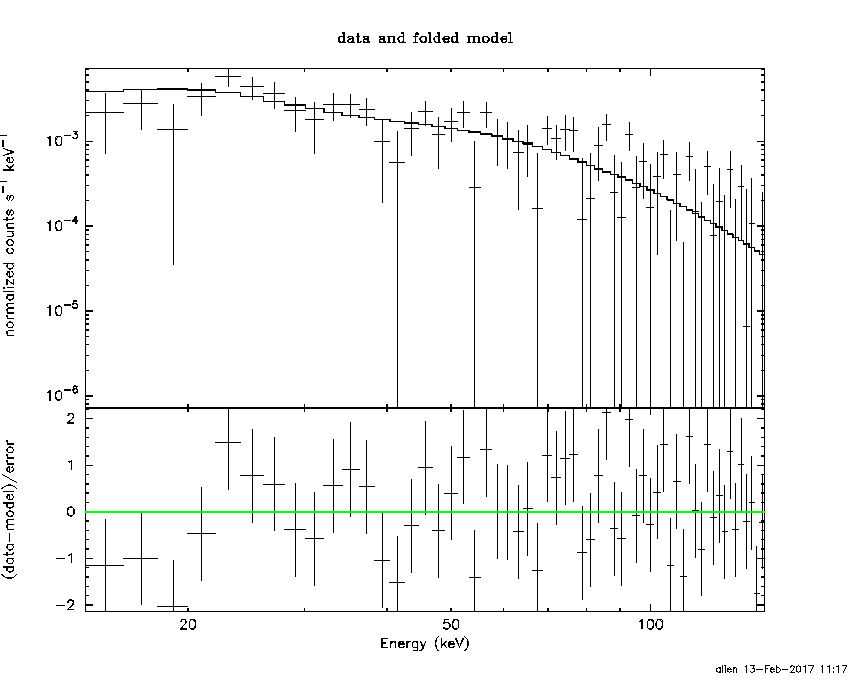
Cutoff power-law model
Time interval is from    1.632 sec. to    2.632 sec.
Spectral model in the cutoff power-law:
------------------------------------------------------------
Parameters  : value       lower 90%   higher 90%
Photon index: 0.877058     ( -0.944472   0.516212 )
Epeak [keV] : 141.697      ( -141.696 -141.696 )
Norm@50keV  : 1.43887E-02    ( -0.00634139   0.0277014 )
------------------------------------------------------------
#Fit statistic : Chi-Squared =          53.23 using 59 PHA bins.
# Reduced chi-squared =         0.9506 for     56 degrees of freedom
# Null hypothesis probability =   5.803140e-01

Photon flux (15-150 keV)    in 1 sec: 1.05740 ( -0.145906  0.1457 ) ph/cm2/s
Energy fluence (15-150 keV)             : 8.69441e-08 ( -1.48749e-08  1.47533e-08 ) ergs/cm2
Band function

Time interval is from    1.632 sec. to    2.632 sec.


Spectral model in the Band function:
------------------------------------------------------------
Parameters  : value       lower 90%   higher 90%
alpha       :    (     )
beta        :     (     )
Epeak [keV] :       (   )
Norm@50keV   :     (     )
------------------------------------------------------------

Photon flux (15-150 keV)    in  sec:  (    ) ph/cm2/s
Energy fluence (15-150 keV)             : 0 ( 0  0 ) ergs/cm2
Single BB
Spectral model blackbody:
------------------------------------------------------------
Parameters  : value    Lower 90%  Upper 90%
kT [keV]    : 16.5036  (-2.89448  3.69814)
R^2/D10^2   : 9.11705E-02  (-0.0446119   0.0840391)
(R is the radius in km and D10 is the distance to the source in units of 10 kpc)
------------------------------------------------------------
#Fit statistic : Chi-Squared =          65.21 using 59 PHA bins.
# Reduced chi-squared =          1.144 for     57 degrees of freedom
# Null hypothesis probability =   2.129216e-01

Energy  Fluence     90% Error
[keV]   [erg/cm2]   [erg/cm2]
15- 25  5.097e-09   1.336e-09
25- 50  2.201e-08   4.965e-09
50-150  4.239e-08   1.134e-08
15-150  6.950e-08   1.428e-08
Thermal bremsstrahlung (OTTB)
Spectral model: thermal bremsstrahlung
------------------------------------------------------------
Parameters  : value         Lower 90%    Upper 90%
kT [keV]    : 200.000       (-51.1516      -200)
Norm        : 4.40315       (-0.581472     0.581472)
------------------------------------------------------------
#Fit statistic : Chi-Squared =          57.07 using 59 PHA bins.
# Reduced chi-squared =          1.001 for     57 degrees of freedom
# Null hypothesis probability =   4.722970e-01

Energy  Fluence     90% Error
[keV]   [erg/cm2]   [erg/cm2]
15- 25  1.097e-08   6.230e-09
25- 50  2.110e-08   1.159e-08
50-150  4.627e-08   2.577e-08
15-150  7.833e-08   4.329e-08
Double BB
Spectral model: bbodyrad<1> + bbodyrad<2>
------------------------------------------------------------
Parameters  : value         Lower 90%    Upper 90%
kT1 [keV]   : 7.88500        (-2.37267      3.25995)
R1^2/D10^2  : 0.693845        (-0.457058      1.53783)
kT2 [keV]   : 31.4027        (-9.93001      38.0287)
R2^2/D10^2  : 8.63758E-03    (-0.00774835   0.0233414)
------------------------------------------------------------
#Fit statistic : Chi-Squared =          51.16 using 59 PHA bins.
# Reduced chi-squared =         0.9301 for     55 degrees of freedom
# Null hypothesis probability =   6.222677e-01

Energy  Fluence     90% Error
[keV]   [erg/cm2]   [erg/cm2]
15- 25  9.011e-09   5.087e-09
25- 50  2.130e-08   1.116e-08
50-150  5.889e-08   3.341e-08
15-150  8.921e-08   4.644e-08
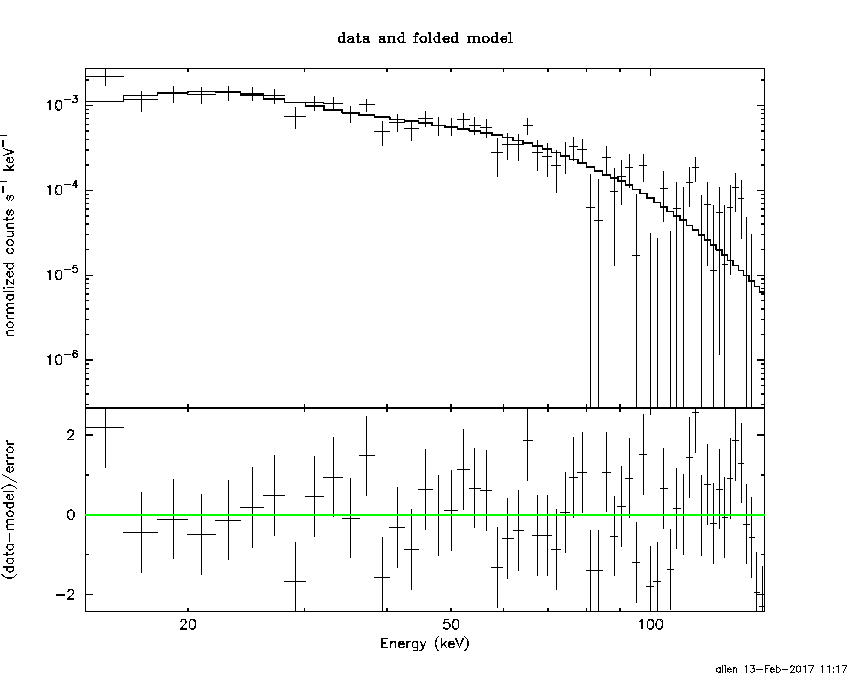
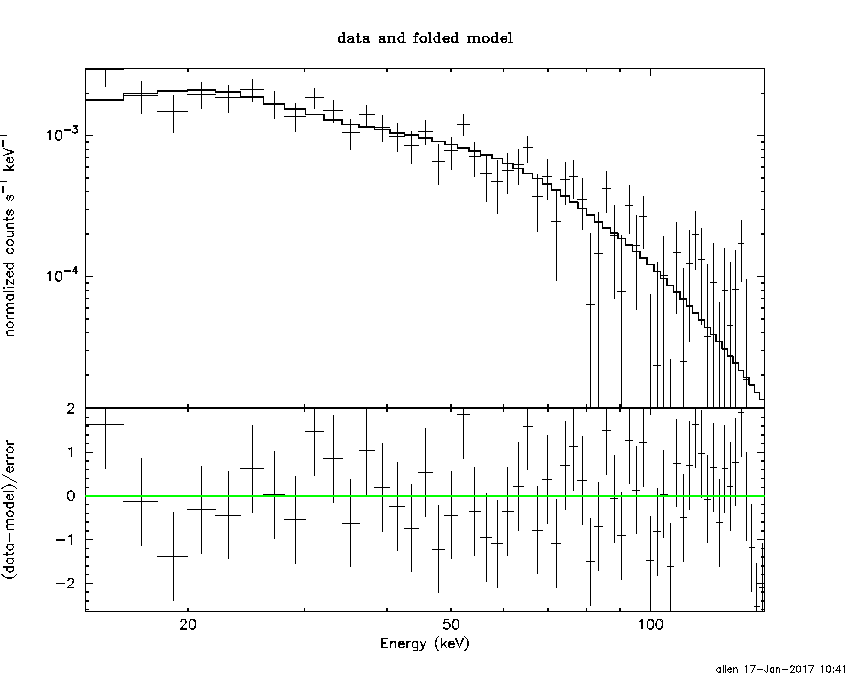
Pre-slew spectrum (Pre-slew PHA with pre-slew DRM)
Power-law model

Spectral model in power-law:
------------------------------------------------------------
Parameters  : value       lower 90%   higher 90%
Photon index: 1.55869     ( -0.125649   0.127653 )
Norm@50keV  : 4.29249E-03    ( -0.000330244   0.000328019 )
------------------------------------------------------------
#Fit statistic : Chi-Squared =          61.85 using 59 PHA bins.
# Reduced chi-squared =          1.085 for     57 degrees of freedom
# Null hypothesis probability =   3.072618e-01

Photon flux (15-150 keV)    in 12.97 sec: 0.544783 ( -0.0396897  0.0397112 ) ph/cm2/s
Energy fluence (15-150 keV)             : 5.2348e-07 ( -4.38649e-08  4.43381e-08 ) ergs/cm2
Cutoff power-law model
Spectral model in the cutoff power-law:
------------------------------------------------------------
Parameters  : value       lower 90%   higher 90%
Photon index: 0.615778     ( -0.663901   0.573666 )
Epeak [keV] : 69.4436      ( -12.5268 36.5052 )
Norm@50keV  : 1.33800E-02    ( -0.00658688   0.0161594 )
------------------------------------------------------------
#Fit statistic : Chi-Squared =          53.33 using 59 PHA bins.
# Reduced chi-squared =         0.9523 for     56 degrees of freedom
# Null hypothesis probability =   5.766852e-01

Photon flux (15-150 keV)    in 12.97 sec: 0.521057 ( -0.042023  0.042035 ) ph/cm2/s
Energy fluence (15-150 keV)             : 4.81039e-07 ( -4.94624e-08  5.06634e-08 ) ergs/cm2
Band function
Spectral model in the Band function:
------------------------------------------------------------
Parameters  : value       lower 90%   higher 90%
alpha       :    (     )
beta        :     (     )
Epeak [keV] :       (   )
Norm@50keV   :     (     )
------------------------------------------------------------

Photon flux (15-150 keV)    in  sec:  (    ) ph/cm2/s
Energy fluence (15-150 keV)             : 0 ( 0  0 ) ergs/cm2
S(25-50 keV) vs. S(50-100 keV) plot

S(25-50 keV)  = 1.83e-07
S(50-100 keV) = 2.47e-07
T90 vs. Hardness ratio plot

T90                                   = 20.2959999442101 sec.
Hardness ratio (energy fluence ratio) = 1.34973
Color vs. Color plot

Count Ratio  (25-50 keV) / (15-25 keV) = 1.44165
Count Ratio (50-100 keV) / (15-25 keV) = 0.985551
Mask shadow pattern
IMX = -8.518722869117754E-02, IMY = -2.452227769607561E-01
TIME vs. PHA plot around the trigger time
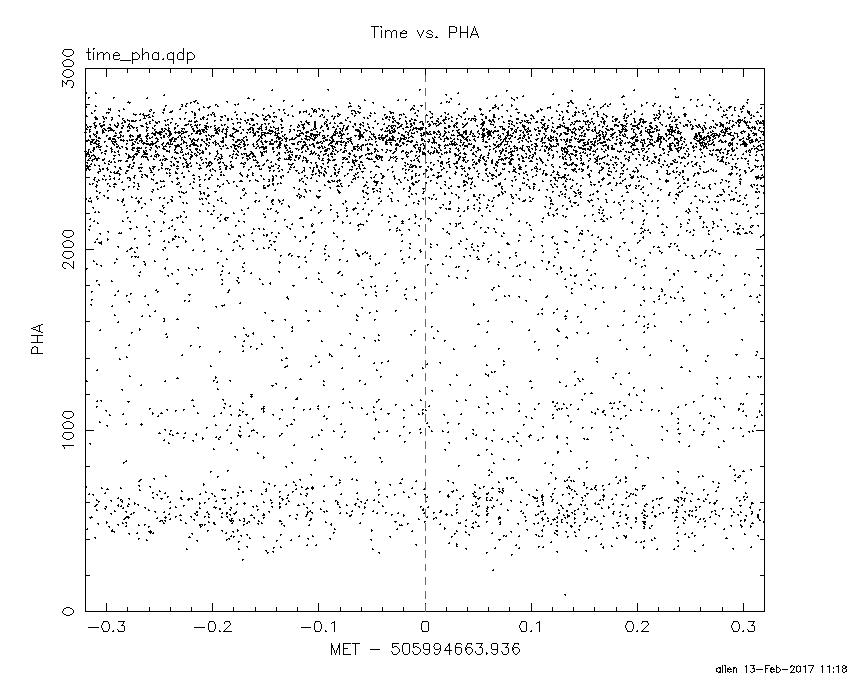
Blue+Cyan dotted lines: Time interval of the scaled map
From 0.000000 to 1.024000
TIME vs. DetID plot around the trigger time

Blue+Cyan dotted lines: Time interval of the scaled map
From 0.000000 to 1.024000
100 us light curve (15-350 keV)

Blue+Cyan dotted lines: Time interval of the scaled map
From 0.000000 to 1.024000
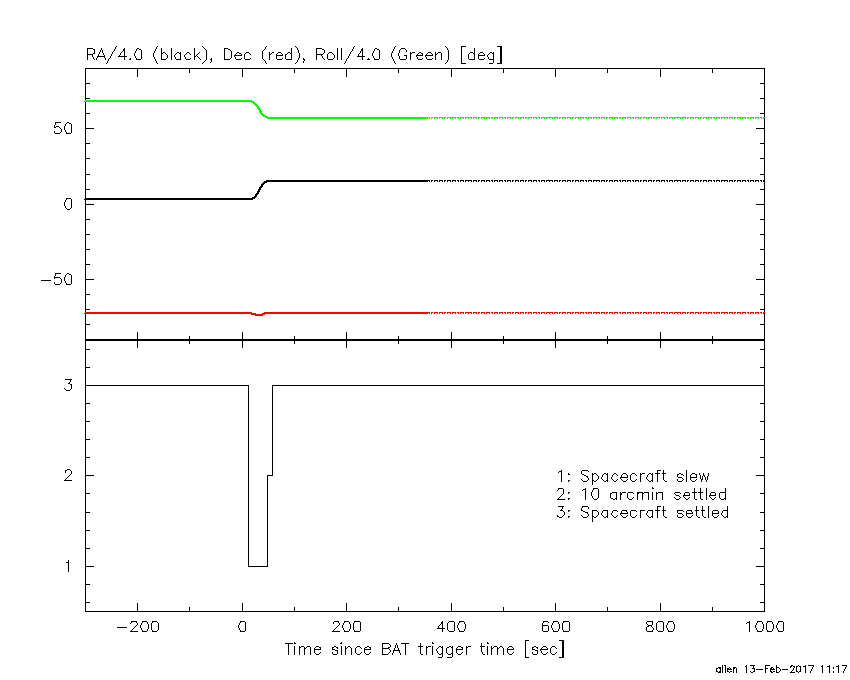
Spacecraft aspect plot
Bright source in the pre-burst/pre-slew/post-slew images
Pre-burst image of 15-350 keV band
Time interval of the image:
-617.735390 -598.698900
-239.936000 -0.608000

# RAcent  DECcent POSerr Theta    Phi  PeakCts   SNR AngSep     Name
#  [deg]    [deg]    ['] [deg]  [deg]                   [']
170.4875 -60.5651    2.7  46.2  162.2   2.2830   4.2    6.1	Cen X-3
186.6418 -62.7809   87.2  44.8  173.2   0.0576   0.1    0.8	GX 301-2
106.3770 -53.1876    2.3  41.2  112.1   4.3684   4.9 ------	UNKNOWN
 69.8743 -41.9374    3.5  40.5   70.8   2.8973   3.3 ------	UNKNOWN
 33.1253 -19.4156    3.8  54.2   21.0   3.2990   3.0 ------	UNKNOWN
 26.6529 -20.4134    2.5  52.5   13.5   3.4420   4.7 ------	UNKNOWN
302.7793 -51.1457    3.0  36.2  -95.9   1.9725   3.8 ------	UNKNOWN
263.0323 -50.4592    2.9  48.0 -129.0   3.9720   4.0 ------	UNKNOWN
Pre-slew background subtracted image of 15-350 keV band
Time interval of the image:
-0.608000 12.364610

# RAcent  DECcent POSerr Theta    Phi  PeakCts   SNR AngSep     Name
#  [deg]    [deg]    ['] [deg]  [deg]                   [']
170.6974 -60.5401    0.0  46.2  162.4  -0.0623  -0.6   12.3	Cen X-3
186.7757 -62.8715    8.6  44.7  173.3   0.1068   1.3    6.9	GX 301-2
 61.7491 -71.9361    0.6  14.6  109.2   0.8368  20.4 ------	UNKNOWN
177.9912 -74.3639    2.4  33.0  170.0   0.2443   4.8 ------	UNKNOWN
215.5980 -54.0722    2.1  52.6 -166.2   0.6782   5.6 ------	UNKNOWN
220.8575 -54.0661    2.5  52.1 -162.3   0.5558   4.7 ------	UNKNOWN
Post-slew image of 15-350 keV band
Time interval of the image:
48.164600 104.243500
105.064000 962.134000
1878.064000 2000.000000

# RAcent  DECcent POSerr Theta    Phi  PeakCts   SNR AngSep     Name
#  [deg]    [deg]    ['] [deg]  [deg]                   [']
170.3550 -60.6595    2.3  38.8  172.7   4.8188   5.0    2.5	Cen X-3
186.7360 -62.9416   11.1  40.1 -174.8   0.9010   1.0   10.5	GX 301-2
 60.3657 -58.2029    3.8  13.7   37.8   1.7103   3.1 ------	UNKNOWN
201.7047 -46.9527    2.6  57.8 -170.6  17.9299   4.4 ------	UNKNOWN
269.3655 -61.3432    3.6  45.4 -121.2   9.4306   3.2 ------	UNKNOWN
Plot creation:
Mon Feb 13 11:18:16 EST 2017