Special notes of this burst
Image
Pre-slew 15.0-350.0 keV image (Event data)

#   RAcent    DECcent   POSerr    Theta     Phi              Peak Cts       SNR   Name
  332.1493    13.7557   0.0165     6.1394   -19.3931         0.8699197     11.681 TRIG_00733103

Foreground time interval of the image:
  2.948  51.741 (delta_t =  48.793 [sec])
Background time interval of the image:
-239.560   2.948 (delta_t = 242.508 [sec])
Lightcurves
Notes:
- 1) The mask-weighted light curves are using the flight position.
- 2) Multiple plots of different time binning/intervals are shown to cover all scenarios of short/long GRBs, rate/image triggers, and real/false positives.
- 3) For all the mask-weighted lightcurves, the y-axis units are counts/sec/det where a det is 0.4 x 0.4 = 0.16 sq cm.
- 4) The verticle lines correspond to following: green dotted lines are T50 interval, black dotted lines are T90 interval, blue solid line(s) is a spacecraft slew start time, and orange solid line(s) is a spacecraft slew end time.
- 5) Time of each bin is in the middle of the bin.
1 s binning
From T0-310 s to T0+310 s

From T100_start - 20 s to T100_end + 30 s
Full time interval

64 ms binning
Full time interval

From T100_start to T100_end
From T0-5 sec to T0+5 sec
16 ms binning
From T100_start-5 s to T100_start+5 s

Blue+Cyan dotted lines: Time interval of the scaled map
From 0.000000 to 8.192000
8 ms binning
From T100_start-3 s to T100_start+3 s
Blue+Cyan dotted lines: Time interval of the scaled map
From 0.000000 to 8.192000
2 ms binning
From T100_start-1 s to T100_start+1 s

Blue+Cyan dotted lines: Time interval of the scaled map
From 0.000000 to 8.192000
SN=5 or 10 sec. binning (whichever binning is satisfied first)

SN=5 or 10 sec. binning (T < 200 sec)

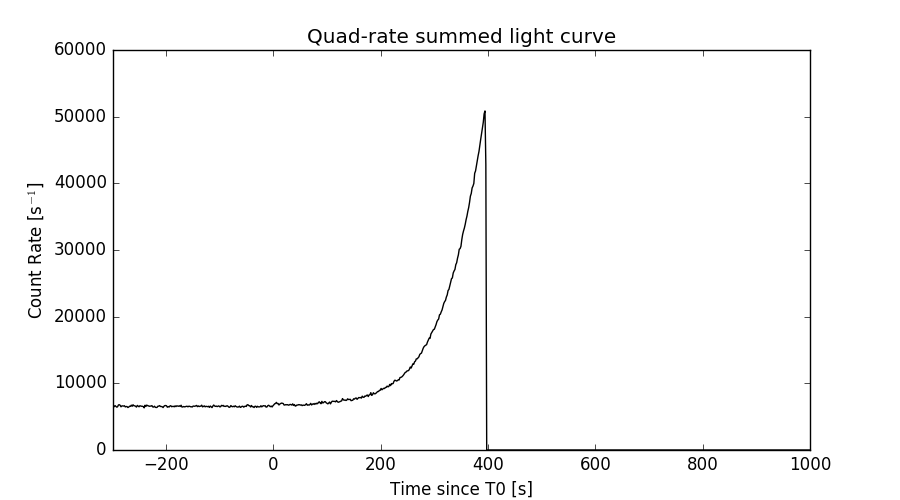
Quad-rate summed light curves (from T0-300s to T0+1000s)
Spectral Evolution

Spectra
Notes:
- 1) The fitting includes the systematic errors.
- 2) When the burst includes telescope slew time periods, the fitting uses an average response file made from multiple 5-s response files through out the slew time plus single time preiod for the non-slew times, and weighted by the total counts in the corresponding time period using addrmf. An average response file is needed becuase a spectral fit using the pre-slew DRM will introduce some errors in both a spectral shape and a normalization if the PHA file contains a lot of the slew/post-slew time interval.
- 3) For fits to more complicated models (e.g. a power-law over a cutoff power-law), the BAT team has decided to require a chi-square improvement of more than 6 for each extra dof.
Time averaged spectrum fit using the average DRM
Power-law model

Time interval is from    2.948 sec. to   52.496 sec.

Spectral model in power-law:
------------------------------------------------------------
Parameters  : value       lower 90%   higher 90%
Photon index: 1.45813     ( -0.245044   0.24752 )
Norm@50keV  : 9.91111E-04    ( -0.000147034   0.000145157 )
------------------------------------------------------------
#Fit statistic : Chi-Squared =          43.39 using 59 PHA bins.
# Reduced chi-squared =         0.7613 for     57 degrees of freedom
# Null hypothesis probability =   9.080462e-01

Photon flux (15-150 keV)    in 49.55 sec: 0.122392 ( -0.017167  0.017174 ) ph/cm2/s
Energy fluence (15-150 keV)             : 4.69303e-07 ( -7.72603e-08  7.89024e-08 ) ergs/cm2
Cutoff power-law model

Time interval is from    2.948 sec. to   52.496 sec.
Spectral model in the cutoff power-law:
------------------------------------------------------------
Parameters  : value       lower 90%   higher 90%
Photon index: 1.23155     ( -1.05967   0.921619 )
Epeak [keV] : 157.820      ( -157.837 -157.837 )
Norm@50keV  : 1.31396E-03    ( -0.000462553   0.0035023 )
------------------------------------------------------------
#Fit statistic : Chi-Squared =          43.21 using 59 PHA bins.
# Reduced chi-squared =         0.7716 for     56 degrees of freedom
# Null hypothesis probability =   8.944944e-01

Photon flux (15-150 keV)    in 49.55 sec: 0.121284 ( -0.017752  0.017664 ) ph/cm2/s
Energy fluence (15-150 keV)             : 4.57819e-07 ( -8.98223e-08  8.72154e-08 ) ergs/cm2
Band function

Time interval is from    2.948 sec. to   52.496 sec.


Spectral model in the Band function:
------------------------------------------------------------
Parameters  : value       lower 90%   higher 90%
alpha       :    (     )
beta        :     (     )
Epeak [keV] :       (   )
Norm@50keV   :     (     )
------------------------------------------------------------

Photon flux (15-150 keV)    in  sec:  (    ) ph/cm2/s
Energy fluence (15-150 keV)             : 0 ( 0  0 ) ergs/cm2
Single BB

Spectral model blackbody:
------------------------------------------------------------
Parameters  : value    Lower 90%  Upper 90%
kT [keV]    : 13.7555  (-2.49464  3.19723)
R^2/D10^2   : 1.86710E-02  (-0.00958753   0.0190493)
(R is the radius in km and D10 is the distance to the source in units of 10 kpc)
------------------------------------------------------------
#Fit statistic : Chi-Squared =          55.44 using 59 PHA bins.
# Reduced chi-squared =         0.9726 for     57 degrees of freedom
# Null hypothesis probability =   5.337920e-01

Energy  Fluence     90% Error
[keV]   [erg/cm2]   [erg/cm2]
15- 25  3.703e-08   1.117e-08
25- 50  1.353e-07   2.705e-08
50-150  1.671e-07   4.982e-08
15-150  3.394e-07   7.482e-08
Thermal bremsstrahlung (OTTB)

Spectral model: thermal bremsstrahlung
------------------------------------------------------------
Parameters  : value         Lower 90%    Upper 90%
kT [keV]    : 199.363       (-86.0548      -199.363)
Norm        : 0.500694       (-0.0698853     0.0698853)
------------------------------------------------------------
#Fit statistic : Chi-Squared =          43.45 using 59 PHA bins.
# Reduced chi-squared =         0.7623 for     57 degrees of freedom
# Null hypothesis probability =   9.070164e-01

Energy  Fluence     90% Error
[keV]   [erg/cm2]   [erg/cm2]
15- 25  6.178e-08   3.521e-08
25- 50  1.188e-07   6.528e-08
50-150  2.606e-07   1.460e-07
15-150  4.412e-07   2.463e-07
Double BB

Spectral model: bbodyrad<1> + bbodyrad<2>
------------------------------------------------------------
Parameters  : value         Lower 90%    Upper 90%
kT1 [keV]   : 7.13673        (-2.34413      3.3271)
R1^2/D10^2  : 0.127396        (-0.0883382      0.361973)
kT2 [keV]   : 29.0804        (-10.7089      110.683)
R2^2/D10^2  : 1.10614E-03    (-0.00104751   0.00452665)
------------------------------------------------------------
#Fit statistic : Chi-Squared =          41.97 using 59 PHA bins.
# Reduced chi-squared =         0.7632 for     55 degrees of freedom
# Null hypothesis probability =   9.017075e-01

Energy  Fluence     90% Error
[keV]   [erg/cm2]   [erg/cm2]
15- 25  6.006e-08   3.131e-08
25- 50  1.199e-07   6.342e-08
50-150  2.852e-07   1.651e-07
15-150  4.651e-07   2.442e-07
Peak spectrum fit
Power-law model

Time interval is from    4.972 sec. to    5.972 sec.

Spectral model in power-law:
------------------------------------------------------------
Parameters  : value       lower 90%   higher 90%
Photon index: 1.36328     ( -0.754033   0.787455 )
Norm@50keV  : 2.52162E-03    ( -0.00106654   0.00102644 )
------------------------------------------------------------
#Fit statistic : Chi-Squared =          49.52 using 59 PHA bins.
# Reduced chi-squared =         0.8687 for     57 degrees of freedom
# Null hypothesis probability =   7.489084e-01

Photon flux (15-150 keV)    in 1 sec: 0.304630 ( -0.122393  0.122735 ) ph/cm2/s
Energy fluence (15-150 keV)             : 2.45584e-08 ( -1.11752e-08  1.17419e-08 ) ergs/cm2
Cutoff power-law model

Time interval is from    4.972 sec. to    5.972 sec.
Spectral model in the cutoff power-law:
------------------------------------------------------------
Parameters  : value       lower 90%   higher 90%
Photon index: 0.782088     ( -8.8684   7.12595 )
Epeak [keV] : 107.707      ( -107.523 -107.523 )
Norm@50keV  : 4.87775E-03    ( -0.00489039   38.2174 )
------------------------------------------------------------
#Fit statistic : Chi-Squared =          49.42 using 59 PHA bins.
# Reduced chi-squared =         0.8825 for     56 degrees of freedom
# Null hypothesis probability =   7.203853e-01

Photon flux (15-150 keV)    in 1 sec: 0.296784 ( -0.139673  0.127813 ) ph/cm2/s
Energy fluence (15-150 keV)             : 2.35451e-08 ( -1.17122e-08  1.25094e-08 ) ergs/cm2
Band function

Time interval is from    4.972 sec. to    5.972 sec.


Spectral model in the Band function:
------------------------------------------------------------
Parameters  : value       lower 90%   higher 90%
alpha       :    (     )
beta        :     (     )
Epeak [keV] :       (   )
Norm@50keV   :     (     )
------------------------------------------------------------

Photon flux (15-150 keV)    in  sec:  (    ) ph/cm2/s
Energy fluence (15-150 keV)             : 0 ( 0  0 ) ergs/cm2
Single BB

Spectral model blackbody:
------------------------------------------------------------
Parameters  : value    Lower 90%  Upper 90%
kT [keV]    : 16.3335  (-6.02661  12.0607)
R^2/D10^2   : 2.70719E-02  (-0.0270737   0.102114)
(R is the radius in km and D10 is the distance to the source in units of 10 kpc)
------------------------------------------------------------
#Fit statistic : Chi-Squared =          50.01 using 59 PHA bins.
# Reduced chi-squared =         0.8773 for     57 degrees of freedom
# Null hypothesis probability =   7.326154e-01

Energy  Fluence     90% Error
[keV]   [erg/cm2]   [erg/cm2]
15- 25  1.486e-09   9.905e-10
25- 50  6.364e-09   3.970e-09
50-150  1.196e-08   8.530e-09
15-150  1.981e-08   1.279e-08
Thermal bremsstrahlung (OTTB)

Spectral model: thermal bremsstrahlung
------------------------------------------------------------
Parameters  : value         Lower 90%    Upper 90%
kT [keV]    : 199.363       (-199.363      -199.363)
Norm        : 1.24859       (-0.499989     0.499989)
------------------------------------------------------------
#Fit statistic : Chi-Squared =          49.66 using 59 PHA bins.
# Reduced chi-squared =         0.8712 for     57 degrees of freedom
# Null hypothesis probability =   7.442436e-01

Energy  Fluence     90% Error
[keV]   [erg/cm2]   [erg/cm2]
15- 25  3.109e-09   2.043e-09
25- 50  5.981e-09   3.930e-09
50-150  1.312e-08   8.625e-09
15-150  2.221e-08   1.411e-08
Double BB

Spectral model: bbodyrad<1> + bbodyrad<2>
------------------------------------------------------------
Parameters  : value         Lower 90%    Upper 90%
kT1 [keV]   : 9.76110E-02        (0.822496      -0.097611)
R1^2/D10^2  : 4.73537E+10        (-4.73537e+10      -4.73537e+10)
kT2 [keV]   : 16.3331        (-6.02657      12.0607)
R2^2/D10^2  : 2.70740E-02    (-0.0270739   0.102114)
------------------------------------------------------------
#Fit statistic : Chi-Squared =          50.01 using 59 PHA bins.
# Reduced chi-squared =         0.9092 for     55 degrees of freedom
# Null hypothesis probability =   6.653944e-01

Energy  Fluence     90% Error
[keV]   [erg/cm2]   [erg/cm2]
15- 25  0.000e+00   0.000e+00
25- 50  0.000e+00   0.000e+00
50-150  0.000e+00   0.000e+00
15-150  0.000e+00   0.000e+00
Pre-slew spectrum (Pre-slew PHA with pre-slew DRM)
Power-law model

Spectral model in power-law:
------------------------------------------------------------
Parameters  : value       lower 90%   higher 90%
Photon index: 1.45679     ( -0.244708   0.247161 )
Norm@50keV  : 1.00204E-03    ( -0.000148161   0.000146284 )
------------------------------------------------------------
#Fit statistic : Chi-Squared =          43.19 using 59 PHA bins.
# Reduced chi-squared =         0.7578 for     57 degrees of freedom
# Null hypothesis probability =   9.117354e-01

Photon flux (15-150 keV)    in 48.79 sec: 0.123697 ( -0.0173071  0.0173145 ) ph/cm2/s
Energy fluence (15-150 keV)             : 4.67258e-07 ( -7.66876e-08  7.8347e-08 ) ergs/cm2
Cutoff power-law model

Spectral model in the cutoff power-law:
------------------------------------------------------------
Parameters  : value       lower 90%   higher 90%
Photon index: 1.24040     ( -1.04749   0.923091 )
Epeak [keV] : 163.821      ( -163.831 -163.831 )
Norm@50keV  : 1.31091E-03    (     )
------------------------------------------------------------
#Fit statistic : Chi-Squared =          43.02 using 59 PHA bins.
# Reduced chi-squared =         0.7683 for     56 degrees of freedom
# Null hypothesis probability =   8.983103e-01

Photon flux (15-150 keV)    in 48.79 sec: 0.122612 ( -0.017886  0.0178 ) ph/cm2/s
Energy fluence (15-150 keV)             : 4.5666e-07 ( -8.88393e-08  8.65144e-08 ) ergs/cm2
Band function

Spectral model in the Band function:
------------------------------------------------------------
Parameters  : value       lower 90%   higher 90%
alpha       :    (     )
beta        :     (     )
Epeak [keV] :       (   )
Norm@50keV   :     (     )
------------------------------------------------------------

Photon flux (15-150 keV)    in  sec:  (    ) ph/cm2/s
Energy fluence (15-150 keV)             : 0 ( 0  0 ) ergs/cm2
S(25-50 keV) vs. S(50-100 keV) plot

S(25-50 keV)  = 1.13e-07
S(50-100 keV) = 1.65e-07
T90 vs. Hardness ratio plot

T90                                   = 32.0439999699593 sec.
Hardness ratio (energy fluence ratio) = 1.46018
Color vs. Color plot

Count Ratio  (25-50 keV) / (15-25 keV) = 1.17585
Count Ratio (50-100 keV) / (15-25 keV) = 0.877372
Mask shadow pattern

IMX = 1.014614624236058E-01, IMY = 3.571647072835954E-02
TIME vs. PHA plot around the trigger time

Blue+Cyan dotted lines: Time interval of the scaled map
From 0.000000 to 8.192000
TIME vs. DetID plot around the trigger time
Blue+Cyan dotted lines: Time interval of the scaled map
From 0.000000 to 8.192000
100 us light curve (15-350 keV)

Blue+Cyan dotted lines: Time interval of the scaled map
From 0.000000 to 8.192000
Spacecraft aspect plot

Bright source in the pre-burst/pre-slew/post-slew images
Pre-burst image of 15-350 keV band
Time interval of the image:
-239.560000 2.948000

# RAcent  DECcent POSerr Theta    Phi  PeakCts   SNR AngSep     Name
#  [deg]    [deg]    ['] [deg]  [deg]                   [']
288.7887  10.8994    2.0  48.3  -34.5   2.9016   5.7    2.8	GRS 1915+105
299.5856  35.2070    0.4  42.0    1.8   8.3086  26.8    0.4	Cyg X-1
308.0991  40.9633    2.2  39.3   14.7   1.5831   5.2    0.8	Cyg X-3
326.2812  38.4039    6.1  28.6   31.7   0.4551   1.9    7.1	Cyg X-2
318.3584  21.2682    2.9  21.1   -9.5   0.8738   4.0 ------	UNKNOWN
334.6925  -4.1734    2.8  16.3 -116.4   0.8959   4.2 ------	UNKNOWN
Pre-slew background subtracted image of 15-350 keV band
Time interval of the image:
2.948000 51.740590

# RAcent  DECcent POSerr Theta    Phi  PeakCts   SNR AngSep     Name
#  [deg]    [deg]    ['] [deg]  [deg]                   [']
288.9177  11.0019    3.8  48.2  -34.4   0.5842   3.0    7.8	GRS 1915+105
299.6889  35.0768   23.5  41.8    1.6  -0.0609  -0.5    8.9	Cyg X-1
307.9450  40.9435    4.5  39.4   14.6   0.2998   2.5    7.5	Cyg X-3
326.1157  38.1889    5.1  28.5   31.3  -0.2071  -2.2    8.4	Cyg X-2
332.1493  13.7557    1.0   6.1  -19.4   0.8701  11.7 ------	UNKNOWN
354.1235 -37.3448    2.4  51.4 -145.0   1.4697   4.8 ------	UNKNOWN
279.6721  13.0125    2.2  57.0  -30.7   2.4571   5.3 ------	UNKNOWN
Post-slew image of 15-350 keV band
Time interval of the image:
79.740590 422.670000

# RAcent  DECcent POSerr Theta    Phi  PeakCts   SNR AngSep     Name
#  [deg]    [deg]    ['] [deg]  [deg]                   [']
288.7958  10.9660    2.2  42.4  -43.3   1.5746   5.2    1.2	GRS 1915+105
299.5845  35.2158    0.6  36.3   -2.5   4.5256  20.8    0.9	Cyg X-1
308.1480  40.9890    4.1  34.3   12.5   0.5862   2.8    2.8	Cyg X-3
325.9013  38.3130    0.0  25.1   33.9  -0.3902  -2.2   12.7	Cyg X-2
327.1813  25.7272    2.6  12.8   24.9   0.6983   4.5 ------	UNKNOWN
291.5253  -3.0680    2.4  43.7  -64.2   3.3462   4.9 ------	UNKNOWN
321.2655 -30.3474    2.3  45.4 -121.2   3.1944   4.9 ------	UNKNOWN
Plot creation:
Mon Feb 13 10:52:46 EST 2017