Estimated redshift from machine learning (Ukwatta et al. 2016) - may take a few minute to calcaulte
Image
Pre-slew 15.0-350.0 keV image (Event data)
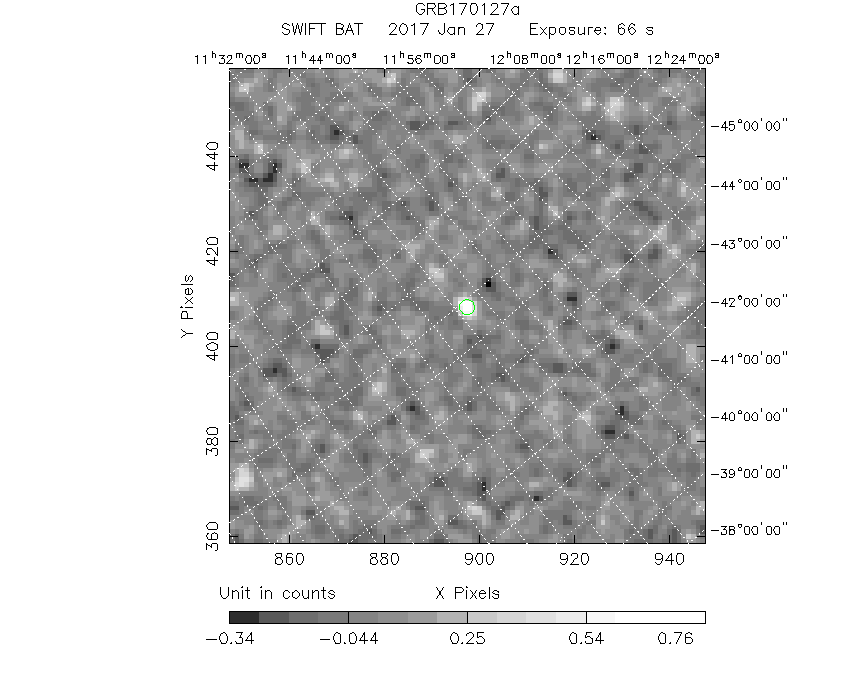
# RAcent DECcent POSerr Theta Phi Peak Cts SNR Name
174.3663 -45.8450 0.0202 8.4423 104.5470 0.9141494 9.488 TRIG_00735326
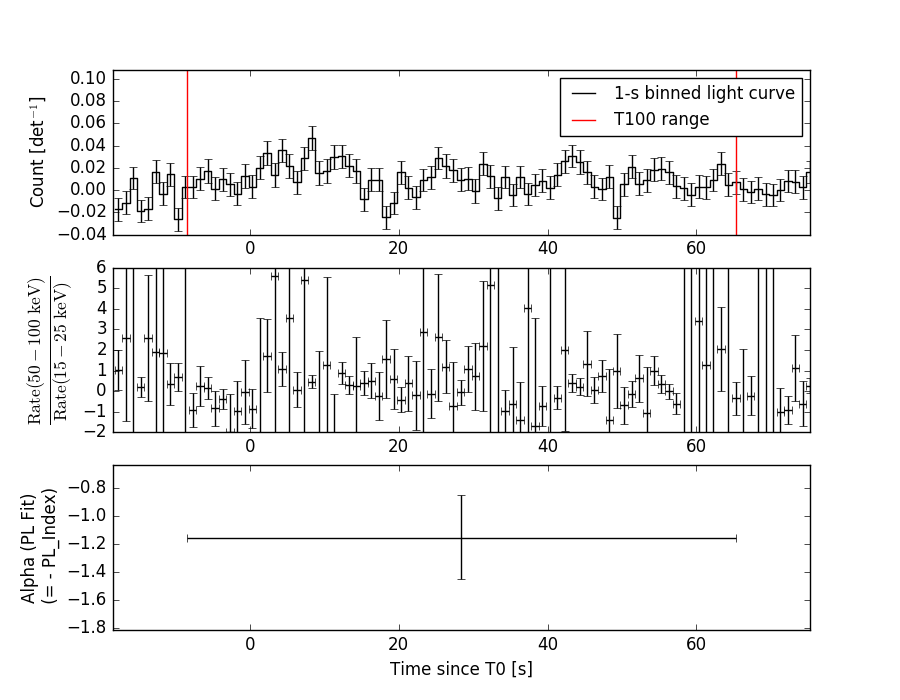
Foreground time interval of the image:
-8.496 57.093 (delta_t = 65.589 [sec])
Background time interval of the image:
-183.107 -8.496 (delta_t = 174.611 [sec])
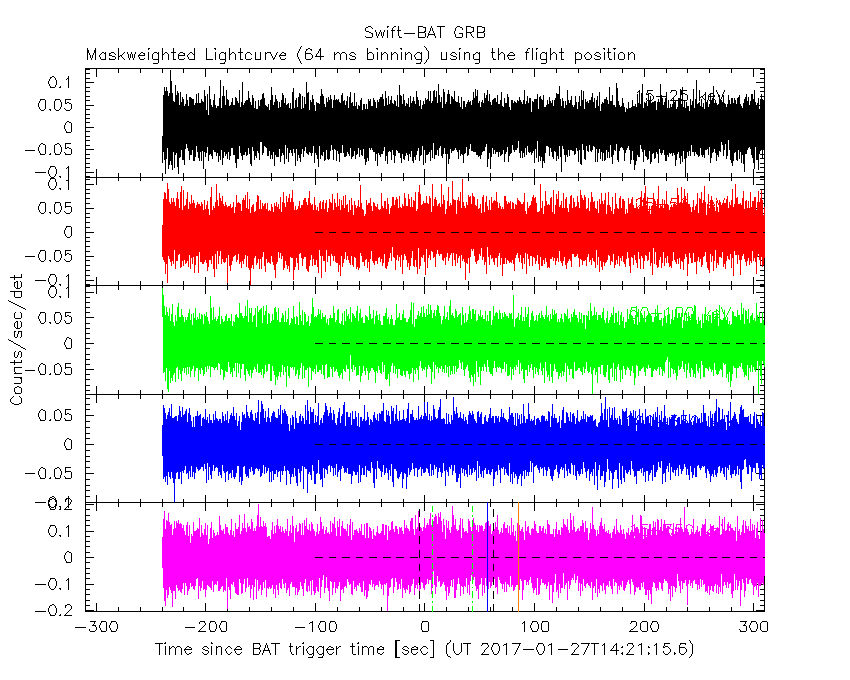
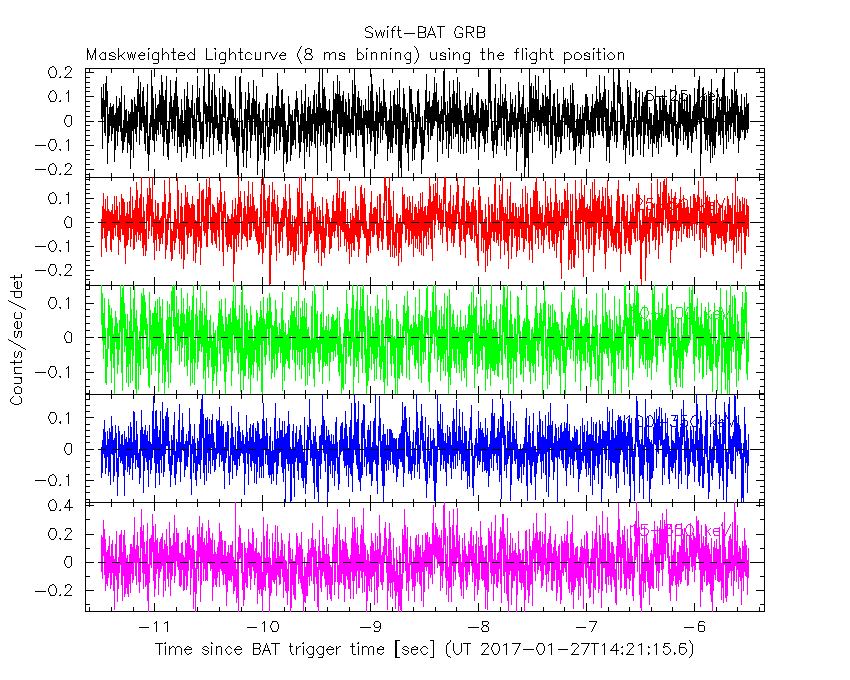
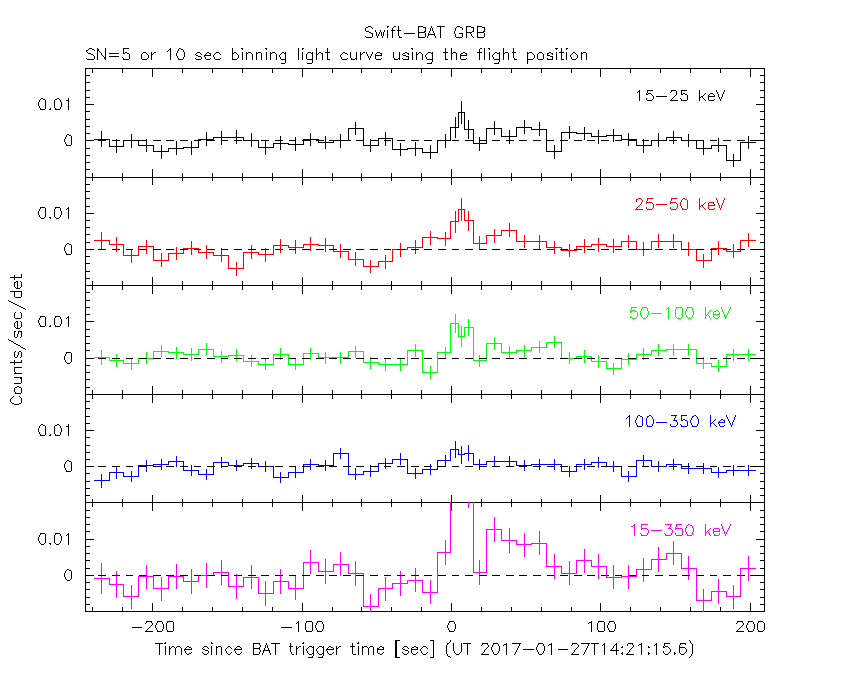
Lightcurves
Notes:
- 1) The mask-weighted light curves are using the flight position.
- 2) Multiple plots of different time binning/intervals are shown to cover all scenarios of short/long GRBs, rate/image triggers, and real/false positives.
- 3) For all the mask-weighted lightcurves, the y-axis units are counts/sec/det where a det is 0.4 x 0.4 = 0.16 sq cm.
- 4) The verticle lines correspond to following: green dotted lines are T50 interval, black dotted lines are T90 interval, blue solid line(s) is a spacecraft slew start time, and orange solid line(s) is a spacecraft slew end time.
- 5) Time of each bin is in the middle of the bin.
1 s binning
From T0-310 s to T0+310 s

From T100_start - 20 s to T100_end + 30 s

Full time interval

64 ms binning
Full time interval
From T100_start to T100_end

From T0-5 sec to T0+5 sec

16 ms binning
From T100_start-5 s to T100_start+5 s

Blue+Cyan dotted lines: Time interval of the scaled map
From 0.000000 to 12.160000
8 ms binning
From T100_start-3 s to T100_start+3 s
Blue+Cyan dotted lines: Time interval of the scaled map
From 0.000000 to 12.160000
2 ms binning
From T100_start-1 s to T100_start+1 s

Blue+Cyan dotted lines: Time interval of the scaled map
From 0.000000 to 12.160000
SN=5 or 10 sec. binning (whichever binning is satisfied first)

SN=5 or 10 sec. binning (T < 200 sec)
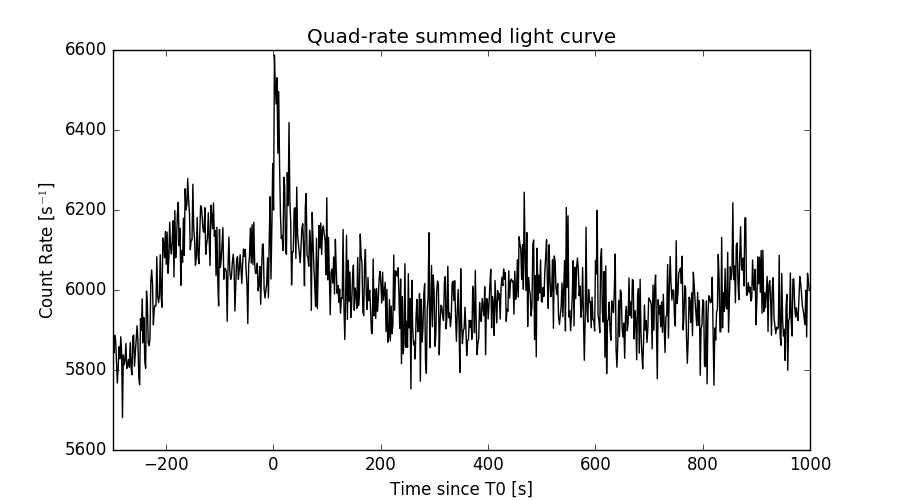
Quad-rate summed light curves (from T0-300s to T0+1000s)
Spectral Evolution
Spectra
Notes:
- 1) The fitting includes the systematic errors.
- 2) When the burst includes telescope slew time periods, the fitting uses an average response file made from multiple 5-s response files through out the slew time plus single time preiod for the non-slew times, and weighted by the total counts in the corresponding time period using addrmf. An average response file is needed becuase a spectral fit using the pre-slew DRM will introduce some errors in both a spectral shape and a normalization if the PHA file contains a lot of the slew/post-slew time interval.
- 3) For fits to more complicated models (e.g. a power-law over a cutoff power-law), the BAT team has decided to require a chi-square improvement of more than 6 for each extra dof.
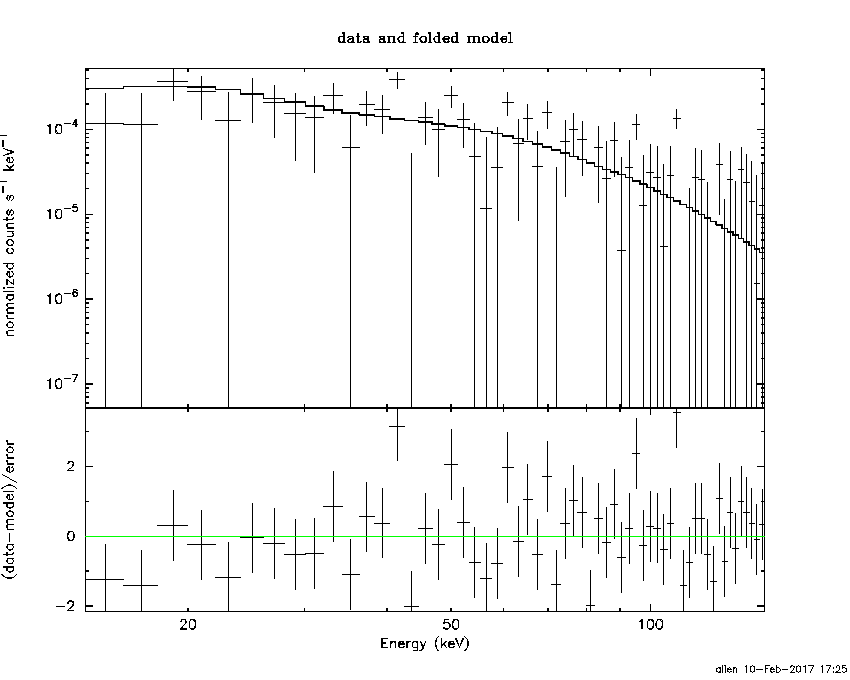
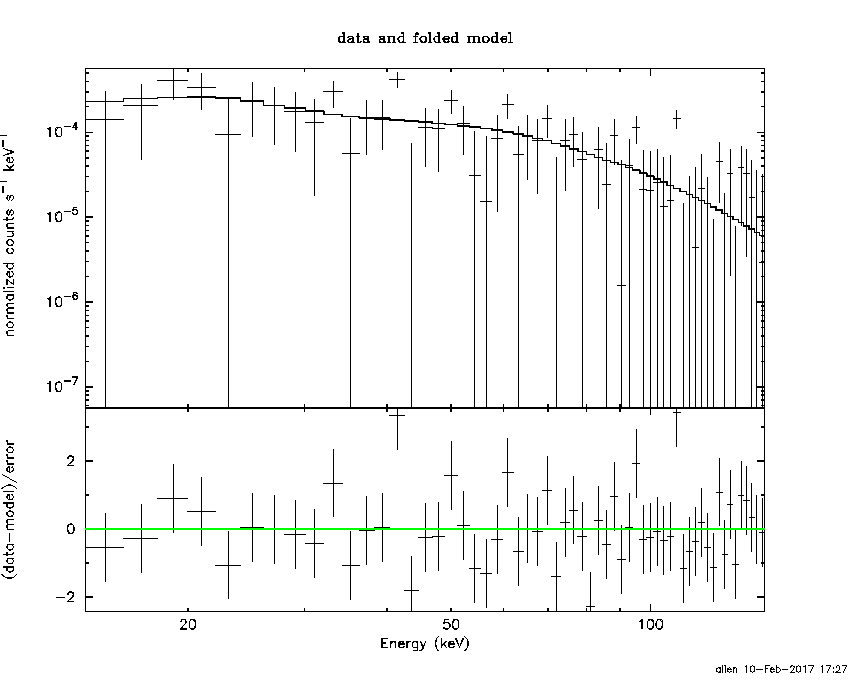
Time averaged spectrum fit using the average DRM
Power-law model
Time interval is from   -8.496 sec. to   65.268 sec.

Spectral model in power-law:
------------------------------------------------------------
Parameters  : value       lower 90%   higher 90%
Photon index: 1.15458     ( -0.307627   0.295181 )
Norm@50keV  : 7.01309E-04    ( -0.000120489   0.000120444 )
------------------------------------------------------------
#Fit statistic : Chi-Squared =          70.00 using 59 PHA bins.
# Reduced chi-squared =          1.228 for     57 degrees of freedom
# Null hypothesis probability =   1.156423e-01

Photon flux (15-150 keV)    in 73.76 sec: 8.18319E-02 ( -0.0144065  0.0144555 ) ph/cm2/s
Energy fluence (15-150 keV)             : 5.3184e-07 ( -1.00837e-07  1.02367e-07 ) ergs/cm2
Cutoff power-law model

Time interval is from   -8.496 sec. to   65.268 sec.
Spectral model in the cutoff power-law:
------------------------------------------------------------
Parameters  : value       lower 90%   higher 90%
Photon index: 0.576837     ( -1.5775   1.00167 )
Epeak [keV] : 127.581      ( -127.583 -127.583 )
Norm@50keV  : 1.34511E-03    ( -0.000743642   0.00622305 )
------------------------------------------------------------
#Fit statistic : Chi-Squared =          69.33 using 59 PHA bins.
# Reduced chi-squared =          1.238 for     56 degrees of freedom
# Null hypothesis probability =   1.087315e-01

Photon flux (15-150 keV)    in 73.76 sec: 7.97569E-02 ( -0.0151666  0.0150834 ) ph/cm2/s
Energy fluence (15-150 keV)             : 5.06851e-07 ( -6.60115e-08  1.14262e-07 ) ergs/cm2
Band function

Time interval is from   -8.496 sec. to   65.268 sec.


Spectral model in the Band function:
------------------------------------------------------------
Parameters  : value       lower 90%   higher 90%
alpha       :    (     )
beta        :     (     )
Epeak [keV] :       (   )
Norm@50keV   :     (     )
------------------------------------------------------------

Photon flux (15-150 keV)    in  sec:  (    ) ph/cm2/s
Energy fluence (15-150 keV)             : 0 ( 0  0 ) ergs/cm2
Single BB
Spectral model blackbody:
------------------------------------------------------------
Parameters  : value    Lower 90%  Upper 90%
kT [keV]    : 17.9074  (-3.65707  5.10457)
R^2/D10^2   : 5.44393E-03  (-0.00307001   0.00631056)
(R is the radius in km and D10 is the distance to the source in units of 10 kpc)
------------------------------------------------------------
#Fit statistic : Chi-Squared =          73.45 using 59 PHA bins.
# Reduced chi-squared =          1.289 for     57 degrees of freedom
# Null hypothesis probability =   7.015340e-02

Energy  Fluence     90% Error
[keV]   [erg/cm2]   [erg/cm2]
15- 25  2.582e-08   8.464e-09
25- 50  1.190e-07   3.380e-08
50-150  2.765e-07   9.379e-08
15-150  4.213e-07   1.200e-07
Thermal bremsstrahlung (OTTB)
Spectral model: thermal bremsstrahlung
------------------------------------------------------------
Parameters  : value         Lower 90%    Upper 90%
kT [keV]    : 200.000       (-59.8901      -200)
Norm        : 0.337537       (-0.0593236     0.0593236)
------------------------------------------------------------
#Fit statistic : Chi-Squared =          74.12 using 59 PHA bins.
# Reduced chi-squared =          1.300 for     57 degrees of freedom
# Null hypothesis probability =   6.335223e-02

Energy  Fluence     90% Error
[keV]   [erg/cm2]   [erg/cm2]
15- 25  6.202e-08   3.553e-08
25- 50  1.193e-07   6.871e-08
50-150  2.617e-07   1.511e-07
15-150  4.430e-07   2.528e-07
Double BB

Spectral model: bbodyrad<1> + bbodyrad<2>
------------------------------------------------------------
Parameters  : value         Lower 90%    Upper 90%
kT1 [keV]   : 9.76306        (-6.5818      5.49533)
R1^2/D10^2  : 2.36510E-02        (-0.0138589      0.158119)
kT2 [keV]   : 32.9500        (-26.6841      -46.0822)
R2^2/D10^2  : 5.18694E-04    (-0.000185665   0.00359388)
------------------------------------------------------------
#Fit statistic : Chi-Squared =          68.90 using 59 PHA bins.
# Reduced chi-squared =          1.253 for     55 degrees of freedom
# Null hypothesis probability =   9.856103e-02

Energy  Fluence     90% Error
[keV]   [erg/cm2]   [erg/cm2]
15- 25  3.970e-08   2.538e-08
25- 50  1.198e-07   6.992e-08
50-150  3.272e-07   1.921e-07
15-150  4.867e-07   2.534e-07
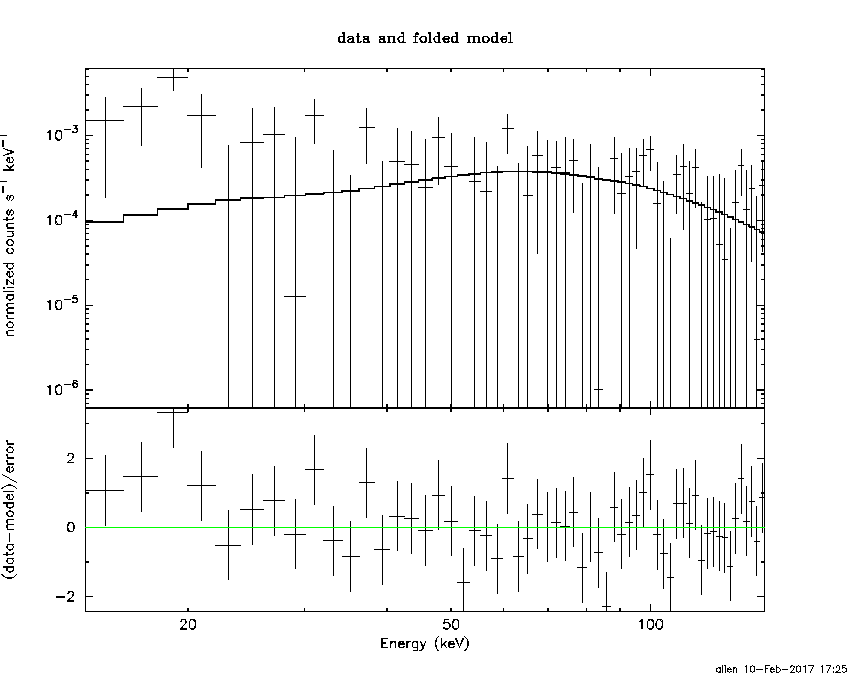
Peak spectrum fit
Power-law model

Time interval is from    7.308 sec. to    8.308 sec.

Spectral model in power-law:
------------------------------------------------------------
Parameters  : value       lower 90%   higher 90%
Photon index: 1.09021     ( -1.35956   1.06229 )
Norm@50keV  : 3.03462E-03    ( -0.00151033   0.00106994 )
------------------------------------------------------------
#Fit statistic : Chi-Squared =          48.24 using 59 PHA bins.
# Reduced chi-squared =         0.8463 for     57 degrees of freedom
# Null hypothesis probability =   7.891492e-01

Photon flux (15-150 keV)    in 1 sec: 0.351074 ( -0.351074  0.132859 ) ph/cm2/s
Energy fluence (15-150 keV)             : 3.19271e-08 ( -1.42044e-08  1.36818e-08 ) ergs/cm2
Cutoff power-law model
Time interval is from    7.308 sec. to    8.308 sec.
Spectral model in the cutoff power-law:
------------------------------------------------------------
Parameters  : value       lower 90%   higher 90%
Photon index: 2.15627     ( -1.80853   2.47841 )
Epeak [keV] : 56.4306      (   )
Norm@50keV  : 1.01047E-03    (     )
------------------------------------------------------------
#Fit statistic : Chi-Squared =          46.62 using 59 PHA bins.
# Reduced chi-squared =         0.8324 for     56 degrees of freedom
# Null hypothesis probability =   8.099817e-01

Photon flux (15-150 keV)    in 1 sec: 0.179390 ( -0.17939  0.095286 ) ph/cm2/s
Energy fluence (15-150 keV)             : 1.17114e-08 ( 0  0 ) ergs/cm2
Band function

Time interval is from    7.308 sec. to    8.308 sec.


Spectral model in the Band function:
------------------------------------------------------------
Parameters  : value       lower 90%   higher 90%
alpha       :    (     )
beta        :     (     )
Epeak [keV] :       (   )
Norm@50keV   :     (     )
------------------------------------------------------------

Photon flux (15-150 keV)    in  sec:  (    ) ph/cm2/s
Energy fluence (15-150 keV)             : 0 ( 0  0 ) ergs/cm2
Single BB
Spectral model blackbody:
------------------------------------------------------------
Parameters  : value    Lower 90%  Upper 90%
kT [keV]    : 62.4802  (-39.9335  -62.3037)
R^2/D10^2   : 7.81838E-04  (-0.000788474   0.00806837)
(R is the radius in km and D10 is the distance to the source in units of 10 kpc)
------------------------------------------------------------
#Fit statistic : Chi-Squared =          51.81 using 59 PHA bins.
# Reduced chi-squared =         0.9090 for     57 degrees of freedom
# Null hypothesis probability =   6.694664e-01

Energy  Fluence     90% Error
[keV]   [erg/cm2]   [erg/cm2]
15- 25  5.527e-09   3.642e-09
25- 50  2.893e-09   2.029e-09
50-150  7.573e-11   9.475e-11
15-150  8.495e-09   5.550e-09
Thermal bremsstrahlung (OTTB)
Spectral model: thermal bremsstrahlung
------------------------------------------------------------
Parameters  : value         Lower 90%    Upper 90%
kT [keV]    : 199.361       (-199.363      -199.363)
Norm        : 1.43874       (-0.525256     0.525251)
------------------------------------------------------------
#Fit statistic : Chi-Squared =          50.01 using 59 PHA bins.
# Reduced chi-squared =         0.8774 for     57 degrees of freedom
# Null hypothesis probability =   7.324582e-01

Energy  Fluence     90% Error
[keV]   [erg/cm2]   [erg/cm2]
15- 25  3.583e-09   2.355e-09
25- 50  6.892e-09   4.513e-09
50-150  1.512e-08   9.575e-09
15-150  2.559e-08   1.611e-08
Double BB

------------------------------------------------------------
Parameters  : value         Lower 90%    Upper 90%
kT1 [keV]   : 3.91434        (-1.55857      1.56274)
R1^2/D10^2  : 6.43950        (-6.35899      126.167)
kT2 [keV]   : 199.724        (-199.724      -199.724)
R2^2/D10^2  : 1.11412E-04    (-4.5583e-05   0.00147252)
------------------------------------------------------------
#Fit statistic : Chi-Squared =          40.84 using 59 PHA bins.
#Fit statistic : Chi-Squared =          40.81 using 59 PHA bins.
# Reduced chi-squared =         0.7426 for     55 degrees of freedom
# Reduced chi-squared =         0.7420 for     55 degrees of freedom
# Null hypothesis probability =   9.224918e-01
# Null hypothesis probability =   9.229804e-01

Energy  Fluence     90% Error
[keV]   [erg/cm2]   [erg/cm2]
15- 25  5.354e-09   3.504e-09
25- 50  3.179e-09   1.711e-09
50-150  3.002e-08   2.526e-08
15-150  3.855e-08   3.439e-08
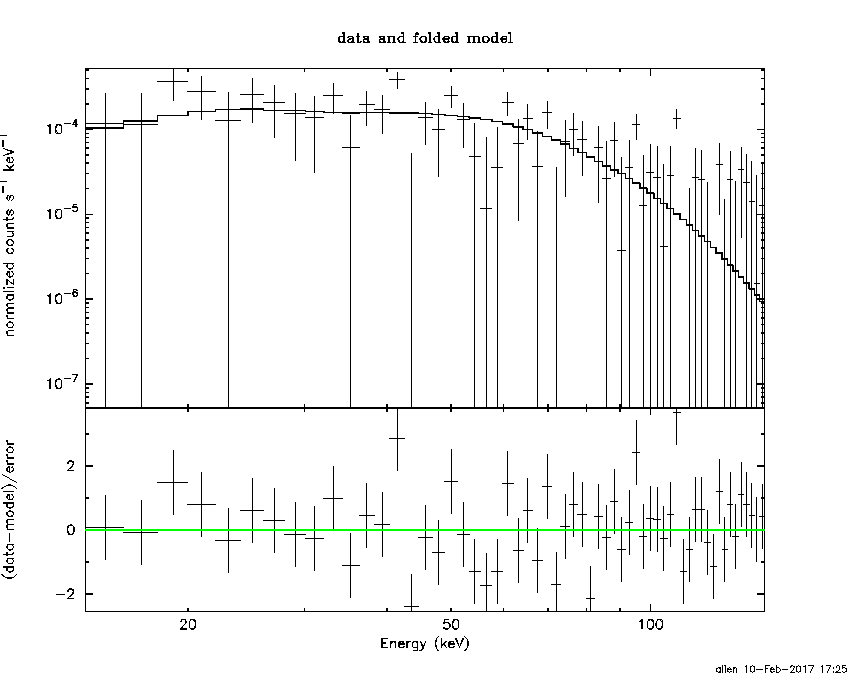
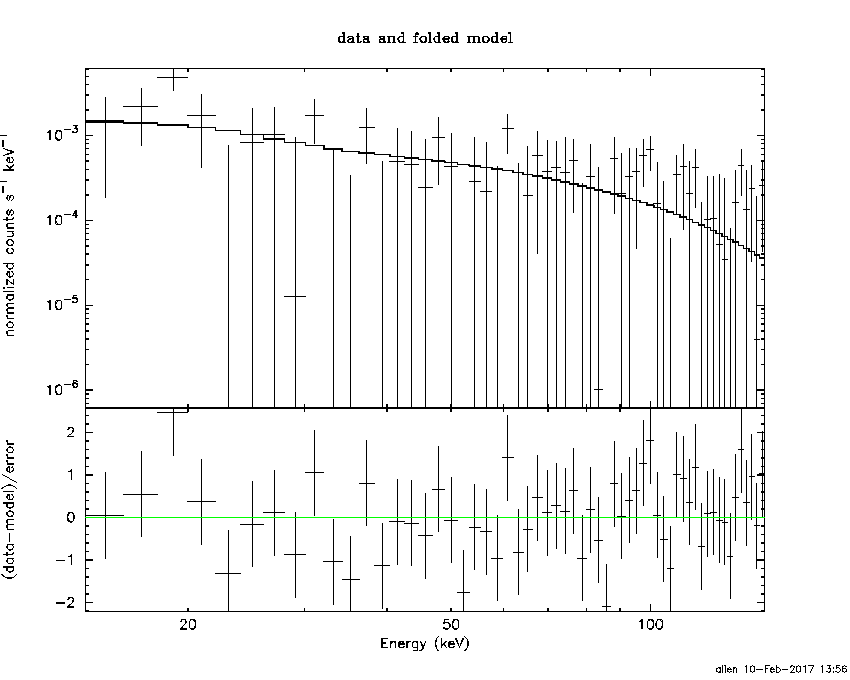
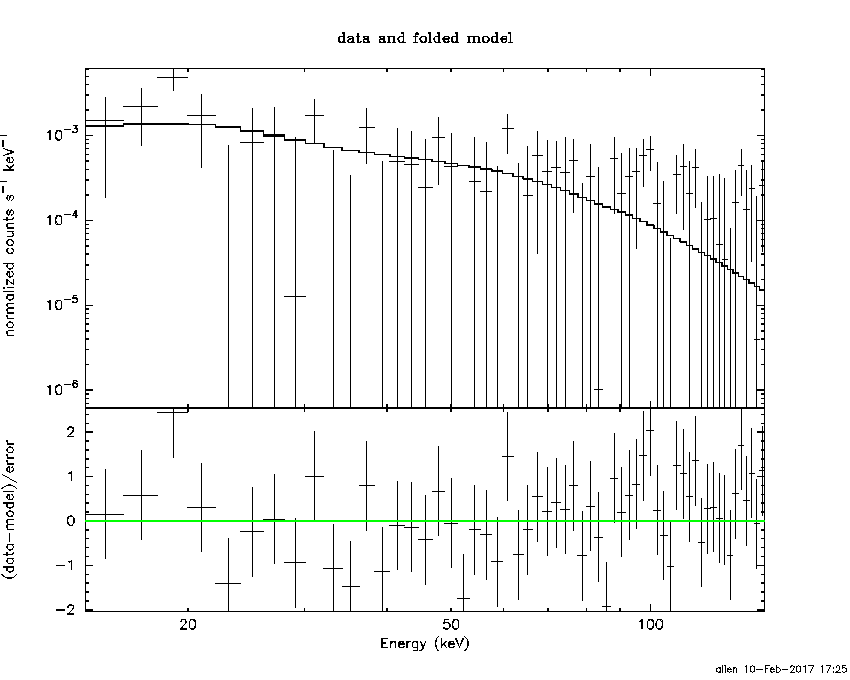
Pre-slew spectrum (Pre-slew PHA with pre-slew DRM)
Power-law model

Spectral model in power-law:
------------------------------------------------------------
Parameters  : value       lower 90%   higher 90%
Photon index: 1.21081     ( -0.32374   0.312988 )
Norm@50keV  : 7.18914E-04    ( -0.000128007   0.000127908 )
------------------------------------------------------------
#Fit statistic : Chi-Squared =          64.74 using 59 PHA bins.
# Reduced chi-squared =          1.136 for     57 degrees of freedom
# Null hypothesis probability =   2.247648e-01

Photon flux (15-150 keV)    in 65.59 sec: 8.45165E-02 ( -0.0153677  0.0154101 ) ph/cm2/s
Energy fluence (15-150 keV)             : 4.76943e-07 ( -9.48425e-08  9.65695e-08 ) ergs/cm2
Cutoff power-law model
Spectral model in the cutoff power-law:
------------------------------------------------------------
Parameters  : value       lower 90%   higher 90%
Photon index: 0.945483     ( -1.51045   1.8748 )
Epeak [keV] : 204.602      ( -204.605 -204.605 )
Norm@50keV  : 9.72642E-04    (     )
------------------------------------------------------------
#Fit statistic : Chi-Squared =          64.60 using 59 PHA bins.
# Reduced chi-squared =          1.154 for     56 degrees of freedom
# Null hypothesis probability =   2.014694e-01

Photon flux (15-150 keV)    in 65.59 sec: 8.35183E-02 ( -0.0161043  0.0159759 ) ph/cm2/s
Energy fluence (15-150 keV)             : 4.66578e-07 ( -1.0845e-07  1.04428e-07 ) ergs/cm2
Band function

Spectral model in the Band function:
------------------------------------------------------------
Parameters  : value       lower 90%   higher 90%
alpha       :    (     )
beta        :     (     )
Epeak [keV] :       (   )
Norm@50keV   :     (     )
------------------------------------------------------------

Photon flux (15-150 keV)    in  sec:  (    ) ph/cm2/s
Energy fluence (15-150 keV)             : 0 ( 0  0 ) ergs/cm2
S(25-50 keV) vs. S(50-100 keV) plot

S(25-50 keV)  = 1.08e-07
S(50-100 keV) = 1.95e-07
T90 vs. Hardness ratio plot
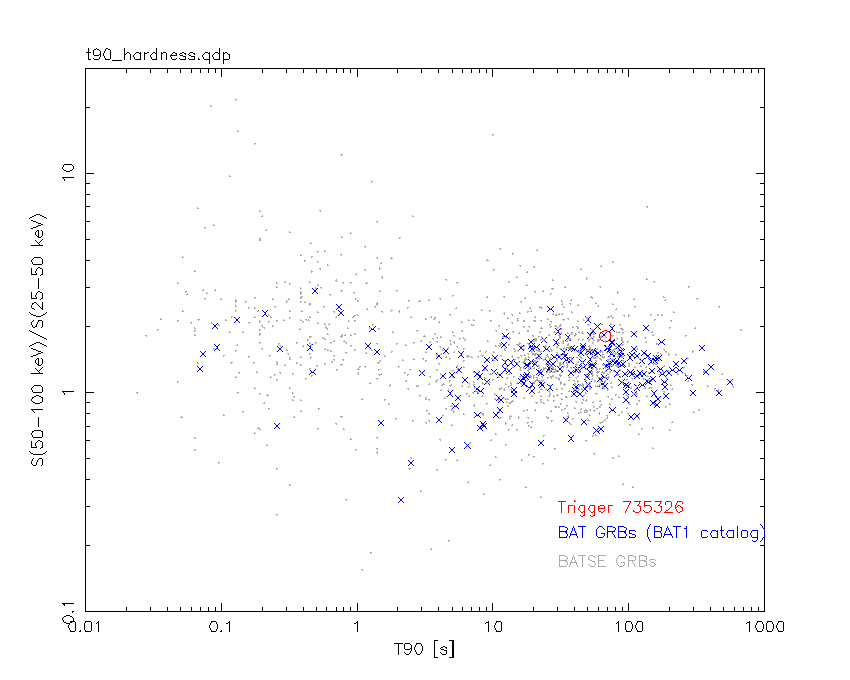
T90                                   = 67.3759999871254 sec.
Hardness ratio (energy fluence ratio) = 1.80556
Color vs. Color plot

Count Ratio  (25-50 keV) / (15-25 keV) = 1.88328
Count Ratio (50-100 keV) / (15-25 keV) = 1.41307
Mask shadow pattern
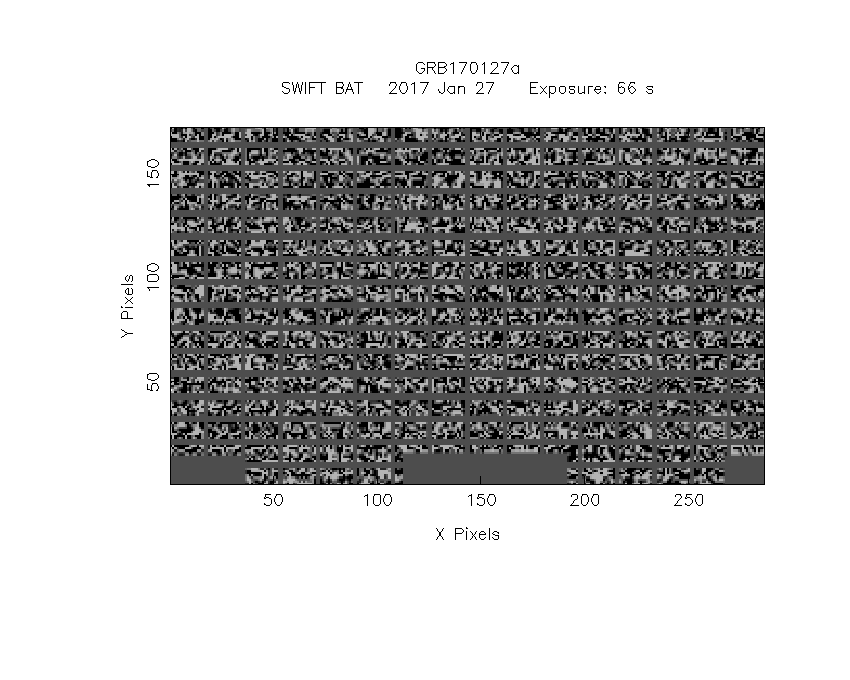
IMX = -3.727964980780391E-02, IMY = -1.436632796535023E-01
TIME vs. PHA plot around the trigger time
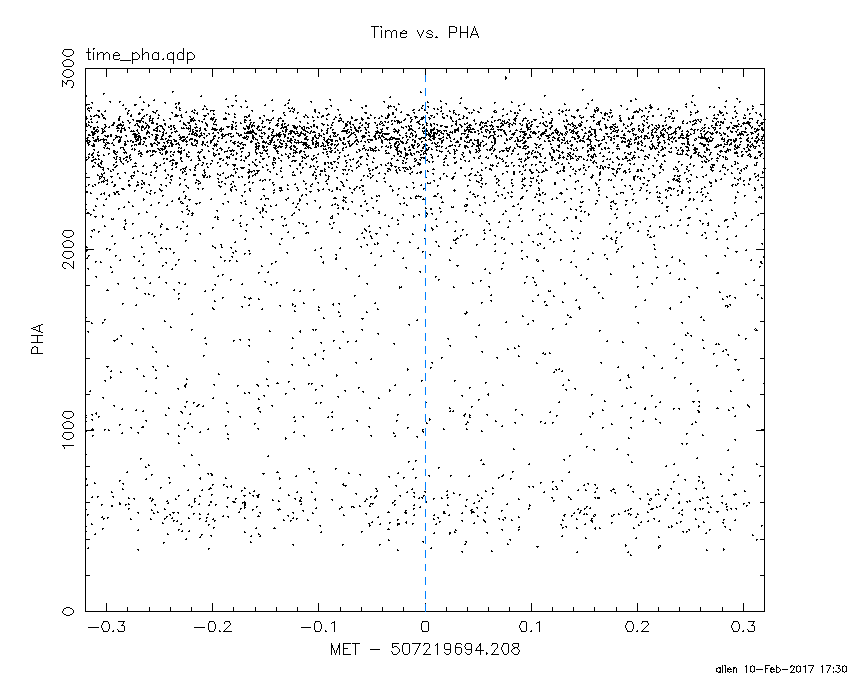
Blue+Cyan dotted lines: Time interval of the scaled map
From 0.000000 to 12.160000
TIME vs. DetID plot around the trigger time

Blue+Cyan dotted lines: Time interval of the scaled map
From 0.000000 to 12.160000
100 us light curve (15-350 keV)
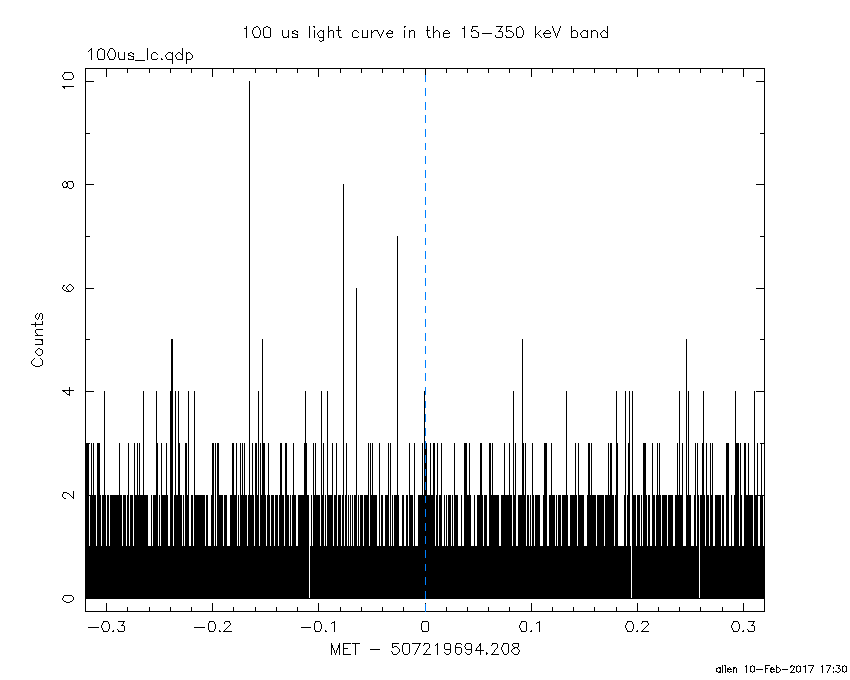
Blue+Cyan dotted lines: Time interval of the scaled map
From 0.000000 to 12.160000
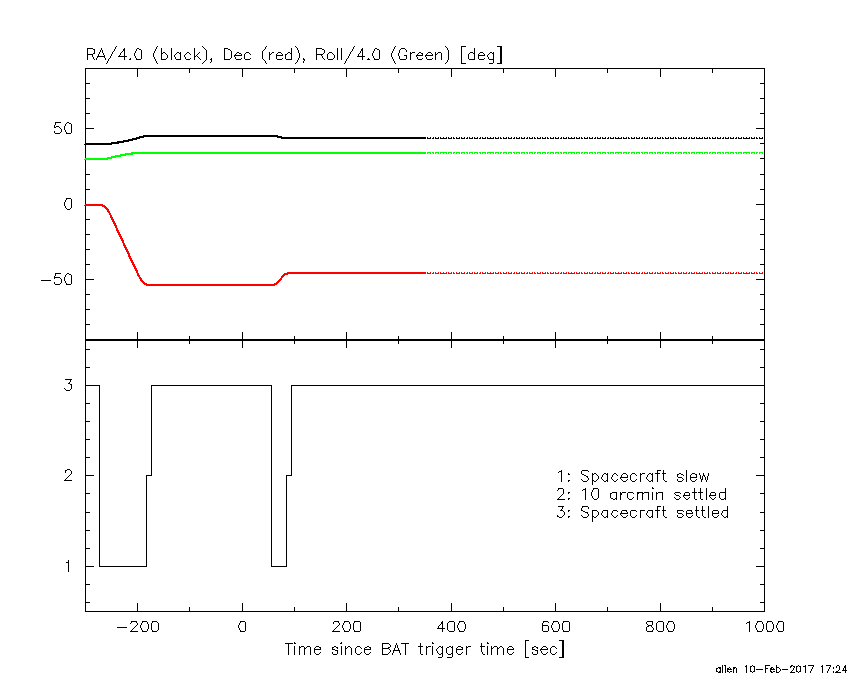
Spacecraft aspect plot
Bright source in the pre-burst/pre-slew/post-slew images
Pre-burst image of 15-350 keV band
Time interval of the image:
-183.107410 -8.496000

# RAcent  DECcent POSerr Theta    Phi  PeakCts   SNR AngSep     Name
#  [deg]    [deg]    ['] [deg]  [deg]                   [']
135.4858 -40.4180    5.2  32.6   49.3   0.5815   2.2    8.4	Vela X-1
170.3239 -60.6009    1.8   9.1  -12.6   1.0609   6.4    1.3	Cen X-3
186.6406 -62.8058    1.1  10.0  -62.1   1.7243  10.8    2.2	GX 301-2
162.1048 -40.9385    3.2  17.5   82.3   0.6596   3.6 ------	UNKNOWN
176.8614 -62.0346    2.3   8.9  -34.7   0.8180   5.0 ------	UNKNOWN
221.0182  -5.4242    2.2  58.2 -175.8   5.7223   5.3 ------	UNKNOWN
214.4004 -66.6161    2.7  21.1  -83.5   0.8660   4.3 ------	UNKNOWN
 57.4035 -60.1383    2.5  57.7  -15.9   3.9008   4.6 ------	UNKNOWN
  3.5234 -75.8790    3.7  50.8  -44.5   2.7895   3.1 ------	UNKNOWN
Pre-slew background subtracted image of 15-350 keV band
Time interval of the image:
-8.496000 57.092590

# RAcent  DECcent POSerr Theta    Phi  PeakCts   SNR AngSep     Name
#  [deg]    [deg]    ['] [deg]  [deg]                   [']
135.5039 -40.6781    5.0  32.5   48.9   0.3685   2.3    7.5	Vela X-1
170.3605 -60.4241    5.6   8.9  -11.9  -0.1934  -2.0   12.0	Cen X-3
186.6046 -62.7381    3.2  10.0  -62.2  -0.3503  -3.6    2.4	GX 301-2
 90.7065 -49.4256    2.6  52.3    9.8   1.4814   4.5 ------	UNKNOWN
185.0504 -33.6621    2.7  19.9  145.9   0.4353   4.2 ------	UNKNOWN
174.3663 -45.8450    1.2   8.4  104.5   0.9143   9.5 ------	UNKNOWN
239.0731 -25.0636    2.2  51.6 -144.7   2.0915   5.3 ------	UNKNOWN
Post-slew image of 15-350 keV band
Time interval of the image:
85.092590 962.916800

# RAcent  DECcent POSerr Theta    Phi  PeakCts   SNR AngSep     Name
#  [deg]    [deg]    ['] [deg]  [deg]                   [']
135.5018 -40.5818    1.7  28.5   39.8   4.6523   6.9    2.0	Vela X-1
170.2895 -60.5938    1.4  14.9  -39.1   4.2727   8.0    1.9	Cen X-3
186.7165 -62.7933    0.9  18.3  -65.0   7.3726  12.4    2.1	GX 301-2
178.1457 -16.1991    2.7  29.8  140.5   3.1066   4.3 ------	UNKNOWN
132.7411 -41.9793    2.4  29.9   35.5   3.0986   4.7 ------	UNKNOWN
211.2886   0.8082    3.6  56.9  179.0  11.6386   3.2 ------	UNKNOWN
213.8398  -2.0669    3.4  55.7 -176.5   8.6911   3.4 ------	UNKNOWN
208.5703 -24.6124    2.7  34.7 -162.8   2.6067   4.3 ------	UNKNOWN
176.7581 -61.9654    2.3  16.2  -50.9   2.7345   5.1 ------	UNKNOWN
201.4760 -43.0197    2.3  19.5 -135.4   2.5070   5.0 ------	UNKNOWN
219.1476  -3.1551    2.8  57.8 -170.6  13.8812   4.1 ------	UNKNOWN
Plot creation:
Fri Feb 10 17:30:50 EST 2017