Estimated redshift from machine learning (Ukwatta et al. 2016) - may take a few minute to calcaulte
Image
Pre-slew 15.0-350.0 keV image (Event data)
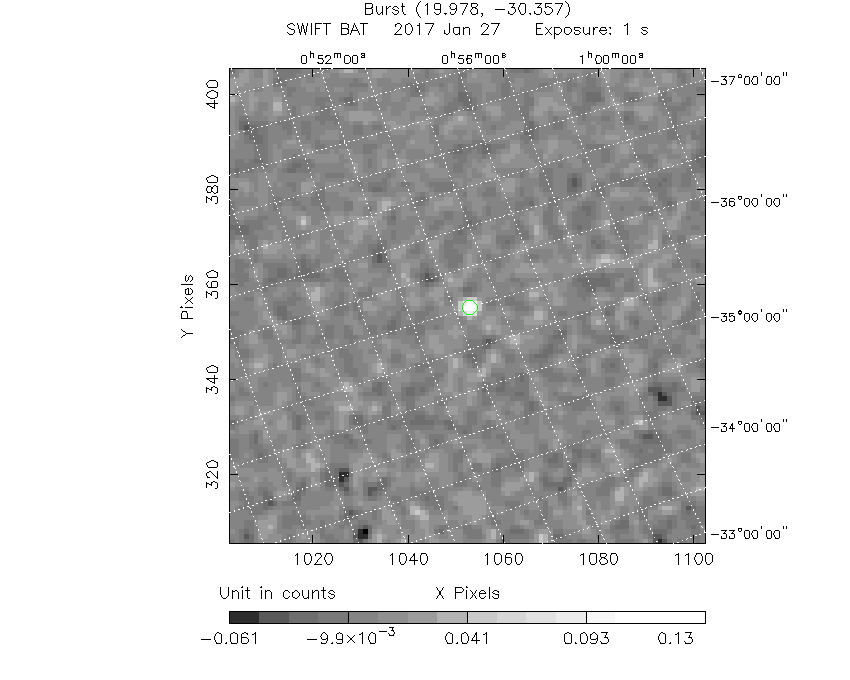
#   RAcent    DECcent   POSerr    Theta     Phi              Peak Cts       SNR   Name
   19.9968   -30.3404   0.0162    23.9758   144.9824         0.1539977     11.869 TRIG_00735331

Foreground time interval of the image:
  0.048   0.640 (delta_t =   0.592 [sec])
Background time interval of the image:
-239.200   0.048 (delta_t = 239.248 [sec])
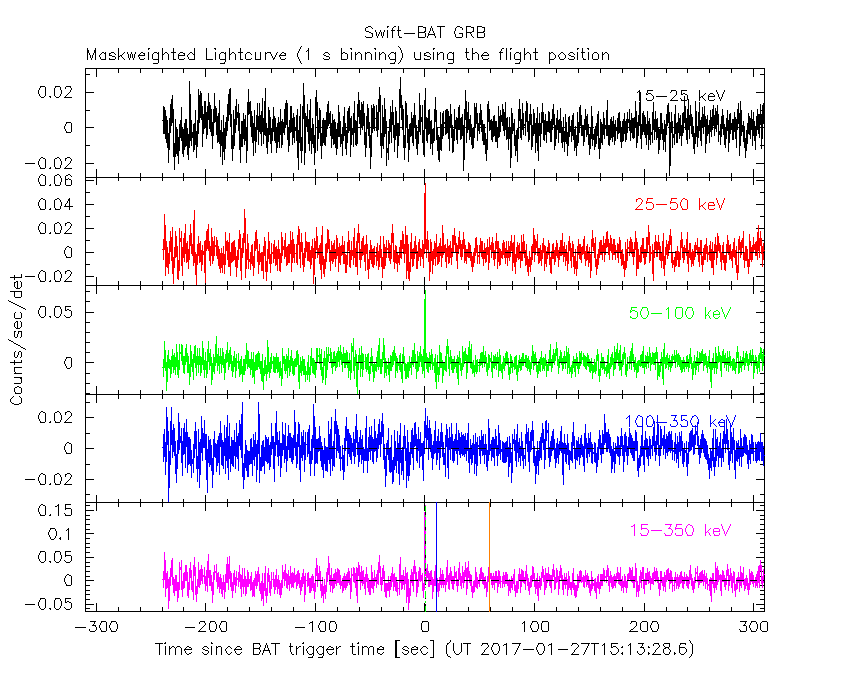
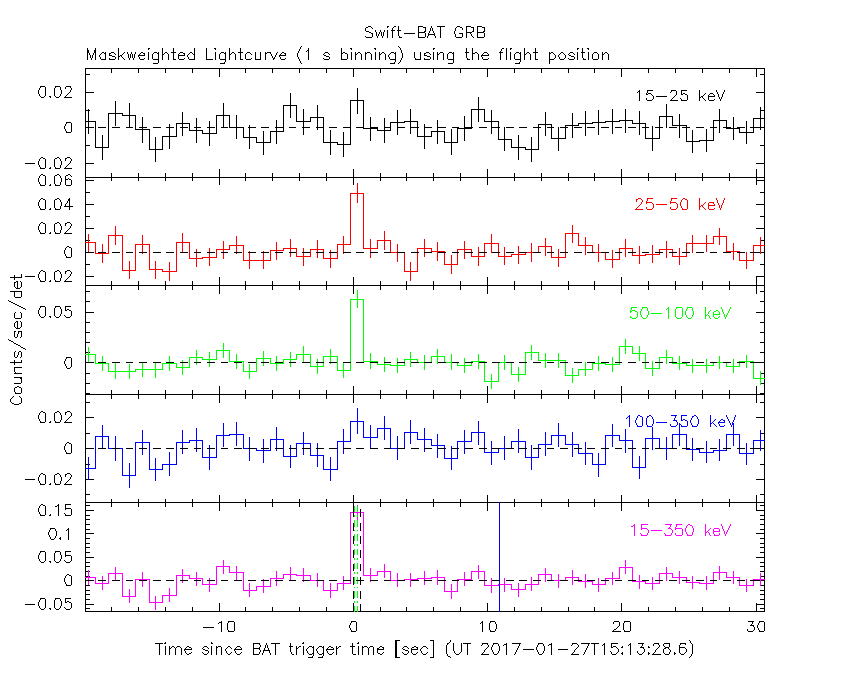
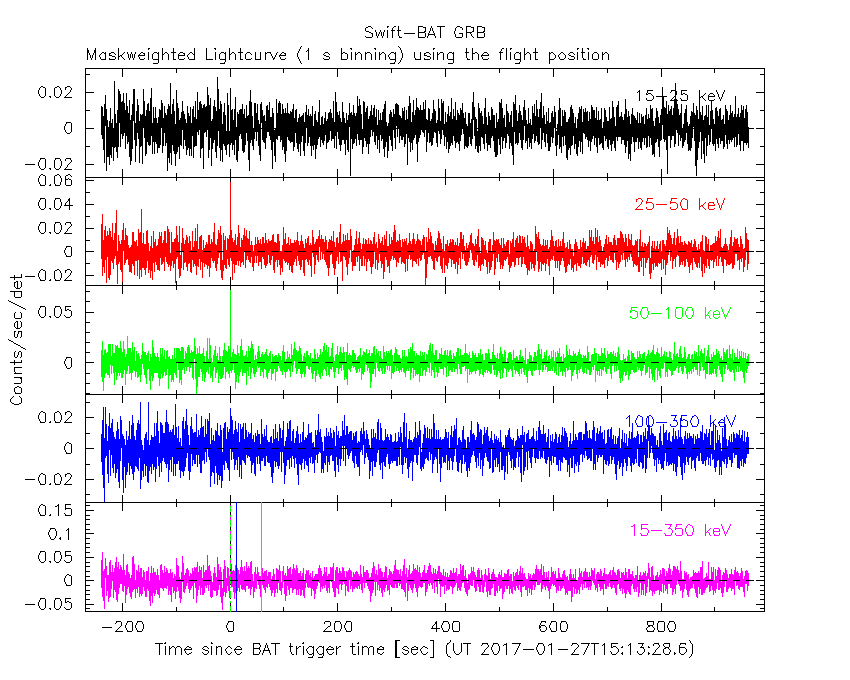
Lightcurves
Notes:
- 1) The mask-weighted light curves are using the flight position.
- 2) Multiple plots of different time binning/intervals are shown to cover all scenarios of short/long GRBs, rate/image triggers, and real/false positives.
- 3) For all the mask-weighted lightcurves, the y-axis units are counts/sec/det where a det is 0.4 x 0.4 = 0.16 sq cm.
- 4) The verticle lines correspond to following: green dotted lines are T50 interval, black dotted lines are T90 interval, blue solid line(s) is a spacecraft slew start time, and orange solid line(s) is a spacecraft slew end time.
- 5) Time of each bin is in the middle of the bin.
1 s binning
From T0-310 s to T0+310 s
From T100_start - 20 s to T100_end + 30 s
Full time interval
64 ms binning
Full time interval

From T100_start to T100_end

From T0-5 sec to T0+5 sec

16 ms binning
From T100_start-5 s to T100_start+5 s

Blue+Cyan dotted lines: Time interval of the scaled map
From 0.000000 to 0.128000
8 ms binning
From T100_start-3 s to T100_start+3 s

Blue+Cyan dotted lines: Time interval of the scaled map
From 0.000000 to 0.128000
2 ms binning
From T100_start-1 s to T100_start+1 s

Blue+Cyan dotted lines: Time interval of the scaled map
From 0.000000 to 0.128000
SN=5 or 10 sec. binning (whichever binning is satisfied first)

SN=5 or 10 sec. binning (T < 200 sec)

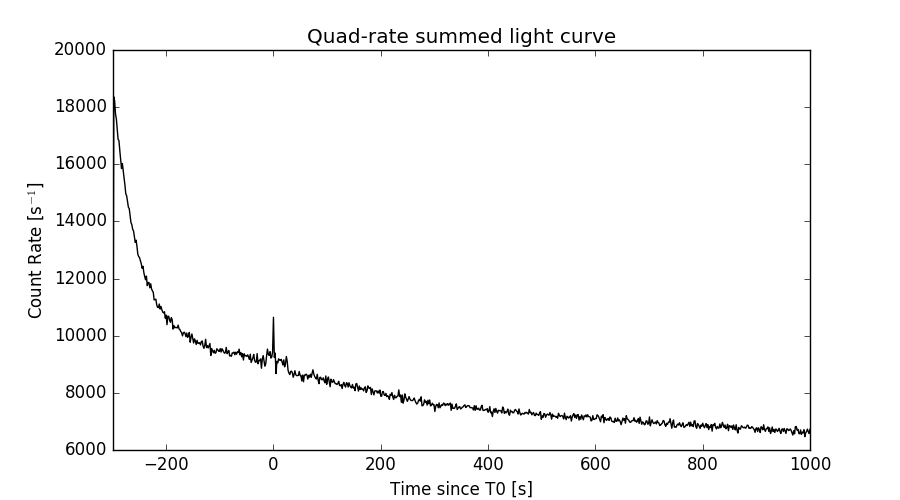
Quad-rate summed light curves (from T0-300s to T0+1000s)
Spectral Evolution

Spectra
Notes:
- 1) The fitting includes the systematic errors.
- 2) When the burst includes telescope slew time periods, the fitting uses an average response file made from multiple 5-s response files through out the slew time plus single time preiod for the non-slew times, and weighted by the total counts in the corresponding time period using addrmf. An average response file is needed becuase a spectral fit using the pre-slew DRM will introduce some errors in both a spectral shape and a normalization if the PHA file contains a lot of the slew/post-slew time interval.
- 3) For fits to more complicated models (e.g. a power-law over a cutoff power-law), the BAT team has decided to require a chi-square improvement of more than 6 for each extra dof.
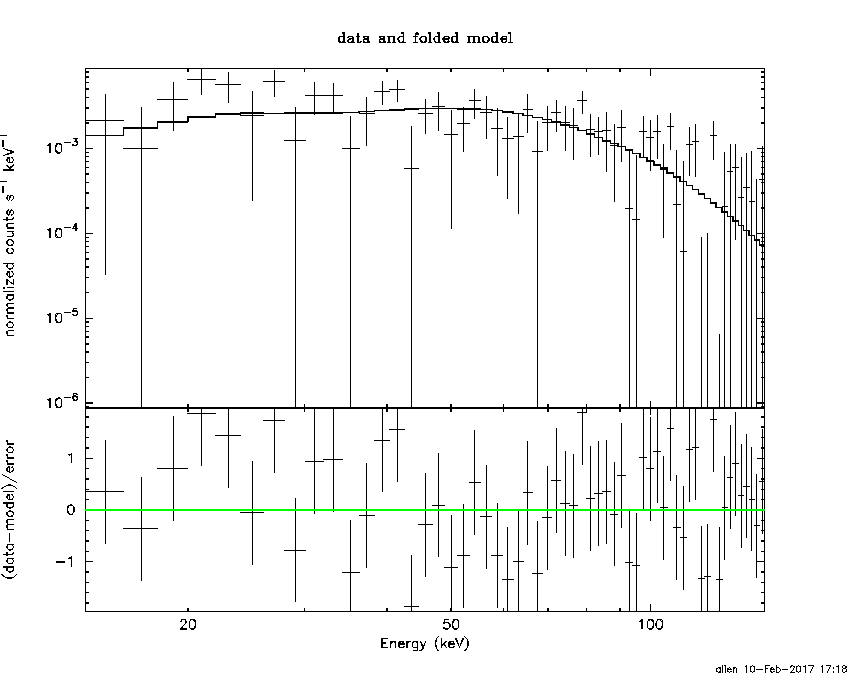
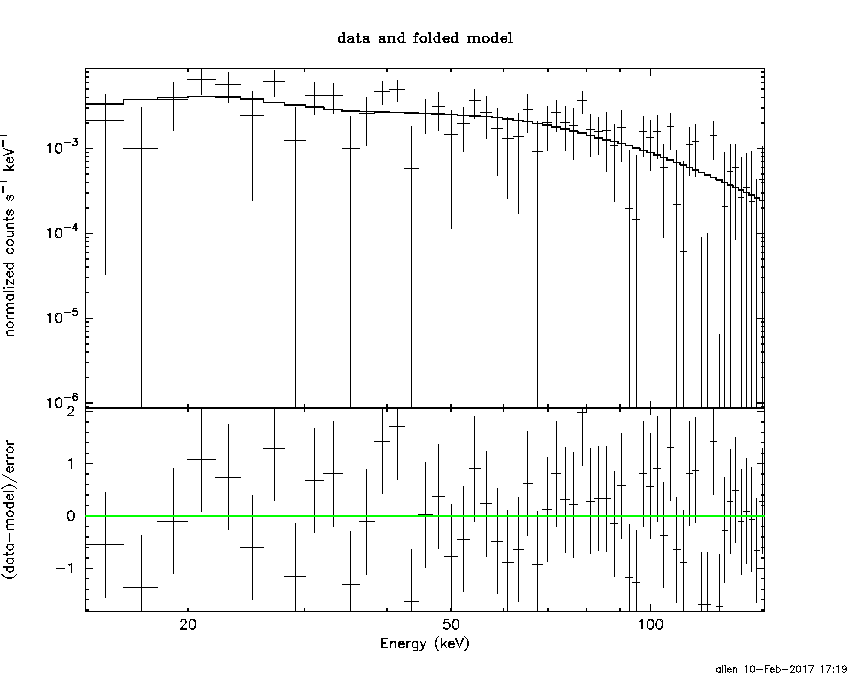
Time averaged spectrum fit using the average DRM
Power-law model

Time interval is from    0.048 sec. to    0.640 sec.

Spectral model in power-law:
------------------------------------------------------------
Parameters  : value       lower 90%   higher 90%
Photon index: 0.885690     ( -0.260389   0.248086 )
Norm@50keV  : 1.55121E-02    ( -0.00225674   0.0022446 )
------------------------------------------------------------
#Fit statistic : Chi-Squared =          48.49 using 59 PHA bins.
# Reduced chi-squared =         0.8507 for     57 degrees of freedom
# Null hypothesis probability =   7.814769e-01

Photon flux (15-150 keV)    in 0.592 sec: 1.78028 ( -0.25807  0.25851 ) ph/cm2/s
Energy fluence (15-150 keV)             : 1.03648e-07 ( -1.64429e-08  1.66205e-08 ) ergs/cm2
Cutoff power-law model

Time interval is from    0.048 sec. to    0.640 sec.
Spectral model in the cutoff power-law:
------------------------------------------------------------
Parameters  : value       lower 90%   higher 90%
Photon index: 0.519825     ( -1.11542   0.489487 )
Epeak [keV] : 230.197      ( -230.197 -230.197 )
Norm@50keV  : 2.26659E-02    ( -0.0090471   0.0440328 )
------------------------------------------------------------
#Fit statistic : Chi-Squared =          48.03 using 59 PHA bins.
# Reduced chi-squared =         0.8577 for     56 degrees of freedom
# Null hypothesis probability =   7.667165e-01

Photon flux (15-150 keV)    in 0.592 sec: 1.75557 ( -0.26635  0.2657 ) ph/cm2/s
Energy fluence (15-150 keV)             : 1.01511e-07 ( -1.77229e-08  1.74932e-08 ) ergs/cm2
Band function

Time interval is from    0.048 sec. to    0.640 sec.


Spectral model in the Band function:
------------------------------------------------------------
Parameters  : value       lower 90%   higher 90%
alpha       :    (     )
beta        :     (     )
Epeak [keV] :       (   )
Norm@50keV   :     (     )
------------------------------------------------------------

Photon flux (15-150 keV)    in  sec:  (    ) ph/cm2/s
Energy fluence (15-150 keV)             : 0 ( 0  0 ) ergs/cm2
Single BB
Spectral model blackbody:
------------------------------------------------------------
Parameters  : value    Lower 90%  Upper 90%
kT [keV]    : 23.6243  (-4.39605  5.93301)
R^2/D10^2   : 5.23984E-02  (-0.025483   0.0460052)
(R is the radius in km and D10 is the distance to the source in units of 10 kpc)
------------------------------------------------------------
#Fit statistic : Chi-Squared =          54.31 using 59 PHA bins.
# Reduced chi-squared =         0.9528 for     57 degrees of freedom
# Null hypothesis probability =   5.765995e-01

Energy  Fluence     90% Error
[keV]   [erg/cm2]   [erg/cm2]
15- 25  3.096e-09   9.765e-10
25- 50  1.705e-08   4.295e-09
50-150  7.099e-08   1.963e-08
15-150  9.113e-08   2.164e-08
Thermal bremsstrahlung (OTTB)
Spectral model: thermal bremsstrahlung
------------------------------------------------------------
Parameters  : value         Lower 90%    Upper 90%
kT [keV]    : 200.000       (-34.241      -200)
Norm        : 6.91194       (-1.05777     1.05777)
------------------------------------------------------------
#Fit statistic : Chi-Squared =          66.21 using 59 PHA bins.
# Reduced chi-squared =          1.162 for     57 degrees of freedom
# Null hypothesis probability =   1.888948e-01

Energy  Fluence     90% Error
[keV]   [erg/cm2]   [erg/cm2]
15- 25  1.019e-08   5.784e-09
25- 50  1.960e-08   1.103e-08
50-150  4.299e-08   2.422e-08
15-150  7.278e-08   4.129e-08
Double BB

Spectral model: bbodyrad<1> + bbodyrad<2>
------------------------------------------------------------
Parameters  : value         Lower 90%    Upper 90%
kT1 [keV]   : 8.05784        (-3.56307      6.4499)
R1^2/D10^2  : 0.703443        (-0.559824      3.83135)
kT2 [keV]   : 34.5790        (-10.4874      61.8037)
R2^2/D10^2  : 1.46385E-02    (-0.0128047   0.0304713)
------------------------------------------------------------
#Fit statistic : Chi-Squared =          46.98 using 59 PHA bins.
# Reduced chi-squared =         0.8541 for     55 degrees of freedom
# Null hypothesis probability =   7.707154e-01

Energy  Fluence     90% Error
[keV]   [erg/cm2]   [erg/cm2]
15- 25  6.395e-09   3.623e-09
25- 50  1.834e-08   9.623e-09
50-150  7.826e-08   4.194e-08
15-150  1.030e-07   5.331e-08
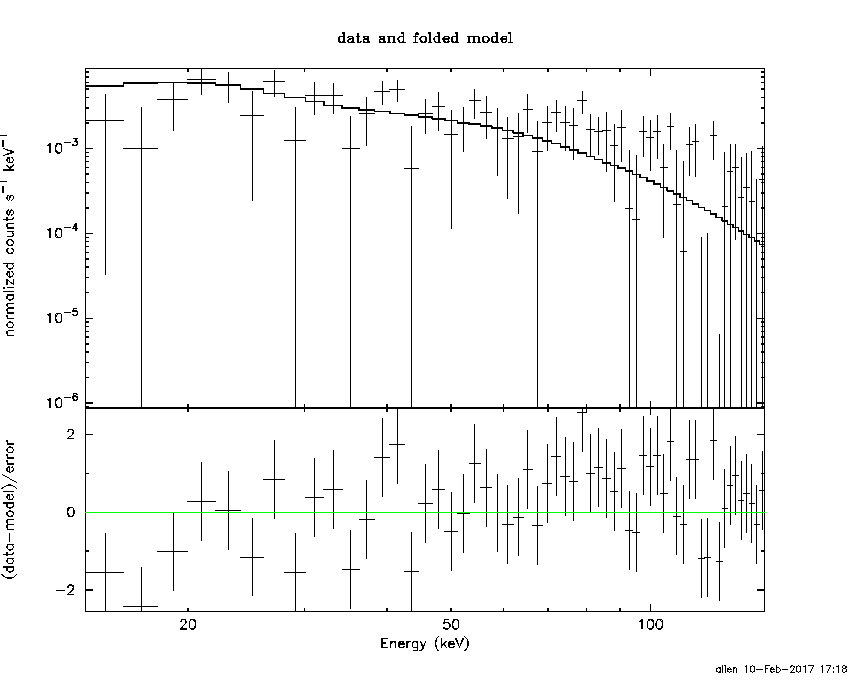
Peak spectrum fit
Power-law model

Time interval is from   -0.156 sec. to    0.844 sec.

Spectral model in power-law:
------------------------------------------------------------
Parameters  : value       lower 90%   higher 90%
Photon index: 0.794507     ( -0.281191   0.263769 )
Norm@50keV  : 9.88203E-03    ( -0.00168132   0.00166625 )
------------------------------------------------------------
#Fit statistic : Chi-Squared =          63.43 using 59 PHA bins.
# Reduced chi-squared =          1.113 for     57 degrees of freedom
# Null hypothesis probability =   2.600729e-01

Photon flux (15-150 keV)    in 1 sec: 1.13596 ( -0.189092  0.1897 ) ph/cm2/s
Energy fluence (15-150 keV)             : 1.15766e-07 ( -2.03437e-08  2.05479e-08 ) ergs/cm2
Cutoff power-law model

Time interval is from   -0.156 sec. to    0.844 sec.
Spectral model in the cutoff power-law:
------------------------------------------------------------
Parameters  : value       lower 90%   higher 90%
Photon index: -0.965177     ( -1.94412   1.34587 )
Epeak [keV] : 95.7994      ( -23.6092 117.239 )
Norm@50keV  : 5.90331E-02    ( -0.0590331   0.293154 )
------------------------------------------------------------
#Fit statistic : Chi-Squared =          58.00 using 59 PHA bins.
# Reduced chi-squared =          1.036 for     56 degrees of freedom
# Null hypothesis probability =   4.012907e-01

Photon flux (15-150 keV)    in 1 sec: 1.06515 ( -0.196332  0.19759 ) ph/cm2/s
Energy fluence (15-150 keV)             : 1.04616e-07 ( -2.20084e-08  2.2661e-08 ) ergs/cm2
Band function

Time interval is from   -0.156 sec. to    0.844 sec.


Spectral model in the Band function:
------------------------------------------------------------
Parameters  : value       lower 90%   higher 90%
alpha       :    (     )
beta        :     (     )
Epeak [keV] :       (   )
Norm@50keV   :     (     )
------------------------------------------------------------

Photon flux (15-150 keV)    in  sec:  (    ) ph/cm2/s
Energy fluence (15-150 keV)             : 0 ( 0  0 ) ergs/cm2
Single BB
Spectral model blackbody:
------------------------------------------------------------
Parameters  : value    Lower 90%  Upper 90%
kT [keV]    : 22.7328  (-3.95089  5.41261)
R^2/D10^2   : 3.97727E-02  (-0.0190382   0.0323419)
(R is the radius in km and D10 is the distance to the source in units of 10 kpc)
------------------------------------------------------------
#Fit statistic : Chi-Squared =          58.21 using 59 PHA bins.
# Reduced chi-squared =          1.021 for     57 degrees of freedom
# Null hypothesis probability =   4.305434e-01

Energy  Fluence     90% Error
[keV]   [erg/cm2]   [erg/cm2]
15- 25  3.746e-09   1.316e-09
25- 50  2.019e-08   5.465e-09
50-150  7.796e-08   2.132e-08
15-150  1.019e-07   2.753e-08
Thermal bremsstrahlung (OTTB)

Spectral model: thermal bremsstrahlung
------------------------------------------------------------
Parameters  : value         Lower 90%    Upper 90%
kT [keV]    : 200.000       (-36.5117      -200)
Norm        : 4.32180       (-0.781861     0.781861)
------------------------------------------------------------
#Fit statistic : Chi-Squared =          82.48 using 59 PHA bins.
# Reduced chi-squared =          1.447 for     57 degrees of freedom
# Null hypothesis probability =   1.528060e-02

Energy  Fluence     90% Error
[keV]   [erg/cm2]   [erg/cm2]
15- 25  1.076e-08   6.345e-09
25- 50  2.070e-08   1.198e-08
50-150  4.539e-08   2.596e-08
15-150  7.685e-08   4.419e-08
Double BB

Spectral model: bbodyrad<1> + bbodyrad<2>
------------------------------------------------------------
Parameters  : value         Lower 90%    Upper 90%
kT1 [keV]   : 11.0626        (-11.2699      -11.2699)
R1^2/D10^2  : 6.12397E-02        (-0.0583388      -0.0583388)
kT2 [keV]   : 25.4892        (-25.637      -25.637)
R2^2/D10^2  : 2.51216E-02    (-0.0241106   0.0460507)
------------------------------------------------------------
#Fit statistic : Chi-Squared =          57.96 using 59 PHA bins.
# Reduced chi-squared =          1.054 for     55 degrees of freedom
# Null hypothesis probability =   3.666178e-01

Energy  Fluence     90% Error
[keV]   [erg/cm2]   [erg/cm2]
15- 25  4.374e-09   4.888e-09
25- 50  2.054e-08   2.252e-08
50-150  8.032e-08   1.327e-07
15-150  1.052e-07   1.134e-07
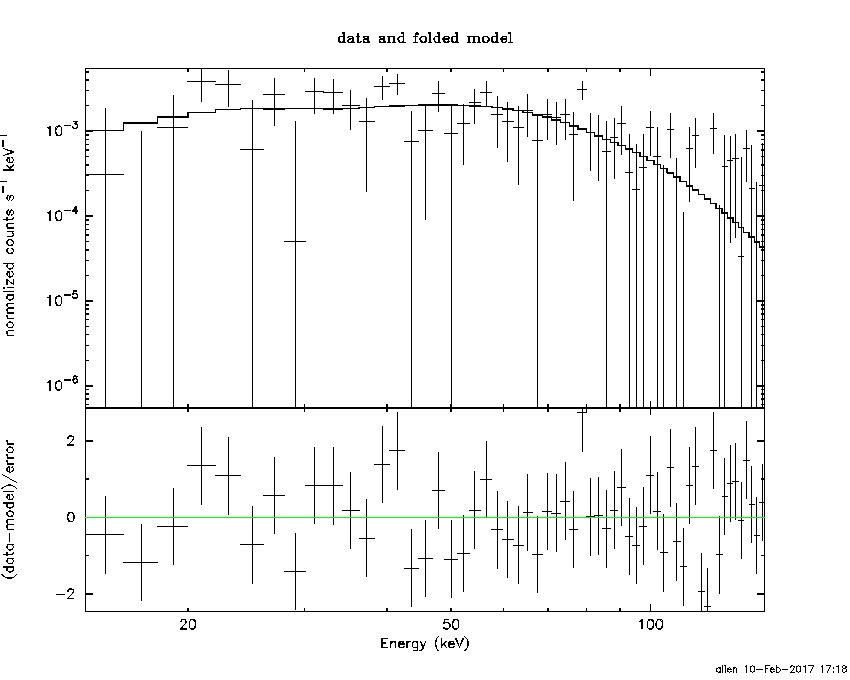
Pre-slew spectrum (Pre-slew PHA with pre-slew DRM)
Power-law model
Spectral model in power-law:
------------------------------------------------------------
Parameters  : value       lower 90%   higher 90%
Photon index: 0.885690     ( -0.260389   0.248086 )
Norm@50keV  : 1.55121E-02    ( -0.00225674   0.0022446 )
------------------------------------------------------------
#Fit statistic : Chi-Squared =          48.49 using 59 PHA bins.
# Reduced chi-squared =         0.8507 for     57 degrees of freedom
# Null hypothesis probability =   7.814769e-01

Photon flux (15-150 keV)    in 0.592 sec: 1.78031 ( -0.258071  0.258498 ) ph/cm2/s
Energy fluence (15-150 keV)             : 1.03638e-07 ( -1.6441e-08  1.66264e-08 ) ergs/cm2
Cutoff power-law model

Spectral model in the cutoff power-law:
------------------------------------------------------------
Parameters  : value       lower 90%   higher 90%
Photon index: 0.519824     ( -1.11542   0.489487 )
Epeak [keV] : 230.196      ( -230.197 -230.197 )
Norm@50keV  : 2.26659E-02    ( -0.0090471   0.0440328 )
------------------------------------------------------------
#Fit statistic : Chi-Squared =          48.03 using 59 PHA bins.
# Reduced chi-squared =         0.8577 for     56 degrees of freedom
# Null hypothesis probability =   7.667165e-01

Photon flux (15-150 keV)    in 0.592 sec: 1.75553 ( -0.26631  0.26566 ) ph/cm2/s
Energy fluence (15-150 keV)             : 1.01559e-07 ( -1.7731e-08  1.75143e-08 ) ergs/cm2
Band function

Spectral model in the Band function:
------------------------------------------------------------
Parameters  : value       lower 90%   higher 90%
alpha       :    (     )
beta        :     (     )
Epeak [keV] :       (   )
Norm@50keV   :     (     )
------------------------------------------------------------

Photon flux (15-150 keV)    in  sec:  (    ) ph/cm2/s
Energy fluence (15-150 keV)             : 0 ( 0  0 ) ergs/cm2
S(25-50 keV) vs. S(50-100 keV) plot
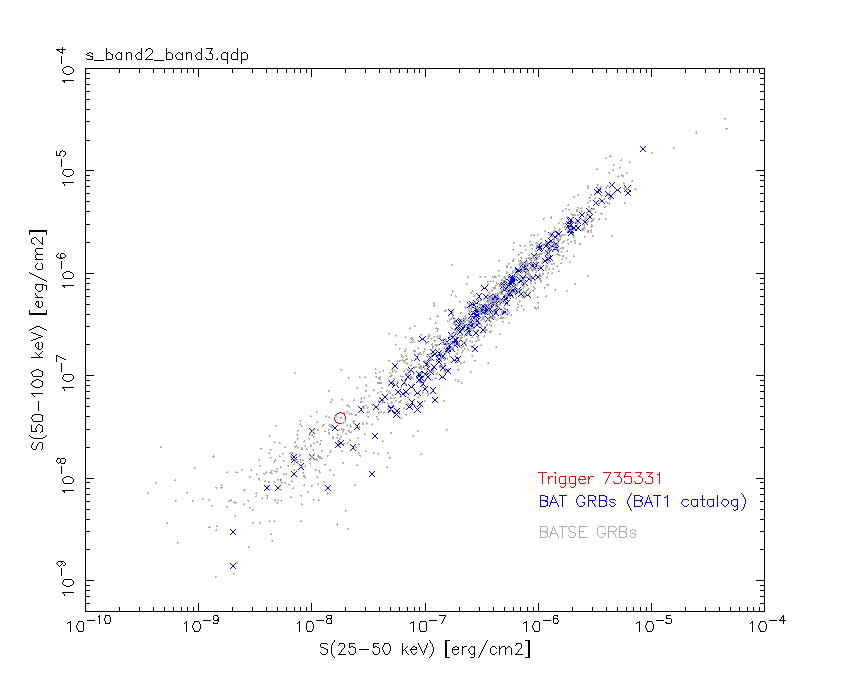
S(25-50 keV)  = 1.78e-08
S(50-100 keV) = 3.85e-08
T90 vs. Hardness ratio plot

T90                                   = 0.512000024318695 sec.
Hardness ratio (energy fluence ratio) = 2.16292
Color vs. Color plot
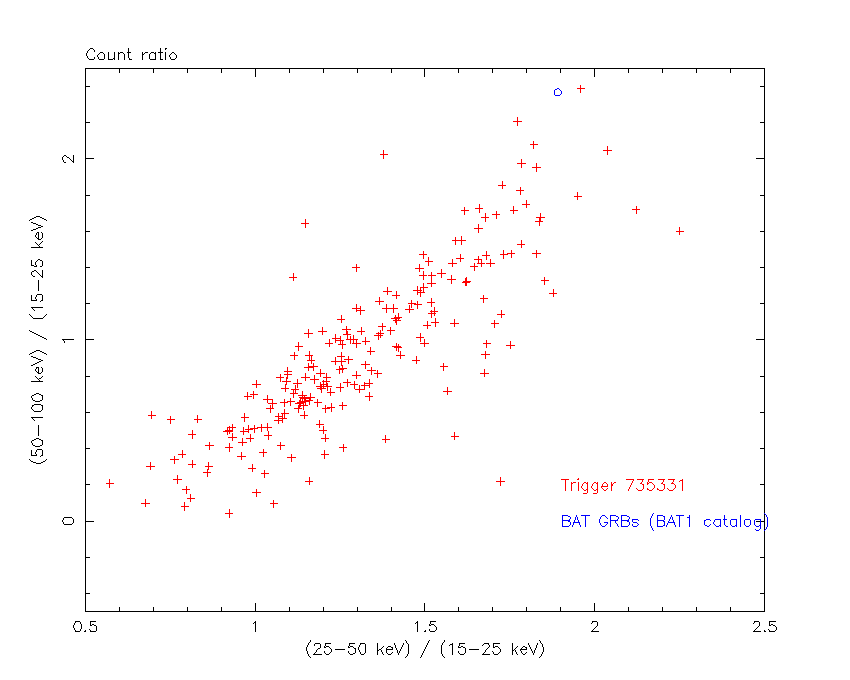
Count Ratio  (25-50 keV) / (15-25 keV) = 1.89084
Count Ratio (50-100 keV) / (15-25 keV) = 2.3685
Mask shadow pattern

IMX = -3.642177927338491E-01, IMY = -2.551944129191230E-01
TIME vs. PHA plot around the trigger time
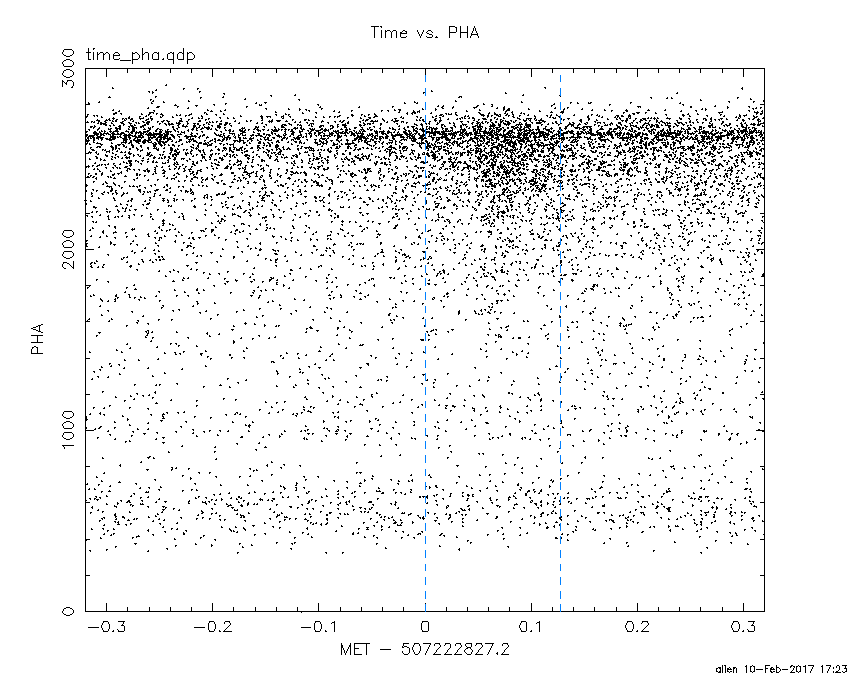
Blue+Cyan dotted lines: Time interval of the scaled map
From 0.000000 to 0.128000
TIME vs. DetID plot around the trigger time
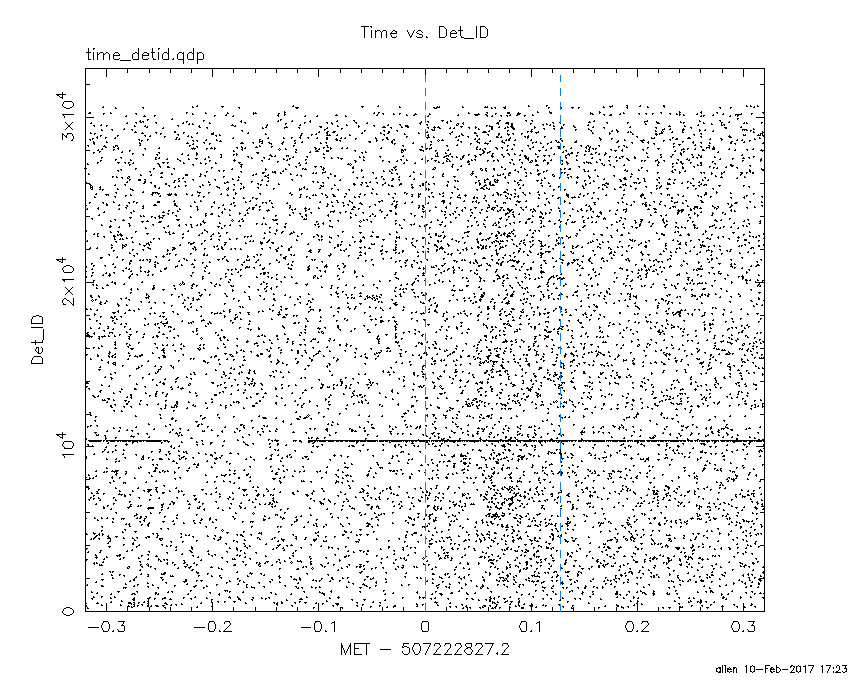
Blue+Cyan dotted lines: Time interval of the scaled map
From 0.000000 to 0.128000
100 us light curve (15-350 keV)

Blue+Cyan dotted lines: Time interval of the scaled map
From 0.000000 to 0.128000
Spacecraft aspect plot

Bright source in the pre-burst/pre-slew/post-slew images
Pre-burst image of 15-350 keV band
Time interval of the image:
-239.200000 0.048000

# RAcent  DECcent POSerr Theta    Phi  PeakCts   SNR AngSep     Name
#  [deg]    [deg]    ['] [deg]  [deg]                   [']
344.9402  40.1588    2.3  56.9   -2.0   6.7419   5.1 ------	UNKNOWN
352.6609   5.6798    3.3  21.9   -8.1   1.0363   3.5  556.2	UNKNOWN
342.3449  11.0188    2.0  31.3  -23.1   1.7785   5.9 ------	UNKNOWN
324.5088 -65.5491    2.7  55.9 -151.4   6.5375   4.3 ------	UNKNOWN
Pre-slew background subtracted image of 15-350 keV band
Time interval of the image:
0.048000 0.640000

# RAcent  DECcent POSerr Theta    Phi  PeakCts   SNR AngSep     Name
#  [deg]    [deg]    ['] [deg]  [deg]                   [']
 19.9968 -30.3404    1.0  24.0  145.0   0.1540  11.9 ------	UNKNOWN
354.7883  16.8922    2.0  32.3    2.4   0.0729   5.8 ------	UNKNOWN
320.6991   1.2972    2.1  42.1  -59.0   0.1708   5.6 ------	UNKNOWN
Post-slew image of 15-350 keV band
Time interval of the image:
58.500600 962.942500

# RAcent  DECcent POSerr Theta    Phi  PeakCts   SNR AngSep     Name
#  [deg]    [deg]    ['] [deg]  [deg]                   [']
 32.9439  -2.3326    2.4  30.6   33.1   3.4960   4.7 ------	UNKNOWN
 55.7125 -76.2526    2.8  48.9  176.3   6.4551   4.1 ------	UNKNOWN
307.3244 -71.2405    2.8  55.9 -151.4  14.5614   4.1 ------	UNKNOWN
338.4685  -9.8972    2.7  43.6  -64.1  13.7698   4.2 ------	UNKNOWN
342.9805   7.8117    3.8  52.1  -42.2  10.5510   3.0 ------	UNKNOWN
324.4788 -47.2608    3.6  45.3 -121.3   9.2070   3.2 ------	UNKNOWN
Plot creation:
Fri Feb 10 17:24:16 EST 2017