Special notes of this burst
Image
Pre-slew 15.0-350.0 keV image (Event data)

#   RAcent    DECcent   POSerr    Theta     Phi              Peak Cts       SNR   Name
  262.1579    -0.0577   0.0054    16.4616   146.7014         2.4665659     35.703 TRIG_00736843

Foreground time interval of the image:
 -1.424   9.781 (delta_t =  11.205 [sec])
Background time interval of the image:
-60.520  -1.424 (delta_t =  59.096 [sec])
Lightcurves
Notes:
- 1) The mask-weighted light curves are using the flight position.
- 2) Multiple plots of different time binning/intervals are shown to cover all scenarios of short/long GRBs, rate/image triggers, and real/false positives.
- 3) For all the mask-weighted lightcurves, the y-axis units are counts/sec/det where a det is 0.4 x 0.4 = 0.16 sq cm.
- 4) The verticle lines correspond to following: green dotted lines are T50 interval, black dotted lines are T90 interval, blue solid line(s) is a spacecraft slew start time, and orange solid line(s) is a spacecraft slew end time.
- 5) Time of each bin is in the middle of the bin.
1 s binning
From T0-310 s to T0+310 s
From T100_start - 20 s to T100_end + 30 s

Full time interval

64 ms binning
Full time interval
From T100_start to T100_end

From T0-5 sec to T0+5 sec

16 ms binning
From T100_start-5 s to T100_start+5 s

Blue+Cyan dotted lines: Time interval of the scaled map
From 0.000000 to 0.064000
8 ms binning
From T100_start-3 s to T100_start+3 s

Blue+Cyan dotted lines: Time interval of the scaled map
From 0.000000 to 0.064000
2 ms binning
From T100_start-1 s to T100_start+1 s
Blue+Cyan dotted lines: Time interval of the scaled map
From 0.000000 to 0.064000
SN=5 or 10 sec. binning (whichever binning is satisfied first)

SN=5 or 10 sec. binning (T < 200 sec)
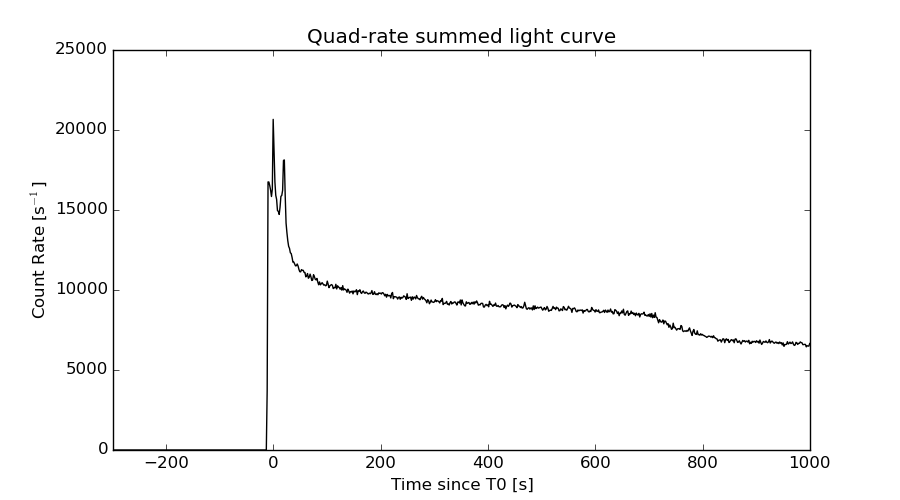
Quad-rate summed light curves (from T0-300s to T0+1000s)
Spectral Evolution

Spectra
Notes:
- 1) The fitting includes the systematic errors.
- 2) When the burst includes telescope slew time periods, the fitting uses an average response file made from multiple 5-s response files through out the slew time plus single time preiod for the non-slew times, and weighted by the total counts in the corresponding time period using addrmf. An average response file is needed becuase a spectral fit using the pre-slew DRM will introduce some errors in both a spectral shape and a normalization if the PHA file contains a lot of the slew/post-slew time interval.
- 3) For fits to more complicated models (e.g. a power-law over a cutoff power-law), the BAT team has decided to require a chi-square improvement of more than 6 for each extra dof.
Time averaged spectrum fit using the average DRM
Power-law model

Time interval is from   -1.424 sec. to   46.396 sec.

Spectral model in power-law:
------------------------------------------------------------
Parameters  : value       lower 90%   higher 90%
Photon index: 1.85199     ( -0.0646087   0.0650872 )
Norm@50keV  : 8.59925E-03    ( -0.000290248   0.000289047 )
------------------------------------------------------------
#Fit statistic : Chi-Squared =          39.11 using 59 PHA bins.
# Reduced chi-squared =         0.6861 for     57 degrees of freedom
# Null hypothesis probability =   9.662173e-01

Photon flux (15-150 keV)    in 47.82 sec: 1.20976 ( -0.04103  0.04118 ) ph/cm2/s
Energy fluence (15-150 keV)             : 3.78155e-06 ( -1.28213e-07  1.28837e-07 ) ergs/cm2
Cutoff power-law model

Time interval is from   -1.424 sec. to   46.396 sec.
Spectral model in the cutoff power-law:
------------------------------------------------------------
Parameters  : value       lower 90%   higher 90%
Photon index: 1.63286     ( -0.269799   0.130203 )
Epeak [keV] : 79.5191      ( -21.1259 -79.5196 )
Norm@50keV  : 1.11393E-02    ( -0.00266357   0.00408512 )
------------------------------------------------------------
#Fit statistic : Chi-Squared =          36.94 using 59 PHA bins.
# Reduced chi-squared =         0.6596 for     56 degrees of freedom
# Null hypothesis probability =   9.769307e-01

Photon flux (15-150 keV)    in 47.82 sec: 1.18816 ( -0.04758  0.04772 ) ph/cm2/s
Energy fluence (15-150 keV)             : 3.69105e-06 ( -1.64015e-07  1.63908e-07 ) ergs/cm2
Band function

Time interval is from   -1.424 sec. to   46.396 sec.


Spectral model in the Band function:
------------------------------------------------------------
Parameters  : value       lower 90%   higher 90%
alpha       :    (     )
beta        :     (     )
Epeak [keV] :       (   )
Norm@50keV   :     (     )
------------------------------------------------------------

Photon flux (15-150 keV)    in  sec:  (    ) ph/cm2/s
Energy fluence (15-150 keV)             : 0 ( 0  0 ) ergs/cm2
Single BB
Spectral model blackbody:
------------------------------------------------------------
Parameters  : value    Lower 90%  Upper 90%
kT [keV]    : 12.1626  (  )
R^2/D10^2   : 0.254558  (   )
(R is the radius in km and D10 is the distance to the source in units of 10 kpc)
------------------------------------------------------------
#Fit statistic : Chi-Squared =         229.50 using 59 PHA bins.
# Reduced chi-squared =         4.0262 for     57 degrees of freedom
# Null hypothesis probability =   1.470429e-22

Energy  Fluence     90% Error
[keV]   [erg/cm2]   [erg/cm2]
15- 25  3.812e-07   2.348e-08
25- 50  1.219e-06   4.208e-08
50-150  1.094e-06   7.484e-08
15-150  2.694e-06   9.612e-08
Thermal bremsstrahlung (OTTB)
Spectral model: thermal bremsstrahlung
------------------------------------------------------------
Parameters  : value         Lower 90%    Upper 90%
kT [keV]    : 97.1216       (-11.8612      14.7769)
Norm        : 5.23565       (-0.268832     0.291747)
------------------------------------------------------------
#Fit statistic : Chi-Squared =          40.84 using 59 PHA bins.
# Reduced chi-squared =         0.7165 for     57 degrees of freedom
# Null hypothesis probability =   9.476056e-01

Energy  Fluence     90% Error
[keV]   [erg/cm2]   [erg/cm2]
15- 25  6.543e-07   4.471e-08
25- 50  1.125e-06   4.973e-08
50-150  1.792e-06   4.431e-07
15-150  3.571e-06   4.581e-07
Double BB

Spectral model: bbodyrad<1> + bbodyrad<2>
------------------------------------------------------------
Parameters  : value         Lower 90%    Upper 90%
kT1 [keV]   : 7.03526        (-0.761858      0.779736)
R1^2/D10^2  : 1.44609        (-0.43422      0.721309)
kT2 [keV]   : 25.2061        (-3.60907      5.19451)
R2^2/D10^2  : 1.24652E-02    (-0.00606929   0.0100094)
------------------------------------------------------------
#Fit statistic : Chi-Squared =          41.27 using 59 PHA bins.
# Reduced chi-squared =         0.7503 for     55 degrees of freedom
# Null hypothesis probability =   9.150642e-01

Energy  Fluence     90% Error
[keV]   [erg/cm2]   [erg/cm2]
15- 25  6.182e-07   6.575e-08
25- 50  1.137e-06   8.536e-08
50-150  1.885e-06   3.376e-07
15-150  3.641e-06   3.486e-07
Peak spectrum fit
Power-law model

Time interval is from   -0.296 sec. to    0.704 sec.

Spectral model in power-law:
------------------------------------------------------------
Parameters  : value       lower 90%   higher 90%
Photon index: 1.48921     ( -0.114568   0.115579 )
Norm@50keV  : 3.44780E-02    ( -0.00225542   0.00224376 )
------------------------------------------------------------
#Fit statistic : Chi-Squared =          42.67 using 59 PHA bins.
# Reduced chi-squared =         0.7486 for     57 degrees of freedom
# Null hypothesis probability =   9.208522e-01

Photon flux (15-150 keV)    in 1 sec: 4.29194 ( -0.27189  0.27211 ) ph/cm2/s
Energy fluence (15-150 keV)             : 3.27703e-07 ( -2.38665e-08  2.41085e-08 ) ergs/cm2
Cutoff power-law model

Time interval is from   -0.296 sec. to    0.704 sec.
Spectral model in the cutoff power-law:
------------------------------------------------------------
Parameters  : value       lower 90%   higher 90%
Photon index: 1.27946     ( -0.479661   0.270227 )
Epeak [keV] : 167.559      ( -167.56 -167.56 )
Norm@50keV  : 4.42049E-02    ( -0.0115964   0.0329083 )
------------------------------------------------------------
#Fit statistic : Chi-Squared =          42.01 using 59 PHA bins.
# Reduced chi-squared =         0.7501 for     56 degrees of freedom
# Null hypothesis probability =   9.173627e-01

Photon flux (15-150 keV)    in 1 sec: 4.24465 ( -0.28955  0.28857 ) ph/cm2/s
Energy fluence (15-150 keV)             : 3.21048e-07 ( -2.77764e-08  2.74738e-08 ) ergs/cm2
Band function

Time interval is from   -0.296 sec. to    0.704 sec.


Spectral model in the Band function:
------------------------------------------------------------
Parameters  : value       lower 90%   higher 90%
alpha       :    (     )
beta        :     (     )
Epeak [keV] :       (   )
Norm@50keV   :     (     )
------------------------------------------------------------

Photon flux (15-150 keV)    in  sec:  (    ) ph/cm2/s
Energy fluence (15-150 keV)             : 0 ( 0  0 ) ergs/cm2
Single BB

Spectral model blackbody:
------------------------------------------------------------
Parameters  : value    Lower 90%  Upper 90%
kT [keV]    : 14.1145  (-1.15641  1.2944)
R^2/D10^2   : 0.590704  (-0.155982   0.207498)
(R is the radius in km and D10 is the distance to the source in units of 10 kpc)
------------------------------------------------------------
#Fit statistic : Chi-Squared =          93.81 using 59 PHA bins.
# Reduced chi-squared =          1.646 for     57 degrees of freedom
# Null hypothesis probability =   1.539141e-03

Energy  Fluence     90% Error
[keV]   [erg/cm2]   [erg/cm2]
15- 25  2.484e-08   3.175e-09
25- 50  9.313e-08   7.115e-09
50-150  1.227e-07   1.700e-08
15-150  2.406e-07   2.085e-08
Thermal bremsstrahlung (OTTB)

Spectral model: thermal bremsstrahlung
------------------------------------------------------------
Parameters  : value         Lower 90%    Upper 90%
kT [keV]    : 200.000       (-41.3088      -200)
Norm        : 17.4712       (-1.09209     1.09209)
------------------------------------------------------------
#Fit statistic : Chi-Squared =          42.76 using 59 PHA bins.
# Reduced chi-squared =         0.7502 for     57 degrees of freedom
# Null hypothesis probability =   9.192757e-01

Energy  Fluence     90% Error
[keV]   [erg/cm2]   [erg/cm2]
15- 25  4.360e-08   3.230e-09
25- 50  8.388e-08   6.730e-09
50-150  1.840e-07   4.794e-08
15-150  3.114e-07   5.050e-08
Double BB

Spectral model: bbodyrad<1> + bbodyrad<2>
------------------------------------------------------------
Parameters  : value         Lower 90%    Upper 90%
kT1 [keV]   : 8.27344        (-1.66225      1.69891)
R1^2/D10^2  : 2.69443        (-1.15435      2.68806)
kT2 [keV]   : 33.0862        (-9.104      24.0369)
R2^2/D10^2  : 2.36619E-02    (-0.0185982   0.0488998)
------------------------------------------------------------
#Fit statistic : Chi-Squared =          42.42 using 59 PHA bins.
# Reduced chi-squared =         0.7713 for     55 degrees of freedom
# Null hypothesis probability =   8.926297e-01

Energy  Fluence     90% Error
[keV]   [erg/cm2]   [erg/cm2]
15- 25  3.796e-08   8.150e-09
25- 50  8.772e-08   1.755e-08
50-150  1.990e-07   8.938e-08
15-150  3.247e-07   1.033e-07
Pre-slew spectrum (Pre-slew PHA with pre-slew DRM)
Power-law model

Spectral model in power-law:
------------------------------------------------------------
Parameters  : value       lower 90%   higher 90%
Photon index: 1.68386     ( -0.0807113   0.0813197 )
Norm@50keV  : 1.40081E-02    ( -0.000626293   0.000623351 )
------------------------------------------------------------
#Fit statistic : Chi-Squared =          55.83 using 59 PHA bins.
# Reduced chi-squared =         0.9795 for     57 degrees of freedom
# Null hypothesis probability =   5.188880e-01

Photon flux (15-150 keV)    in 11.2 sec: 1.85006 ( -0.0800034  0.0801406 ) ph/cm2/s
Energy fluence (15-150 keV)             : 1.45456e-06 ( -6.88951e-08  6.93581e-08 ) ergs/cm2
Cutoff power-law model

Spectral model in the cutoff power-law:
------------------------------------------------------------
Parameters  : value       lower 90%   higher 90%
Photon index: 1.42080     ( -0.33202   0.293556 )
Epeak [keV] : 104.485      ( -34.3974 -104.486 )
Norm@50keV  : 1.91866E-02    ( -0.00545185   0.00912852 )
------------------------------------------------------------
#Fit statistic : Chi-Squared =          53.71 using 59 PHA bins.
# Reduced chi-squared =         0.9591 for     56 degrees of freedom
# Null hypothesis probability =   5.620319e-01

Photon flux (15-150 keV)    in 11.2 sec: 1.81800 ( -0.08786  0.08787 ) ph/cm2/s
Energy fluence (15-150 keV)             : 1.41475e-06 ( -8.3216e-08  8.32496e-08 ) ergs/cm2
Band function

Spectral model in the Band function:
------------------------------------------------------------
Parameters  : value       lower 90%   higher 90%
alpha       :    (     )
beta        :     (     )
Epeak [keV] :       (   )
Norm@50keV   :     (     )
------------------------------------------------------------

Photon flux (15-150 keV)    in  sec:  (    ) ph/cm2/s
Energy fluence (15-150 keV)             : 0 ( 0  0 ) ergs/cm2
S(25-50 keV) vs. S(50-100 keV) plot

S(25-50 keV)  = 1.09e-06
S(50-100 keV) = 1.20e-06
T90 vs. Hardness ratio plot

T90                                   = 26.1279999613762 sec.
Hardness ratio (energy fluence ratio) = 1.10092
Color vs. Color plot

Count Ratio  (25-50 keV) / (15-25 keV) = 1.15065
Count Ratio (50-100 keV) / (15-25 keV) = 0.62633
Mask shadow pattern

IMX = -2.469723229948882E-01, IMY = -1.622217512066765E-01
TIME vs. PHA plot around the trigger time
Blue+Cyan dotted lines: Time interval of the scaled map
From 0.000000 to 0.064000
TIME vs. DetID plot around the trigger time

Blue+Cyan dotted lines: Time interval of the scaled map
From 0.000000 to 0.064000
100 us light curve (15-350 keV)
Blue+Cyan dotted lines: Time interval of the scaled map
From 0.000000 to 0.064000
Spacecraft aspect plot

Bright source in the pre-burst/pre-slew/post-slew images
Pre-burst image of 15-350 keV band
Time interval of the image:
-60.520000 -1.424000

# RAcent  DECcent POSerr Theta    Phi  PeakCts   SNR AngSep     Name
#  [deg]    [deg]    ['] [deg]  [deg]                   [']
244.9284 -15.6447    1.5  23.4   77.3   0.5535   7.6    3.0	Sco X-1
254.3691  35.4592    7.1  52.4  156.9  -0.5189  -1.7    8.2	Her X-1
255.9793 -37.8282    1.7  25.6   16.7   0.4474   6.8    1.0	4U 1700-377
256.5290 -36.5898  131.8  24.3   17.3   0.0056   0.1   11.0	GX 349+2
262.9656 -24.8904    5.8  11.5   21.5   0.1202   2.0    9.0	GX 1+4
264.9323 -44.4350    4.5  29.6   -1.8  -0.1773  -2.6    8.2	4U 1735-44
268.3999  -1.3527    7.0  13.7  169.0   0.1003   1.6    6.3	SW J1753.5-0127
270.4601 -25.0029   13.7  10.1  -14.7   0.0526   0.8   10.6	GX 5-1
270.1506 -25.8766   24.1  10.9  -12.7  -0.0288  -0.5   11.5	GRS 1758-258
274.1491 -14.1401    5.8   4.9 -107.3   0.1181   2.0   10.4	GX 17+2
275.7491 -30.4179    9.7  16.6  -28.2   0.0741   1.2    9.6	H1820-303
285.2096 -24.7795    0.0  18.0  -62.4  -0.0542  -0.8   12.7	HT1900.1-2455
288.8478  10.8218    5.4  32.4 -149.7   0.1570   2.1    8.0	GRS 1915+105
262.8320 -33.7607    3.5  19.6    7.9   0.2000   3.3    9.0	GX 354-0
242.5253  24.2310    2.7  47.1  138.2   1.1521   4.3 ------	UNKNOWN
251.0216 -26.2166    2.2  20.3   45.7   0.3513   5.3 ------	UNKNOWN
239.7399 -57.6651    2.5  48.0   12.8   0.5964   4.6 ------	UNKNOWN
256.8731 -19.0670    2.9  12.4   61.3   0.2405   4.0 ------	UNKNOWN
262.1540  -0.0404    1.1  16.5  146.7   0.6318  10.3 ------	UNKNOWN
259.7815 -25.0270    1.9  13.3   31.9   0.3632   6.1 ------	UNKNOWN
273.3471 -65.0131    2.6  50.1  -10.2   0.5434   4.4 ------	UNKNOWN
	UNKNOWN
	UNKNOWN
	UNKNOWN
	UNKNOWN
Pre-slew background subtracted image of 15-350 keV band
Time interval of the image:
-1.424000 9.780590

# RAcent  DECcent POSerr Theta    Phi  PeakCts   SNR AngSep     Name
#  [deg]    [deg]    ['] [deg]  [deg]                   [']
244.9471 -15.6279    1.9  23.3   77.4   0.5232   6.1    2.0	Sco X-1
254.5422  35.2144    5.1  52.1  157.0  -0.7671  -2.3    8.7	Her X-1
255.9902 -37.7735    2.2  25.6   16.7   0.3879   5.3    4.2	4U 1700-377
256.4936 -36.5896    7.4  24.4   17.4   0.1117   1.6   10.4	GX 349+2
262.8661 -24.6292    9.4  11.3   22.6   0.0839   1.2   10.5	GX 1+4
264.6667 -44.5345   26.4  29.8   -1.4   0.0329   0.4    6.0	4U 1735-44
268.4239  -1.5405    5.5  13.5  169.0   0.1371   2.1    6.3	SW J1753.5-0127
270.4681 -24.9494    0.0  10.0  -14.8   0.0172   0.3   12.7	GX 5-1
270.2934 -25.6906    6.6  10.7  -13.4  -0.1219  -1.7    3.2	GRS 1758-258
273.8345 -14.1673    0.0   4.6 -107.7   0.0884   1.3   12.7	GX 17+2
276.0742 -30.5253    0.0  16.8  -29.0   0.1285   1.9   12.2	H1820-303
284.8823 -24.7730    0.0  17.7  -61.9  -0.1179  -1.5   12.2	HT1900.1-2455
288.8685  10.9148    4.6  32.5 -149.7   0.2195   2.5    4.5	GRS 1915+105
262.9322 -33.8277   17.6  19.6    7.6  -0.0442  -0.7    2.9	GX 354-0
262.1579  -0.0578    0.3  16.5  146.7   2.4666  35.7 ------	UNKNOWN
286.0218 -71.6380    2.5  57.5  -14.1   1.4725   4.7 ------	UNKNOWN
302.5252 -28.1650    2.3  33.6  -69.2   0.6142   5.0 ------	UNKNOWN
Post-slew image of 15-350 keV band
Time interval of the image:
49.580600 125.109900
126.480000 686.880590

# RAcent  DECcent POSerr Theta    Phi  PeakCts   SNR AngSep     Name
#  [deg]    [deg]    ['] [deg]  [deg]                   [']
244.9781 -15.6356    0.2  23.0   28.3  41.6210  51.5    0.3	Sco X-1
254.4645  35.1949    4.7  36.0  150.9  -3.4355  -2.4    8.9	Her X-1
256.0021 -37.8443    0.5  38.2  -10.5  23.8667  23.8    0.7	4U 1700-377
256.5753 -36.4685    5.0  36.8  -10.8   2.2596   2.3    7.3	GX 349+2
263.0303 -24.7493    1.3  24.7  -20.3   6.5673   8.8    1.2	GX 1+4
264.6569 -44.4444    8.2  44.4  -20.9   1.8157   1.4    3.7	4U 1735-44
268.3424  -1.6011   33.6   6.4  -94.4   0.2534   0.3    9.0	SW J1753.5-0127
270.2427 -25.1357    5.8  26.3  -35.1   1.7206   2.0    4.1	GX 5-1
270.3995 -25.9129    0.0  27.0  -34.8   0.3562   0.4   11.5	GRS 1758-258
273.9509 -13.9679    3.3  18.2  -57.9   2.6910   3.5    5.2	GX 17+2
275.7824 -30.4883    5.6  33.1  -40.2  -1.8801  -2.1   10.4	H1820-303
285.2080 -24.9040   26.1  33.4  -58.6  -0.5723  -0.4    9.4	HT1900.1-2455
288.8113  10.9432    1.3  28.7 -131.8   8.6206   9.1    0.8	GRS 1915+105
299.6117  35.2007    1.0  49.6 -157.6  21.7944  11.5    1.1	Cyg X-1
263.0663 -33.9238    4.1  33.9  -19.7   2.5729   2.8    6.6	GX 354-0
243.0385  11.5929    2.6  22.3  103.9   3.6066   4.4 ------	UNKNOWN
237.3578 -35.4286    2.7  42.2   12.2   5.2376   4.2 ------	UNKNOWN
232.2463 -49.0344    3.7  55.3    5.1  10.1460   3.2 ------	UNKNOWN
282.0829  51.4094    3.2  54.2  176.9  12.1983   3.6 ------	UNKNOWN
286.8873  52.9995    4.2  56.9  179.1  16.9716   2.8 ------	UNKNOWN
238.7242 -49.9278    3.0  53.7    0.2   9.0225   3.8 ------	UNKNOWN
	UNKNOWN
	UNKNOWN
	UNKNOWN
Plot creation:
Thu Apr 13 22:21:22 EDT 2017