Special notes of this burst
Image
Pre-slew 15.0-350.0 keV image (Event data)

#   RAcent    DECcent   POSerr    Theta     Phi              Peak Cts       SNR   Name
   93.0871    50.5001   0.0062    37.6216    23.6984         2.2599654     31.394 TRIG_00742866

Foreground time interval of the image:
 -0.288  10.645 (delta_t =  10.933 [sec])
Background time interval of the image:
-239.856  -0.288 (delta_t = 239.568 [sec])
Lightcurves
Notes:
- 1) The mask-weighted light curves are using the flight position.
- 2) Multiple plots of different time binning/intervals are shown to cover all scenarios of short/long GRBs, rate/image triggers, and real/false positives.
- 3) For all the mask-weighted lightcurves, the y-axis units are counts/sec/det where a det is 0.4 x 0.4 = 0.16 sq cm.
- 4) The verticle lines correspond to following: green dotted lines are T50 interval, black dotted lines are T90 interval, blue solid line(s) is a spacecraft slew start time, and orange solid line(s) is a spacecraft slew end time.
- 5) Time of each bin is in the middle of the bin.
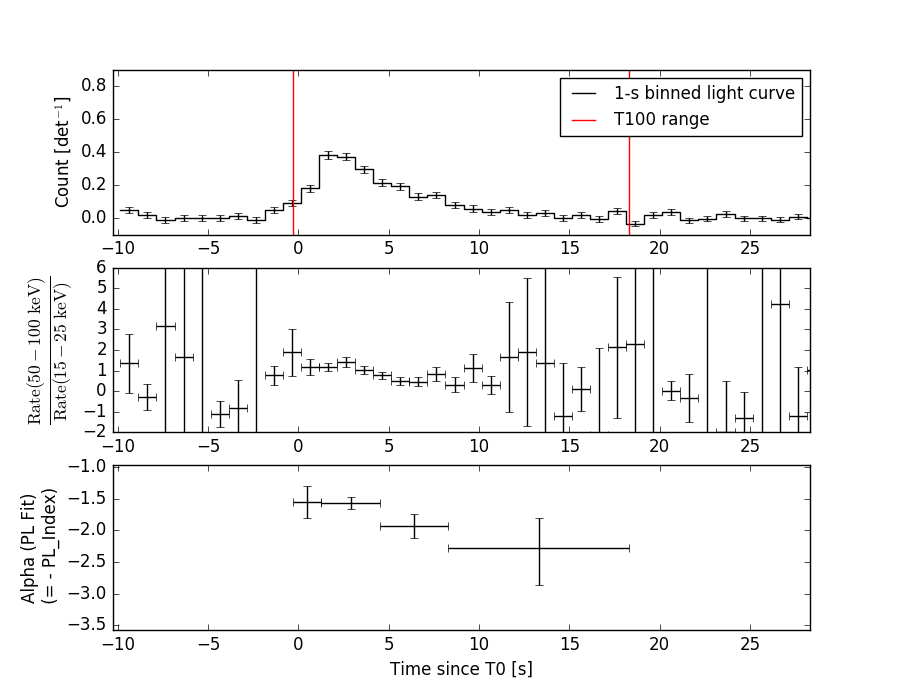
1 s binning
From T0-310 s to T0+310 s

From T100_start - 20 s to T100_end + 30 s

Full time interval

64 ms binning
Full time interval

From T100_start to T100_end

From T0-5 sec to T0+5 sec

16 ms binning
From T100_start-5 s to T100_start+5 s

Blue+Cyan dotted lines: Time interval of the scaled map
From 0.000000 to 1.024000
8 ms binning
From T100_start-3 s to T100_start+3 s

Blue+Cyan dotted lines: Time interval of the scaled map
From 0.000000 to 1.024000
2 ms binning
From T100_start-1 s to T100_start+1 s

Blue+Cyan dotted lines: Time interval of the scaled map
From 0.000000 to 1.024000
SN=5 or 10 sec. binning (whichever binning is satisfied first)

SN=5 or 10 sec. binning (T < 200 sec)

Quad-rate summed light curves (from T0-300s to T0+1000s)

Spectral Evolution
Spectra
Notes:
- 1) The fitting includes the systematic errors.
- 2) When the burst includes telescope slew time periods, the fitting uses an average response file made from multiple 5-s response files through out the slew time plus single time preiod for the non-slew times, and weighted by the total counts in the corresponding time period using addrmf. An average response file is needed becuase a spectral fit using the pre-slew DRM will introduce some errors in both a spectral shape and a normalization if the PHA file contains a lot of the slew/post-slew time interval.
- 3) For fits to more complicated models (e.g. a power-law over a cutoff power-law), the BAT team has decided to require a chi-square improvement of more than 6 for each extra dof.
Time averaged spectrum fit using the average DRM
Power-law model
Time interval is from   -0.288 sec. to   18.320 sec.

Spectral model in power-law:
------------------------------------------------------------
Parameters  : value       lower 90%   higher 90%
Photon index: 1.77793     ( -0.103398   0.105205 )
Norm@50keV  : 8.34702E-03    ( -0.00054169   0.000538366 )
------------------------------------------------------------
#Fit statistic : Chi-Squared =          89.00 using 59 PHA bins.
# Reduced chi-squared =          1.561 for     57 degrees of freedom
# Null hypothesis probability =   4.277636e-03

Photon flux (15-150 keV)    in 18.61 sec: 1.14056 ( -0.07093  0.07106 ) ph/cm2/s
Energy fluence (15-150 keV)             : 1.43158e-06 ( -9.49358e-08  9.54442e-08 ) ergs/cm2
Cutoff power-law model

Time interval is from   -0.288 sec. to   18.320 sec.
Spectral model in the cutoff power-law:
------------------------------------------------------------
Parameters  : value       lower 90%   higher 90%
Photon index: 0.805878     ( -0.518114   0.463403 )
Epeak [keV] : 58.6571      ( -7.48751 13.5702 )
Norm@50keV  : 2.67747E-02    ( -0.0112303   0.0226151 )
------------------------------------------------------------
#Fit statistic : Chi-Squared =          74.69 using 59 PHA bins.
# Reduced chi-squared =          1.334 for     56 degrees of freedom
# Null hypothesis probability =   4.821568e-02

Photon flux (15-150 keV)    in 18.61 sec: 1.09091 ( -0.0743  0.07444 ) ph/cm2/s
Energy fluence (15-150 keV)             : 1.33926e-06 ( -1.02445e-07  1.03835e-07 ) ergs/cm2
Band function

Time interval is from   -0.288 sec. to   18.320 sec.


Spectral model in the Band function:
------------------------------------------------------------
Parameters  : value       lower 90%   higher 90%
alpha       :    (     )
beta        :     (     )
Epeak [keV] :       (   )
Norm@50keV   :     (     )
------------------------------------------------------------

Photon flux (15-150 keV)    in  sec:  (    ) ph/cm2/s
Energy fluence (15-150 keV)             : 0 ( 0  0 ) ergs/cm2
Single BB
Spectral model blackbody:
------------------------------------------------------------
Parameters  : value    Lower 90%  Upper 90%
kT [keV]    : 12.8248  (-0.869119  0.934929)
R^2/D10^2   : 0.218041  (-0.0504128   0.065196)
(R is the radius in km and D10 is the distance to the source in units of 10 kpc)
------------------------------------------------------------
#Fit statistic : Chi-Squared =         112.22 using 59 PHA bins.
# Reduced chi-squared =         1.9688 for     57 degrees of freedom
# Null hypothesis probability =   1.782987e-05

Energy  Fluence     90% Error
[keV]   [erg/cm2]   [erg/cm2]
15- 25  1.416e-07   1.540e-08
25- 50  4.804e-07   3.378e-08
50-150  4.955e-07   6.914e-08
15-150  1.118e-06   8.086e-08
Thermal bremsstrahlung (OTTB)
Spectral model: thermal bremsstrahlung
------------------------------------------------------------
Parameters  : value         Lower 90%    Upper 90%
kT [keV]    : 106.415       (-20.855      29.3529)
Norm        : 4.98924       (-0.403935     0.456849)
------------------------------------------------------------
#Fit statistic : Chi-Squared =          77.72 using 59 PHA bins.
# Reduced chi-squared =          1.363 for     57 degrees of freedom
# Null hypothesis probability =   3.547132e-02

Energy  Fluence     90% Error
[keV]   [erg/cm2]   [erg/cm2]
15- 25  2.426e-07   2.336e-08
25- 50  4.246e-07   3.303e-08
50-150  7.123e-07   2.210e-07
15-150  1.380e-06   2.366e-07
Double BB
Spectral model: bbodyrad<1> + bbodyrad<2>
------------------------------------------------------------
Parameters  : value         Lower 90%    Upper 90%
kT1 [keV]   : 6.41910        (-1.60208      1.76899)
R1^2/D10^2  : 1.51147        (-0.799075      2.5272)
kT2 [keV]   : 19.0285        (-2.96915      4.97814)
R2^2/D10^2  : 3.81204E-02    (-0.0243203   0.0236477)
------------------------------------------------------------
#Fit statistic : Chi-Squared =          74.68 using 59 PHA bins.
# Reduced chi-squared =          1.358 for     55 degrees of freedom
# Null hypothesis probability =   3.986833e-02

Energy  Fluence     90% Error
[keV]   [erg/cm2]   [erg/cm2]
15- 25  2.191e-07   6.844e-08
25- 50  4.371e-07   1.129e-07
50-150  6.700e-07   2.283e-07
15-150  1.326e-06   3.948e-07
Peak spectrum fit
Power-law model

Time interval is from    1.284 sec. to    2.284 sec.

Spectral model in power-law:
------------------------------------------------------------
Parameters  : value       lower 90%   higher 90%
Photon index: 1.52869     ( -0.151273   0.152688 )
Norm@50keV  : 2.80490E-02    ( -0.00262695   0.00261717 )
------------------------------------------------------------
#Fit statistic : Chi-Squared =          63.03 using 59 PHA bins.
# Reduced chi-squared =          1.106 for     57 degrees of freedom
# Null hypothesis probability =   2.715727e-01

Photon flux (15-150 keV)    in 1 sec: 3.52943 ( -0.33309  0.33349 ) ph/cm2/s
Energy fluence (15-150 keV)             : 2.64923e-07 ( -2.66033e-08  2.6719e-08 ) ergs/cm2
Cutoff power-law model
Time interval is from    1.284 sec. to    2.284 sec.
Spectral model in the cutoff power-law:
------------------------------------------------------------
Parameters  : value       lower 90%   higher 90%
Photon index: 1.21975     ( -0.593564   0.389549 )
Epeak [keV] : 130.310      ( -58.4087 -130.31 )
Norm@50keV  : 4.00699E-02    ( -0.0133841   0.0375845 )
------------------------------------------------------------
#Fit statistic : Chi-Squared =          62.06 using 59 PHA bins.
# Reduced chi-squared =          1.108 for     56 degrees of freedom
# Null hypothesis probability =   2.690620e-01

Photon flux (15-150 keV)    in 1 sec: 3.49790 ( -0.338  0.33802 ) ph/cm2/s
Energy fluence (15-150 keV)             : 2.6124e-07 ( -2.762e-08  2.75552e-08 ) ergs/cm2
Band function

Time interval is from    1.284 sec. to    2.284 sec.


Spectral model in the Band function:
------------------------------------------------------------
Parameters  : value       lower 90%   higher 90%
alpha       :    (     )
beta        :     (     )
Epeak [keV] :       (   )
Norm@50keV   :     (     )
------------------------------------------------------------

Photon flux (15-150 keV)    in  sec:  (    ) ph/cm2/s
Energy fluence (15-150 keV)             : 0 ( 0  0 ) ergs/cm2
Single BB
Spectral model blackbody:
------------------------------------------------------------
Parameters  : value    Lower 90%  Upper 90%
kT [keV]    : 15.7544  (-1.91982  2.20148)
R^2/D10^2   : 0.338158  (-0.124358   0.19712)
(R is the radius in km and D10 is the distance to the source in units of 10 kpc)
------------------------------------------------------------
#Fit statistic : Chi-Squared =          97.04 using 59 PHA bins.
# Reduced chi-squared =          1.702 for     57 degrees of freedom
# Null hypothesis probability =   7.472865e-04

Energy  Fluence     90% Error
[keV]   [erg/cm2]   [erg/cm2]
15- 25  1.741e-08   3.605e-09
25- 50  7.230e-08   9.055e-09
50-150  1.247e-07   2.035e-08
15-150  2.144e-07   2.660e-08
Thermal bremsstrahlung (OTTB)
Spectral model: thermal bremsstrahlung
------------------------------------------------------------
Parameters  : value         Lower 90%    Upper 90%
kT [keV]    : 199.363       (-60.3604      -199.363)
Norm        : 14.5095       (-1.32585     1.32612)
------------------------------------------------------------
#Fit statistic : Chi-Squared =          62.26 using 59 PHA bins.
# Reduced chi-squared =          1.092 for     57 degrees of freedom
# Null hypothesis probability =   2.945982e-01

Energy  Fluence     90% Error
[keV]   [erg/cm2]   [erg/cm2]
15- 25  3.613e-08   4.260e-09
25- 50  6.950e-08   1.517e-08
50-150  1.524e-07   5.378e-08
15-150  2.581e-07   8.090e-08
Double BB

Spectral model: bbodyrad<1> + bbodyrad<2>
------------------------------------------------------------
Parameters  : value         Lower 90%    Upper 90%
kT1 [keV]   : 6.50951        (-1.29433      1.55903)
R1^2/D10^2  : 4.96285        (-2.64238      6.30176)
kT2 [keV]   : 26.2961        (-4.81097      7.70401)
R2^2/D10^2  : 4.52249E-02    (-0.0266472   0.0491686)
------------------------------------------------------------
#Fit statistic : Chi-Squared =          57.74 using 59 PHA bins.
# Reduced chi-squared =          1.050 for     55 degrees of freedom
# Null hypothesis probability =   3.744101e-01

Energy  Fluence     90% Error
[keV]   [erg/cm2]   [erg/cm2]
15- 25  3.642e-08   1.601e-08
25- 50  6.763e-08   2.090e-08
50-150  1.609e-07   6.603e-08
15-150  2.650e-07   7.945e-08
Pre-slew spectrum (Pre-slew PHA with pre-slew DRM)
Power-law model

Spectral model in power-law:
------------------------------------------------------------
Parameters  : value       lower 90%   higher 90%
Photon index: 1.72716     ( -0.0914566   0.0926005 )
Norm@50keV  : 1.33119E-02    ( -0.00074551   0.000742446 )
------------------------------------------------------------
#Fit statistic : Chi-Squared =          77.69 using 59 PHA bins.
# Reduced chi-squared =          1.363 for     57 degrees of freedom
# Null hypothesis probability =   3.559685e-02

Photon flux (15-150 keV)    in 10.93 sec: 1.78508 ( -0.0988746  0.0990515 ) ph/cm2/s
Energy fluence (15-150 keV)             : 1.34449e-06 ( -7.79217e-08  7.82427e-08 ) ergs/cm2
Cutoff power-law model
Spectral model in the cutoff power-law:
------------------------------------------------------------
Parameters  : value       lower 90%   higher 90%
Photon index: 0.902471     ( -0.435682   0.396176 )
Epeak [keV] : 65.2184      ( -8.78037 17.7417 )
Norm@50keV  : 3.51088E-02    ( -0.0128454   0.0229496 )
------------------------------------------------------------
#Fit statistic : Chi-Squared =          63.83 using 59 PHA bins.
# Reduced chi-squared =          1.140 for     56 degrees of freedom
# Null hypothesis probability =   2.206458e-01

Photon flux (15-150 keV)    in 10.93 sec: 1.71556 ( -0.10365  0.10383 ) ph/cm2/s
Energy fluence (15-150 keV)             : 1.27355e-06 ( -8.46856e-08  8.51338e-08 ) ergs/cm2
Band function
Spectral model in the Band function:
------------------------------------------------------------
Parameters  : value       lower 90%   higher 90%
alpha       :    (     )
beta        :     (     )
Epeak [keV] :       (   )
Norm@50keV   :     (     )
------------------------------------------------------------

Photon flux (15-150 keV)    in  sec:  (    ) ph/cm2/s
Energy fluence (15-150 keV)             : 0 ( 0  0 ) ergs/cm2
S(25-50 keV) vs. S(50-100 keV) plot

S(25-50 keV)  = 4.00e-07
S(50-100 keV) = 4.67e-07
T90 vs. Hardness ratio plot

T90                                   = 11.9520000219345 sec.
Hardness ratio (energy fluence ratio) = 1.1675
Color vs. Color plot

Count Ratio  (25-50 keV) / (15-25 keV) = 1.47006
Count Ratio (50-100 keV) / (15-25 keV) = 0.897558
Mask shadow pattern

IMX = 7.057130101787701E-01, IMY = -3.097634749074601E-01
TIME vs. PHA plot around the trigger time

Blue+Cyan dotted lines: Time interval of the scaled map
From 0.000000 to 1.024000
TIME vs. DetID plot around the trigger time

Blue+Cyan dotted lines: Time interval of the scaled map
From 0.000000 to 1.024000
100 us light curve (15-350 keV)

Blue+Cyan dotted lines: Time interval of the scaled map
From 0.000000 to 1.024000
Spacecraft aspect plot
Bright source in the pre-burst/pre-slew/post-slew images
Pre-burst image of 15-350 keV band
Time interval of the image:
-239.856000 -0.288000

# RAcent  DECcent POSerr Theta    Phi  PeakCts   SNR AngSep     Name
#  [deg]    [deg]    ['] [deg]  [deg]                   [']
 83.6305  22.0200    0.3  12.3   65.4   9.8883  40.9    0.4	Crab
 72.9621 -39.6594    2.1  56.7 -179.7   8.2054   5.4 ------	UNKNOWN
 60.6543 -37.8315    2.1  55.8 -168.0   5.9347   5.4 ------	UNKNOWN
 44.7448 -21.5185    2.7  46.7 -143.2   2.8189   4.2 ------	UNKNOWN
 24.9123  31.9870    2.9  44.8  -60.0   5.2839   4.0 ------	UNKNOWN
Pre-slew background subtracted image of 15-350 keV band
Time interval of the image:
-0.288000 10.644600

# RAcent  DECcent POSerr Theta    Phi  PeakCts   SNR AngSep     Name
#  [deg]    [deg]    ['] [deg]  [deg]                   [']
 83.8001  22.1532    0.0  12.5   65.1   0.0759   1.7   12.5	Crab
 93.0871  50.5001    0.4  37.6   23.7   2.2601  31.4 ------	UNKNOWN
 84.1865  13.9550    2.2  12.4  103.9   0.2303   5.2 ------	UNKNOWN
 73.6108  19.3478    2.4   3.0   38.4   0.2046   4.8 ------	UNKNOWN
 49.9604 -17.4049    2.2  40.5 -145.6   0.4165   5.4 ------	UNKNOWN
Post-slew image of 15-350 keV band
Time interval of the image:
67.244590 962.217300

# RAcent  DECcent POSerr Theta    Phi  PeakCts   SNR AngSep     Name
#  [deg]    [deg]    ['] [deg]  [deg]                   [']
 83.6436  22.0125    0.2  29.5 -165.6  35.8694  53.0    0.6	Crab
267.7833  74.7541    3.0  54.7   -1.9   8.9593   3.9 ------	UNKNOWN
 67.7998  43.1098    2.6  18.7 -107.2   3.1211   4.5 ------	UNKNOWN
 66.7351  -0.6561    3.5  55.9 -151.2  12.6974   3.3 ------	UNKNOWN
 44.9674  37.4731    3.3  36.2  -95.7   6.6606   3.5 ------	UNKNOWN
Plot creation:
Thu Apr 13 21:29:42 EDT 2017