Special notes of this burst
Image
15.0-350.0 keV image (Event data with DETECTION mask)
#   RAcent    DECcent   POSerr    Theta     Phi              Peak Cts       SNR   Name
  219.8240   -25.2364   0.0094    41.3808    77.7865        28.5629485     20.633 TRIG_00745797

Foreground time interval of the image:
-27.104  50.605 (delta_t =  77.709 [sec])
Background time interval of the image:
-131.195 -27.104 (delta_t = 104.091 [sec])
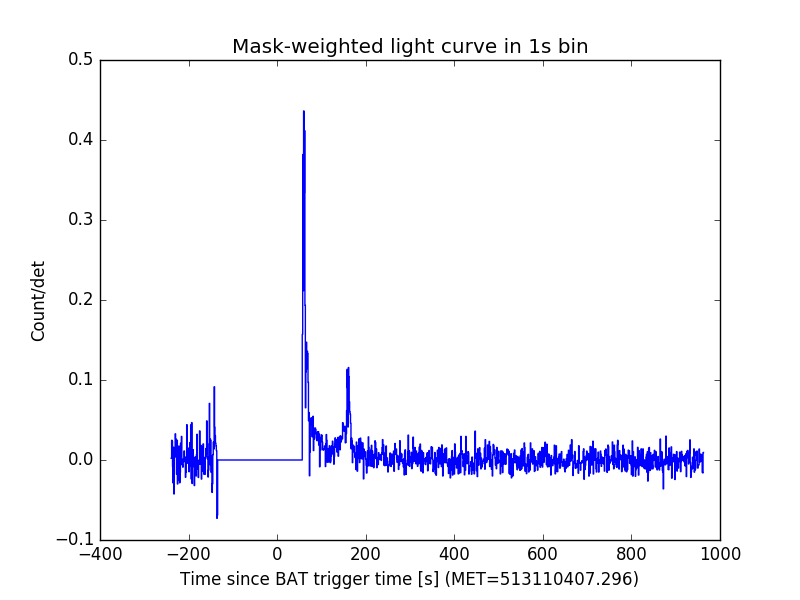
Lightcurves
Notes:
- 1) The mask-weighted lightcurves have units of either count/det or counts/sec/det, where a det is 0.4 x 0.4 = 0.16 sq cm.
- 2) The verticle lines correspond to following: green dotted lines are T50 interval, black dotted lines are T90 interval, blue solid line(s) is a spacecraft slew start time, and orange solid line(s) is a spacecraft slew end time.
- 3) For lightcurves in unit of count rate, time of each bin is in the middle of the bin.
1 s binning
From T0-310 s to T0+310 s
From T100_start - 20 s to T100_end + 30 s
Full time interval
64 ms binning
Full time interval

From T100_start to T100_end
From T0-5 sec to T0+5 sec
16 ms binning
From T100_start-5 s to T100_start+5 s

8 ms binning
From T100_start-3 s to T100_start+3 s
2 ms binning
From T100_start-1 s to T100_start+1 s
SN=5 or 10 sec. binning (whichever binning is satisfied first)
SN=5 or 10 sec. binning (T < 200 sec)
Quad-rate summed light curves (from T0-300s to T0+1000s)

Spectral Evolution

Spectra
Notes:
- 1) The fitting includes the systematic errors.
- 2) For long bursts, a spectral fit of the pre-slew DRM will introduce some errors in both a spectral shape and a normalization if the PHA file contains a lot of the slew/post-slew time interval.
- 3) For fits to more complicated models (e.g. a power-law over a cutoff power-law), the BAT team has decided to require a chi-square improvement of more than 6 for each extra dof.
- 4) For short bursts (T90<1sec), the specrtum is also fit with Blackbody, OTTB, and Double Blackbody.
Time averaged spectrum fit using an average DRM
Power-law model
Time interval is from   56.700 sec. to  242.496 sec.

Spectral model in power-law:
------------------------------------------------------------
Parameters  : value       lower 90%   higher 90%
Photon index: 1.51480     ( -0.118421   0.118727 )
Norm@50keV  : 2.20437E-03    ( -0.000143329   0.000142976 )
------------------------------------------------------------
#Fit statistic : Chi-Squared =          63.35 using 59 PHA bins.
# Reduced chi-squared =          1.111 for     57 degrees of freedom
# Null hypothesis probability =   2.624303e-01

Photon flux (15-150 keV)    in 185.8 sec: 0.276308 ( -0.018512  0.018569 ) ph/cm2/s
Energy fluence (15-150 keV)             : 3.87664e-06 ( -2.73299e-07  2.7496e-07 ) ergs/cm2
Cutoff power-law model

Time interval is from   56.700 sec. to  242.496 sec.
Spectral model in the cutoff power-law:
------------------------------------------------------------
Parameters  : value       lower 90%   higher 90%
Photon index: 1.51618     ( -0.157876   0.116146 )
Epeak [keV] : 9999.36      ( -9999.36 -9999.36 )
Norm@50keV  : 2.20664E-03    ( -0.000507137   0.000774694 )
------------------------------------------------------------
#Fit statistic : Chi-Squared =          63.37 using 59 PHA bins.
# Reduced chi-squared =          1.132 for     56 degrees of freedom
# Null hypothesis probability =   2.325820e-01

Photon flux (15-150 keV)    in 185.8 sec: 0.277438 ( -0.023788  0.021511 ) ph/cm2/s
Energy fluence (15-150 keV)             : 3.9136e-06 ( -3.11581e-07  2.37047e-07 ) ergs/cm2
Band function
Time interval is from   56.700 sec. to  242.496 sec.

Spectral model in the Band function:
------------------------------------------------------------
Parameters  : value       lower 90%   higher 90%
alpha       : -1.02757   ( 1.02913   1.02913 )
beta        : -1.53310    ( -0.173372   0.133229 )
Epeak [keV] : 56.9407      ( -53.6627 -53.6627 )
Norm@50keV   : 4.78800E-03    ( -0.00301462   255799 )
------------------------------------------------------------
#Fit statistic : Chi-Squared =          63.12 using 59 PHA bins.
# Reduced chi-squared =          1.148 for     55 degrees of freedom
# Null hypothesis probability =   2.111987e-01

Photon flux (15-150 keV)    in 185.8 sec:  (    ) ph/cm2/s
Energy fluence (15-150 keV)             : 0 ( 0  0 ) ergs/cm2
Single BB
Spectral model blackbody:
------------------------------------------------------------
Parameters  : value    Lower 90%  Upper 90%
kT [keV]    : 15.4139  (  )
R^2/D10^2   : 2.71644E-02  (   )
(R is the radius in km and D10 is the distance to the source in units of 10 kpc)
------------------------------------------------------------
#Fit statistic : Chi-Squared =         145.60 using 59 PHA bins.
# Reduced chi-squared =         2.5544 for     57 degrees of freedom
# Null hypothesis probability =   1.080687e-09

Energy  Fluence     90% Error
[keV]   [erg/cm2]   [erg/cm2]
15- 25  2.499e-07   3.103e-08
25- 50  1.018e-06   9.392e-08
50-150  1.665e-06   2.067e-07
15-150  2.932e-06   2.397e-07
Thermal bremsstrahlung (OTTB)
Spectral model: thermal bremsstrahlung
------------------------------------------------------------
Parameters  : value         Lower 90%    Upper 90%
kT [keV]    : 200.000       (-37.8363      -200)
Norm        : 1.12253       (-0.0720918     0.0720918)
------------------------------------------------------------
#Fit statistic : Chi-Squared =          67.05 using 59 PHA bins.
# Reduced chi-squared =          1.176 for     57 degrees of freedom
# Null hypothesis probability =   1.704699e-01

Energy  Fluence     90% Error
[keV]   [erg/cm2]   [erg/cm2]
15- 25  5.212e-07   3.874e-08
25- 50  1.003e-06   9.141e-08
50-150  2.199e-06   4.810e-07
15-150  3.723e-06   6.354e-07
Double BB
Spectral model: bbodyrad<1> + bbodyrad<2>
------------------------------------------------------------
Parameters  : value         Lower 90%    Upper 90%
kT1 [keV]   : 6.97273        (-1.11264      1.29837)
R1^2/D10^2  : 0.324599        (-0.145308      0.28888)
kT2 [keV]   : 31.6654        (-6.06891      11.0321)
R2^2/D10^2  : 1.91091E-03    (-0.00114478   0.00199572)
------------------------------------------------------------
#Fit statistic : Chi-Squared =          61.75 using 59 PHA bins.
# Reduced chi-squared =          1.123 for     55 degrees of freedom
# Null hypothesis probability =   2.474991e-01

Energy  Fluence     90% Error
[keV]   [erg/cm2]   [erg/cm2]
15- 25  5.230e-07   1.231e-07
25- 50  9.770e-07   1.697e-07
50-150  2.453e-06   6.998e-07
15-150  3.953e-06   9.773e-07
S(25-50 keV) vs. S(50-100 keV) plot
S(25-50 keV)  = 9.66e-07
S(50-100 keV) = 1.35e-06
T90 vs. Hardness ratio plot
T90                                   = 165.31200003624 sec.
Hardness ratio (energy fluence ratio) = 1.39752
Color vs. Color plot
Count Ratio  (25-50 keV) / (15-25 keV) = 1.4405
Count Ratio (50-100 keV) / (15-25 keV) = 1.07452
Mask shadow pattern (with DETECTION mask)

IMX = 1.863853558528538E-01, IMY = -8.610831229835769E-01
TIME vs. PHA plot around the beginning of event data (event_start to event_start+0.64s) with DETECTION mask
TIME vs. DetID plot around the beginning of event data (event_start to event_start+0.64s) with DETECTION mask
100 us light curve (15-350 keV; (event_start to event_start+0.64s)
Spacecraft aspect plot

Bright source in the event data image
Event data image of 15-350 keV band
Time interval of the image:
-27.104000 50.604600

# RAcent  DECcent POSerr Theta    Phi  PeakCts   SNR AngSep     Name
#  [deg]    [deg]    ['] [deg]  [deg]                   [']
245.0193 -15.5905    4.4  23.8  113.6  -0.6572  -2.6    3.8	Sco X-1
256.1332 -38.0218    0.0  12.4   34.8  -0.1799  -1.1   12.7	4U 1700-377
256.2902 -36.2461    0.0  11.2   41.0   0.1280   0.7   12.7	GX 349+2
262.8677 -24.5779    0.0   5.4  137.5  -0.4946  -2.8   12.7	GX 1+4
264.5410 -44.4380    7.3  15.5   -1.0  -0.2661  -1.6    8.7	4U 1735-44
268.2219  -1.5752   23.6  27.5  177.9  -0.1003  -0.5   11.4	SW J1753.5-0127
270.1271 -25.0954    4.4   5.1 -144.8  -0.4512  -2.6    8.6	GX 5-1
270.2859 -25.7696    7.7   4.7 -138.2   0.2708   1.5    1.8	GRS 1758-258
274.0533 -14.0183    6.8  16.6 -159.1  -0.3009  -1.7    3.0	GX 17+2
275.8760 -30.2177    9.6   8.3  -85.2  -0.2052  -1.2    9.3	H1820-303
285.1141 -24.7743    3.2  17.2 -105.8  -0.5875  -3.6    9.7	HT1900.1-2455
288.8859  11.0761    8.4  45.6 -154.3  -0.3515  -1.4    9.4	GRS 1915+105
263.0403 -33.8545   81.6   5.7   23.8  -0.0239  -0.1    2.8	GX 354-0
224.0955 -16.1367    3.4  40.9   92.9   4.1724   3.4 ------	UNKNOWN
219.8240 -25.2364    0.6  41.4   77.8  28.5590  20.6 ------	UNKNOWN
283.2185 -26.1987    2.5  15.1 -102.6   0.7911   4.7 ------	UNKNOWN
Webpage updated on:
Wed Apr 26 16:41:20 EDT 2017