Estimated redshift from machine learning (Ukwatta et al. 2016) - may take a few minutes to calcaulte
Image
Pre-slew 15-350 keV image (Event data; bkg subtracted)

#   RAcent  DECcent POSerr  Theta    Phi     Peak Cts     SNR  Name
  282.0823  -2.4446 0.0311    3.0 -142.1       1.4774     6.2  TRIG_00745966
------------------------------------------

Foreground time interval of the image:
-14.499 203.101 (delta_t = 217.600 [sec])
Background time interval of the image:
Lightcurves
Notes:
- 1) All plots contain as much data as has been downloaded to date.
- 2) The mask-weighted light curves are using the flight position.
- 3) Multiple plots of different time binning/intervals are shown to cover all scenarios of short/long GRBs, rate/image triggers, and real/false positives.
- 4) For all the mask-weighted lightcurves, the y-axis units are counts/sec/det where a det is 0.4 x 0.4 = 0.16 sq cm.
- 5) The verticle lines correspond to following: green dotted lines are T50 interval, black dotted lines are T90 interval, blue solid line(s) is a spacecraft slew start time, and orange solid line(s) is a spacecraft slew end time.
- 6) Time of each bin is in the middle of the bin.
1 s binning
From T0-310 s to T0+310 s

From T100_start - 20 s to T100_end + 30 s

Full time interval

64 ms binning
Full time interval

From T100_start to T100_end

From T0-5 sec to T0+5 sec

16 ms binning
From T100_start-5 s to T100_start+5 s

8 ms binning
From T100_start-3 s to T100_start+3 s

2 ms binning
From T100_start-1 s to T100_start+1 s

SN=5 or 10 sec. binning (whichever binning is satisfied first)

SN=5 or 10 sec. binning (T < 200 sec)

Spectra
Notes:
- 1) The fitting includes the systematic errors.
- 2) For long bursts, a spectral fit of the pre-slew DRM will introduce some errors in both a spectral shape and a normalization if the PHA file contains a lot of the slew/post-slew time interval.
- 3) For fits to more complicated models (e.g. a power-law over a cutoff power-law), the BAT team has decided to require a chi-square improvement of more than 6 for each extra dof.
- 4) For short bursts (T90<1sec), the specrtum is also fit with Blackbody, OTTB, and Double Blackbody.
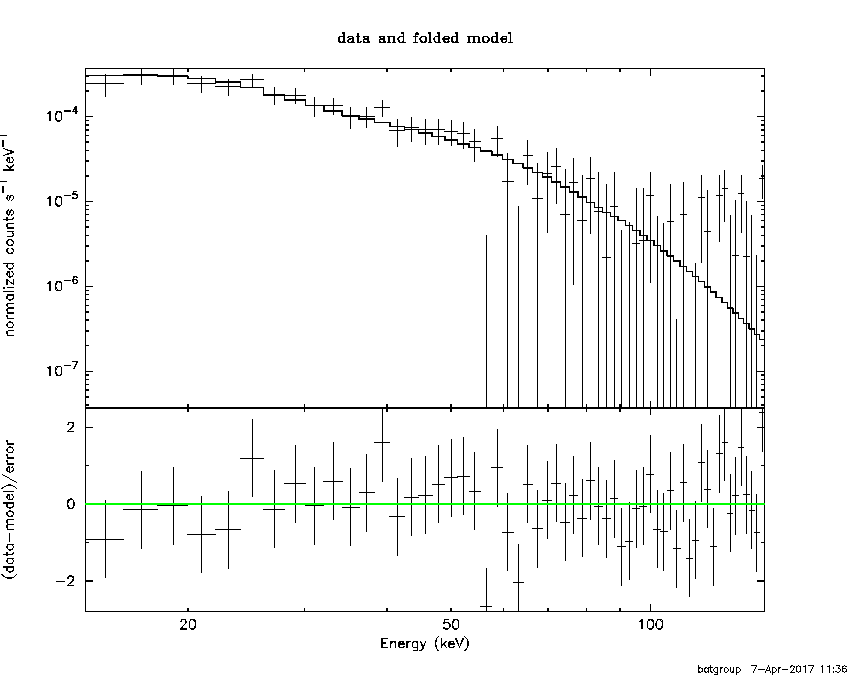
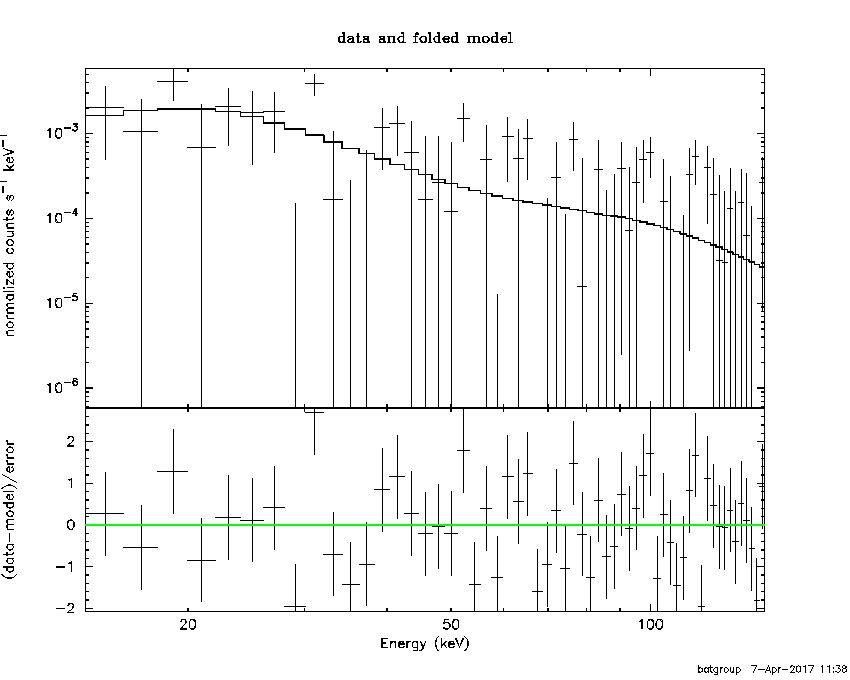
Time averaged spectrum fit using the pre-slew DRM
Power-law model

Multiple GTIs in the spectrum
tstart tstop
-66.884000 -56.898600
-56.000000 658.430000
660.000000 886.340000

Spectral model in power-law:
------------------------------------------------------------
Parameters  : value       lower 90%   higher 90%
Photon index: 2.22626     ( -0.171852   0.181412 )
Norm@50keV  : 3.26352E-04    ( -4.2464e-05   4.20027e-05 )
------------------------------------------------------------
#Fit statistic : Chi-Squared =          56.56 using 59 PHA bins.
# Reduced chi-squared =         0.9923 for     57 degrees of freedom
# Null hypothesis probability =   4.915357e-01

Photon flux (15-150 keV)    in 950.8 sec: 5.47855E-02 ( -0.00500933  0.00500949 ) ph/cm2/s
Energy fluence (15-150 keV)             : 2.92862e-06 ( -3.24041e-07  3.32252e-07 ) ergs/cm2
Cutoff power-law model

Multiple GTIs in the spectrum
tstart tstop
-66.884000 -56.898600
-56.000000 658.430000
660.000000 886.340000
Spectral model in the cutoff power-law:
------------------------------------------------------------
Parameters  : value       lower 90%   higher 90%
Photon index: 0.183992     ( -1.3063   1.05213 )
Epeak [keV] : 32.2861      ( -5.96675 4.55673 )
Norm@50keV  : 6.09581E-03    ( -0.0061533   0.0350432 )
------------------------------------------------------------
#Fit statistic : Chi-Squared =          43.42 using 59 PHA bins.
# Reduced chi-squared =         0.7754 for     56 degrees of freedom
# Null hypothesis probability =   8.900594e-01

Photon flux (15-150 keV)    in 950.8 sec: 5.16860E-02 ( -0.0050795  0.0051107 ) ph/cm2/s
Energy fluence (15-150 keV)             : 2.46971e-06 ( -2.92514e-07  3.32856e-07 ) ergs/cm2
Band function

Multiple GTIs in the spectrum
tstart tstop
-66.884000 -56.898600
-56.000000 658.430000
660.000000 886.340000

Spectral model in the Band function:
------------------------------------------------------------
Parameters  : value       lower 90%   higher 90%
alpha       : -3.48524E-02   ( -1.13653   1.76099 )
beta        : -3.61754    ( 3.67659   0.992614 )
Epeak [keV] : 31.8841      ( -4.81941 4.69511 )
Norm@50keV   : 7.77140E-03    ( -0.00495301   0.119547 )
------------------------------------------------------------
#Fit statistic : Chi-Squared =          43.26 using 59 PHA bins.
# Reduced chi-squared =         0.7866 for     55 degrees of freedom
# Null hypothesis probability =   8.740373e-01

Photon flux (15-150 keV)    in 950.8 sec: 6.15657E-02 ( 6.93843  -0.0130753 ) ph/cm2/s
Energy fluence (15-150 keV)             : 2.82371e-06 ( -2.81706e-06  -6.63307e-07 ) ergs/cm2
Single BB

Spectral model blackbody:
------------------------------------------------------------
Parameters  : value    Lower 90%  Upper 90%
kT [keV]    : 8.54619  (-0.748988  0.819218)
R^2/D10^2   : 4.76524E-02  (-0.0146793   0.0212109)
(R is the radius in km and D10 is the distance to the source in units of 10 kpc)
------------------------------------------------------------
#Fit statistic : Chi-Squared =          48.21 using 59 PHA bins.
# Reduced chi-squared =         0.8457 for     57 degrees of freedom
# Null hypothesis probability =   7.901187e-01

Energy  Fluence     90% Error
[keV]   [erg/cm2]   [erg/cm2]
15- 25  6.257e-07   8.676e-08
25- 50  1.224e-06   1.341e-07
50-150  3.977e-07   1.134e-07
15-150  2.248e-06   2.558e-07
Thermal bremsstrahlung (OTTB)
Spectral model: thermal bremsstrahlung
------------------------------------------------------------
Parameters  : value         Lower 90%    Upper 90%
kT [keV]    : 42.6107       (-8.55381      12.0958)
Norm        : 0.343982       (-0.0540912     0.0653466)
------------------------------------------------------------
#Fit statistic : Chi-Squared =          46.68 using 59 PHA bins.
# Reduced chi-squared =         0.8189 for     57 degrees of freedom
# Null hypothesis probability =   8.337182e-01

Energy  Fluence     90% Error
[keV]   [erg/cm2]   [erg/cm2]
15- 25  7.664e-07   9.313e-08
25- 50  1.035e-06   1.114e-07
50-150  8.573e-07   2.321e-07
15-150  2.659e-06   3.689e-07
Double BB
Spectral model: bbodyrad<1> + bbodyrad<2>
------------------------------------------------------------
Parameters  : value         Lower 90%    Upper 90%
kT1 [keV]   : 3.94357        (-2.68699      -3.94326)
R1^2/D10^2  : 0.369536        (-0.324185      799.065)
kT2 [keV]   : 10.0671        (-1.66243      -10.0668)
R2^2/D10^2  : 2.10001E-02    (-0.0209923   0.0282863)
------------------------------------------------------------
#Fit statistic : Chi-Squared =          43.47 using 59 PHA bins.
# Reduced chi-squared =         0.7904 for     55 degrees of freedom
# Null hypothesis probability =   8.691010e-01

Energy  Fluence     90% Error
[keV]   [erg/cm2]   [erg/cm2]
15- 25  7.112e-07   3.680e-07
25- 50  1.140e-06   5.942e-07
50-150  5.528e-07   3.358e-07
15-150  2.404e-06   1.223e-06
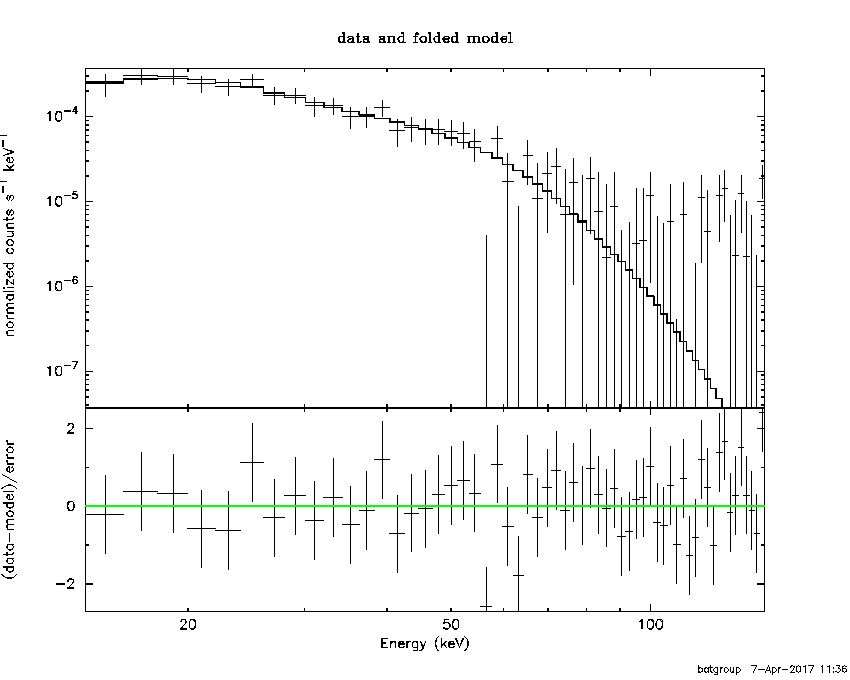
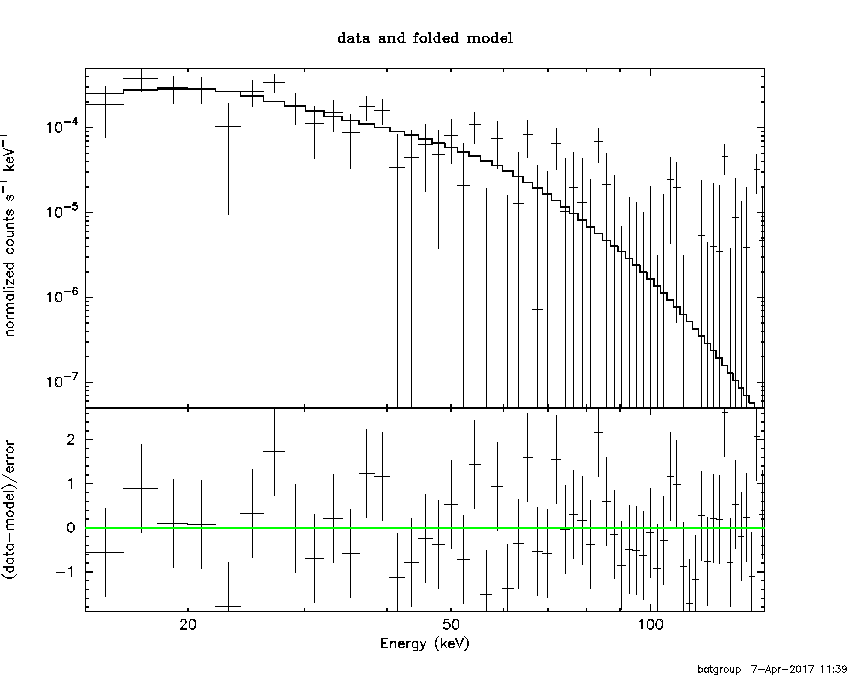
Peak spectrum fit
Power-law model
Time interval is from  861.884 sec. to  862.884 sec.

Spectral model in power-law:
------------------------------------------------------------
Parameters  : value       lower 90%   higher 90%
Photon index: 2.09255     ( -0.765134   1.01232 )
Norm@50keV  : 2.32704E-03    ( -0.00232704   0.00130585 )
------------------------------------------------------------
#Fit statistic : Chi-Squared =          63.22 using 59 PHA bins.
# Reduced chi-squared =          1.109 for     57 degrees of freedom
# Null hypothesis probability =   2.660783e-01

Photon flux (15-150 keV)    in 1 sec: 0.364762 ( -0.145147  0.145272 ) ph/cm2/s
Energy fluence (15-150 keV)             : 2.16054e-08 ( -1.07095e-08  1.20992e-08 ) ergs/cm2
Cutoff power-law model

Time interval is from  861.884 sec. to  862.884 sec.
Spectral model in the cutoff power-law:
------------------------------------------------------------
Parameters  : value       lower 90%   higher 90%
Photon index: 1.91825     (     )
Epeak [keV] : 21.2777      (   )
Norm@50keV  : 2.90858E-03    (     )
------------------------------------------------------------
#Fit statistic : Chi-Squared =          63.26 using 59 PHA bins.
# Reduced chi-squared =          1.130 for     56 degrees of freedom
# Null hypothesis probability =   2.354040e-01

Photon flux (15-150 keV)    in 1 sec: 0.364531 ( -0.144603  0.144021 ) ph/cm2/s
Energy fluence (15-150 keV)             : 2.15842e-08 ( -1.15683e-08  1.1904e-08 ) ergs/cm2
Band function

Time interval is from  861.884 sec. to  862.884 sec.

Spectral model in the Band function:
------------------------------------------------------------
Parameters  : value       lower 90%   higher 90%
alpha       : 4.88600   ( -4.886   -4.886 )
beta        : -2.25308    ( -2.44891   0.887415 )
Epeak [keV] : 20.8230      ( -20.823 74.606 )
Norm@50keV   : 1155.59    ( -456.078   8.83003e+06 )
------------------------------------------------------------
#Fit statistic : Chi-Squared =          63.11 using 59 PHA bins.
# Reduced chi-squared =          1.147 for     55 degrees of freedom
# Null hypothesis probability =   2.114864e-01

Photon flux (15-150 keV)    in 1 sec: 6.15657E-02 ( 6.93843  -0.0130753 ) ph/cm2/s
Energy fluence (15-150 keV)             : 2.96983e-09 ( -2.96283e-09  -6.9763e-10 ) ergs/cm2
Single BB
Spectral model blackbody:
------------------------------------------------------------
Parameters  : value    Lower 90%  Upper 90%
kT [keV]    : 7.68288  (-3.09899  5.143)
R^2/D10^2   : 0.468452  (-0.467919   3.35271)
(R is the radius in km and D10 is the distance to the source in units of 10 kpc)
------------------------------------------------------------
#Fit statistic : Chi-Squared =          64.54 using 59 PHA bins.
# Reduced chi-squared =          1.132 for     57 degrees of freedom
# Null hypothesis probability =   2.299750e-01

Energy  Fluence     90% Error
[keV]   [erg/cm2]   [erg/cm2]
15- 25  4.844e-09   3.054e-09
25- 50  7.893e-09   5.305e-09
50-150  1.811e-09   1.430e-09
15-150  1.455e-08   9.730e-09
Thermal bremsstrahlung (OTTB)

Spectral model: thermal bremsstrahlung
------------------------------------------------------------
Parameters  : value         Lower 90%    Upper 90%
kT [keV]    : 50.1061       (-50.097      -50.097)
Norm        : 2.06284       (-1.08048     3.36456)
------------------------------------------------------------
#Fit statistic : Chi-Squared =          63.47 using 59 PHA bins.
# Reduced chi-squared =          1.113 for     57 degrees of freedom
# Null hypothesis probability =   2.590928e-01

Energy  Fluence     90% Error
[keV]   [erg/cm2]   [erg/cm2]
15- 25  5.046e-09   3.184e-09
25- 50  7.253e-09   4.703e-09
50-150  7.056e-09   6.105e-09
15-150  1.936e-08   1.311e-08
Double BB
------------------------------------------------------------
Parameters  : value         Lower 90%    Upper 90%
kT1 [keV]   : 6.50697        (-6.44149      4.48644)
R1^2/D10^2  : 0.829405        (-0.82507      -0.82507)
kT2 [keV]   : 62.6383        (-63.2796      -63.2796)
R2^2/D10^2  : 2.74234E-04    (-0.000273727   0.0907253)
------------------------------------------------------------
#Fit statistic : Chi-Squared =          62.81 using 59 PHA bins.
#Fit statistic : Chi-Squared =          62.80 using 59 PHA bins.
# Reduced chi-squared =          1.142 for     55 degrees of freedom
# Reduced chi-squared =          1.142 for     55 degrees of freedom
# Null hypothesis probability =   2.192236e-01
# Null hypothesis probability =   2.195299e-01

Energy  Fluence     90% Error
[keV]   [erg/cm2]   [erg/cm2]
15- 25  5.306e-09   3.172e-09
25- 50  6.869e-09   4.434e-09
50-150  1.188e-08   6.165e-09
15-150  2.405e-08   1.140e-08
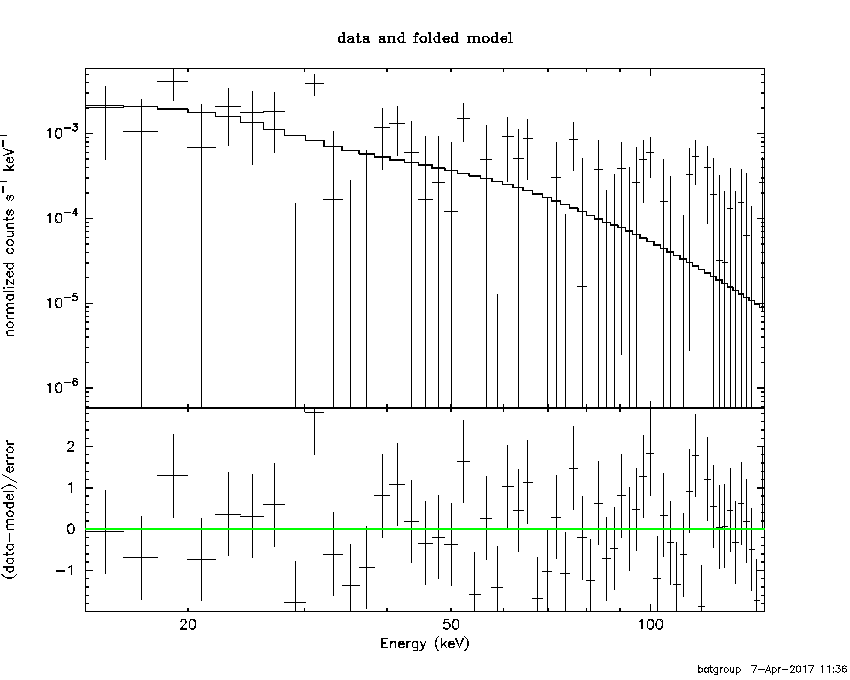
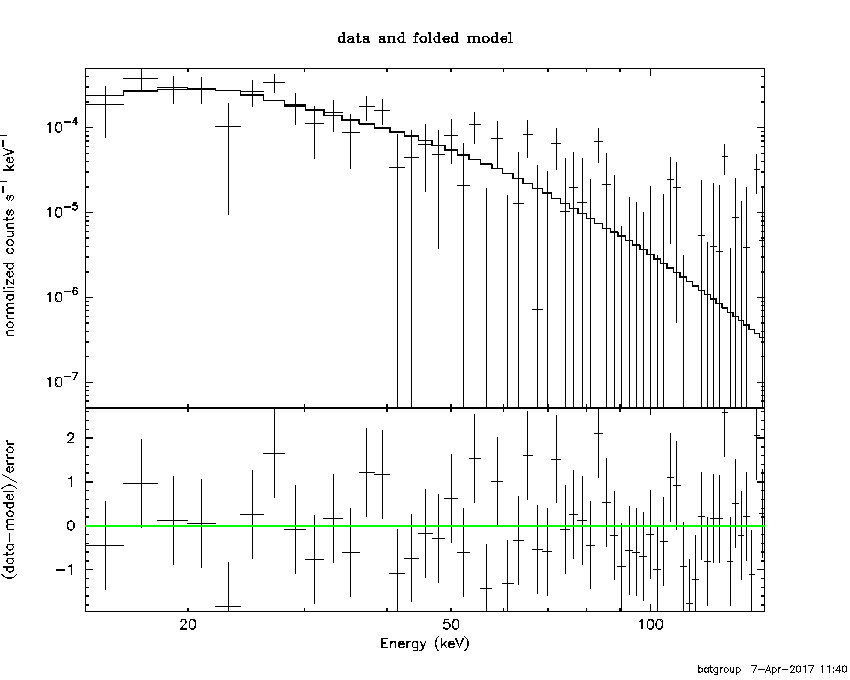
Pre-slew spectrum (Pre-slew PHA with pre-slew DRM)
Power-law model

Spectral model in power-law:
------------------------------------------------------------
Parameters  : value       lower 90%   higher 90%
Photon index: 2.16241     ( -0.303185   0.336222 )
Norm@50keV  : 3.47797E-04    ( -8.44451e-05   8.29859e-05 )
------------------------------------------------------------
#Fit statistic : Chi-Squared =          61.04 using 59 PHA bins.
# Reduced chi-squared =          1.071 for     57 degrees of freedom
# Null hypothesis probability =   3.328004e-01

Photon flux (15-150 keV)    in 217.6 sec: 5.64648E-02 ( -0.00964858  0.00965094 ) ph/cm2/s
Energy fluence (15-150 keV)             : 7.07988e-07 ( -1.48542e-07  1.55752e-07 ) ergs/cm2
Cutoff power-law model
Spectral model in the cutoff power-law:
------------------------------------------------------------
Parameters  : value       lower 90%   higher 90%
Photon index: 0.168378     ( -2.70399   1.66304 )
Epeak [keV] : 33.2608      ( -16.0776 10.065 )
Norm@50keV  : 6.14191E-03    ( -0.00692166   0.379519 )
------------------------------------------------------------
#Fit statistic : Chi-Squared =          56.37 using 59 PHA bins.
# Reduced chi-squared =          1.007 for     56 degrees of freedom
# Null hypothesis probability =   4.611732e-01

Photon flux (15-150 keV)    in 217.6 sec: 5.41301E-02 ( -0.0095349  0.0096178 ) ph/cm2/s
Energy fluence (15-150 keV)             : 5.9867e-07 ( -1.28667e-07  1.57529e-07 ) ergs/cm2
Band function
Spectral model in the Band function:
------------------------------------------------------------
Parameters  : value       lower 90%   higher 90%
alpha       : 0.399959   ( -1.71097   -0.423498 )
beta        : -3.39573    ( 3.36511   1.14967 )
Epeak [keV] : 32.0386      ( -9.33407 14.1133 )
Norm@50keV   : 1.56035E-02    ( -0.0179036   18.2044 )
------------------------------------------------------------
#Fit statistic : Chi-Squared =          56.38 using 59 PHA bins.
# Reduced chi-squared =          1.025 for     55 degrees of freedom
# Null hypothesis probability =   4.232098e-01

Photon flux (15-150 keV)    in 217.6 sec: 6.15657E-02 ( 6.93843  -0.0130753 ) ph/cm2/s
Energy fluence (15-150 keV)             : 6.46235e-07 ( -6.44712e-07  -1.51804e-07 ) ergs/cm2
S(25-50 keV) vs. S(50-100 keV) plot

S(25-50 keV)  = 9.33e-07
S(50-100 keV) = 7.97e-07
T90 vs. Hardness ratio plot
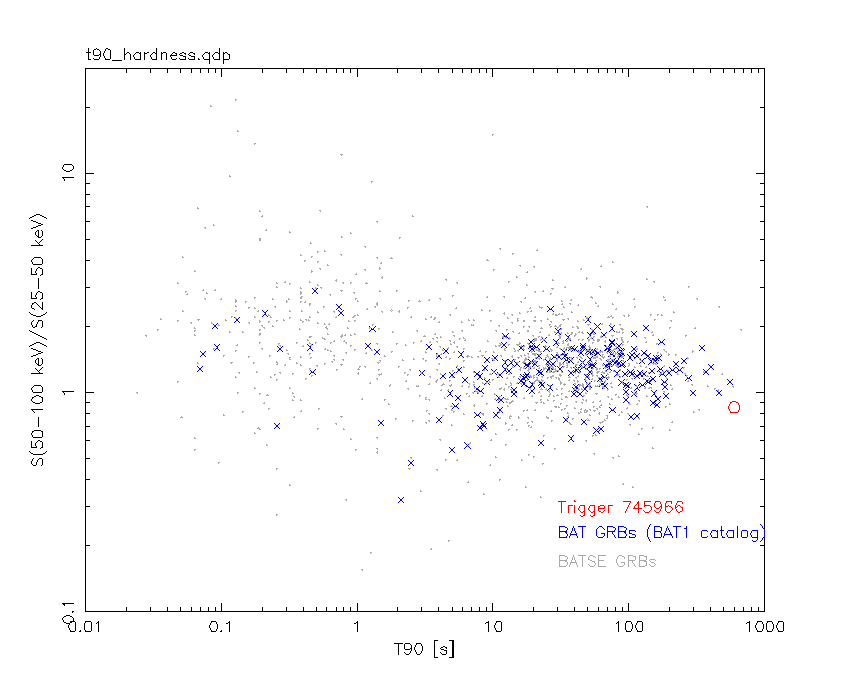
T90                                   = 595.867999970913 sec.
Hardness ratio (energy fluence ratio) = 0.854234
Color vs. Color plot

Count Ratio  (25-50 keV) / (15-25 keV) = 1.07681
Count Ratio (50-100 keV) / (15-25 keV) = 0.289341
Mask shadow pattern

IMX = -4.163683619524744E-02, IMY = 3.240240085307980E-02
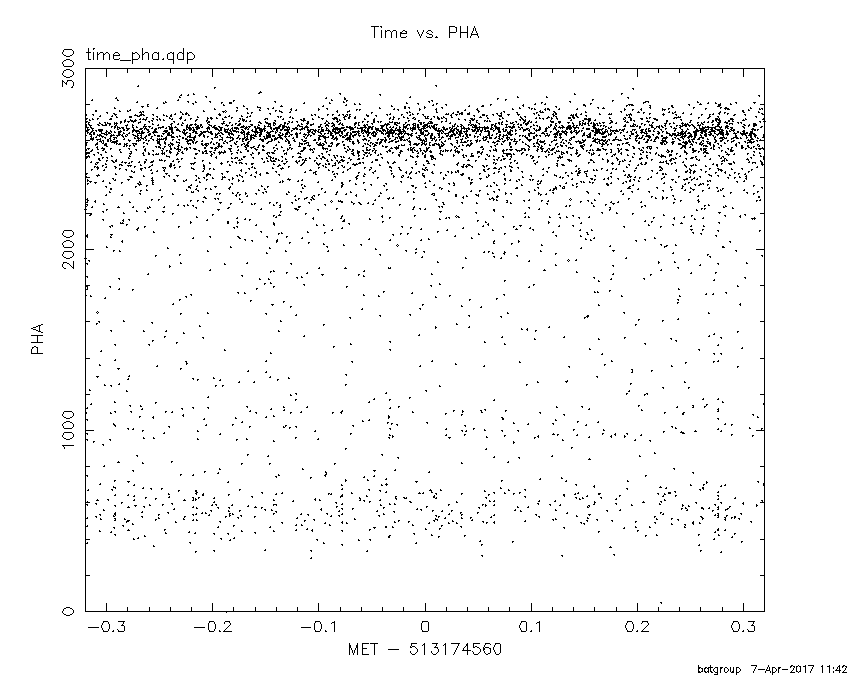
TIME vs. PHA plot around the trigger time
TIME vs. DetID plot around the trigger time

100 us light curve (15-350 keV)

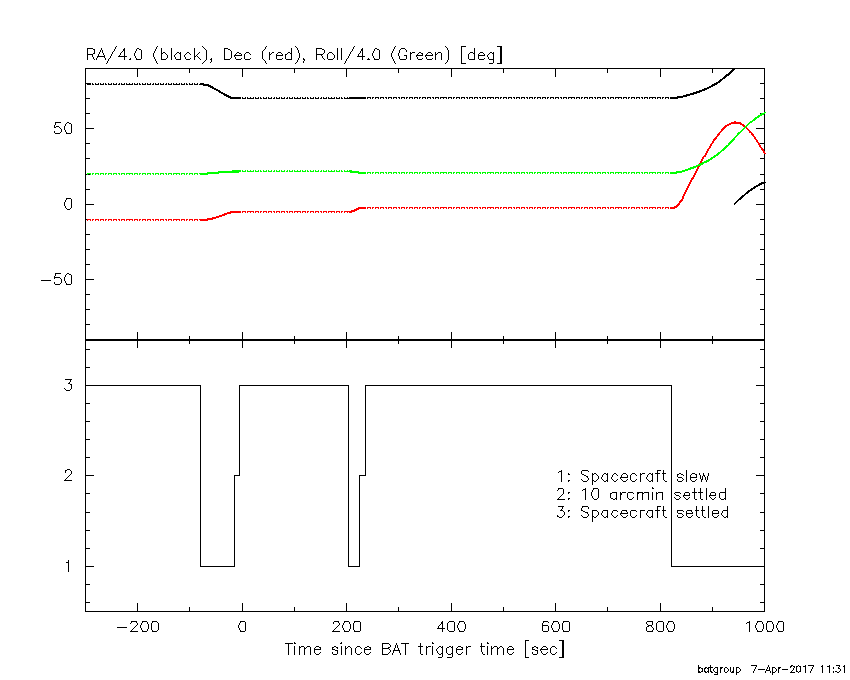
Spacecraft aspect plot
Bright source in the pre-burst/pre-slew/post-slew images
Pre-burst image of 15-350 keV band
Time interval of the image:
Pre-slew background subtracted image of 15-350 keV band
Time interval of the image:
-14.499400 203.100640

# RAcent  DECcent POSerr Theta    Phi  PeakCts   SNR AngSep     Name
#  [deg]    [deg]    ['] [deg]  [deg]                   [']
244.9888 -15.6346    1.1  36.4   73.6   6.8887  10.9    0.6	Sco X-1
254.5964  35.3238   12.2  47.0  154.4   0.7937   0.9    6.9	Her X-1
256.0346 -37.8984    3.5  39.7   34.0   1.5096   3.3    4.0	4U 1700-377
256.5595 -36.3430  180.3  38.3   35.1   0.0274   0.1    7.7	GX 349+2
263.0021 -24.7750    2.3  25.9   41.8   1.5102   5.1    1.8	GX 1+4
264.7201 -44.3000   37.6  41.7   20.3  -0.1202  -0.3    9.1	4U 1735-44
268.2235  -1.5813   45.3  12.6  108.5  -0.0635  -0.3   11.6	SW J1753.5-0127
270.4481 -25.2294    0.0  22.4   27.6  -0.1043  -0.4   12.7	GX 5-1
270.1521 -25.8587   14.4  23.1   27.5  -0.1954  -0.8   10.7	GRS 1758-258
273.9546 -14.0409    3.3  11.1   37.8   0.8816   3.5    3.0	GX 17+2
276.0731 -30.2286    5.8  25.6   12.1   0.4535   2.0   11.3	H1820-303
284.9768 -25.0063    4.7  20.6   -8.5   0.6342   2.5    6.1	HT1900.1-2455
288.7826  10.9440    1.9  18.0 -148.8   1.5844   6.2    0.9	GRS 1915+105
299.6110  35.2040    1.0  44.0 -153.8   5.2723  11.9    1.0	Cyg X-1
308.2791  40.8152    8.4  52.4 -150.0  -1.2783  -1.4   11.3	Cyg X-3
263.1511 -33.8957   16.8  33.1   30.2   0.2314   0.7    8.9	GX 354-0
259.9035 -25.0330    0.8  28.1   45.7   4.6112  14.7 ------	UNKNOWN
282.0824  -2.4446    1.9   3.0 -142.1   1.4770   6.2 ------	UNKNOWN
302.3606  46.2743    2.9  54.8 -158.1   3.9092   4.0 ------	UNKNOWN
320.8447  -0.0479    2.8  40.7  -92.2   5.1316   4.0 ------	UNKNOWN
320.5842   4.0511    2.9  41.2  -98.5   4.7492   3.9 ------	UNKNOWN
Post-slew image of 15-350 keV band
Time interval of the image:
223.700580 658.430000
660.000000 821.200600

# RAcent  DECcent POSerr Theta    Phi  PeakCts   SNR AngSep     Name
#  [deg]    [deg]    ['] [deg]  [deg]                   [']
244.9728 -15.6345    1.2  38.8   74.5  17.5677   9.8    0.5	Sco X-1
254.5907  35.3996   10.0  45.7  155.1   2.0362   1.2    7.4	Her X-1
255.9412 -37.7887    2.4  42.7   37.6   5.4261   4.8    4.0	4U 1700-377
256.4683 -36.4147    3.9  41.4   38.4   3.1291   2.9    1.7	GX 349+2
262.9911 -24.7184    2.0  28.9   44.6   3.7892   5.7    1.9	GX 1+4
264.5629 -44.3306    2.7  44.6   24.5   4.1208   4.4   10.5	4U 1735-44
268.5018  -1.2904    0.0  13.6  101.3  -0.2329  -0.4   12.6	SW J1753.5-0127
270.2848 -25.1047    2.4  25.3   32.2   2.7203   4.7    1.5	GX 5-1
270.2235 -25.6707    6.3  25.9   31.7   1.0477   1.9    6.1	GRS 1758-258
273.9414 -14.0837    5.3  14.1   40.8   1.2182   2.2    4.7	GX 17+2
275.8872 -30.3660    4.4  28.5   17.9   1.4143   2.6    2.0	H1820-303
285.0399 -24.9213  320.1  22.7   -0.4   0.0199   0.0    0.2	HT1900.1-2455
288.8129  10.9418    1.4  15.0 -146.7   4.0363   8.0    0.9	GRS 1915+105
299.5827  35.2052    0.6  41.1 -151.3  14.6340  18.6    0.4	Cyg X-1
308.2693  40.9320    6.5  49.5 -147.3   2.3152   1.8    7.3	Cyg X-3
263.0518 -33.9085    3.2  36.1   34.0   2.8617   3.6    5.4	GX 354-0
259.9054 -25.0225    0.9  31.1   48.1   9.7615  13.1 ------	UNKNOWN
257.7647  26.0549    2.8  36.9  148.8   3.9743   4.2 ------	UNKNOWN
278.2004  18.0032    3.1  20.8  176.4   1.6766   3.8 ------	UNKNOWN
282.0175  -2.4420    1.6   0.0  115.4   3.3045   7.2 ------	UNKNOWN
321.9163   7.9165    3.1  41.1  -98.3   9.2461   3.7 ------	UNKNOWN
	UNKNOWN
Plot creation:
Fri Apr  7 11:43:39 EDT 2017