Estimated redshift from machine learning (Ukwatta et al. 2016) - may take a few minute to calcaulte
Image
Pre-slew 15.0-350.0 keV image (Event data)

#   RAcent    DECcent   POSerr    Theta     Phi              Peak Cts       SNR   Name
   41.5415   -55.9318   0.0118    29.3730    26.1962         1.2339635     16.320 TRIG_00753110

Foreground time interval of the image:
-19.856  12.053 (delta_t =  31.909 [sec])
Background time interval of the image:
-239.648 -19.856 (delta_t = 219.792 [sec])
Lightcurves
Notes:
- 1) The mask-weighted light curves are using the flight position.
- 2) Multiple plots of different time binning/intervals are shown to cover all scenarios of short/long GRBs, rate/image triggers, and real/false positives.
- 3) For all the mask-weighted lightcurves, the y-axis units are counts/sec/det where a det is 0.4 x 0.4 = 0.16 sq cm.
- 4) The verticle lines correspond to following: green dotted lines are T50 interval, black dotted lines are T90 interval, blue solid line(s) is a spacecraft slew start time, and orange solid line(s) is a spacecraft slew end time.
- 5) Time of each bin is in the middle of the bin.
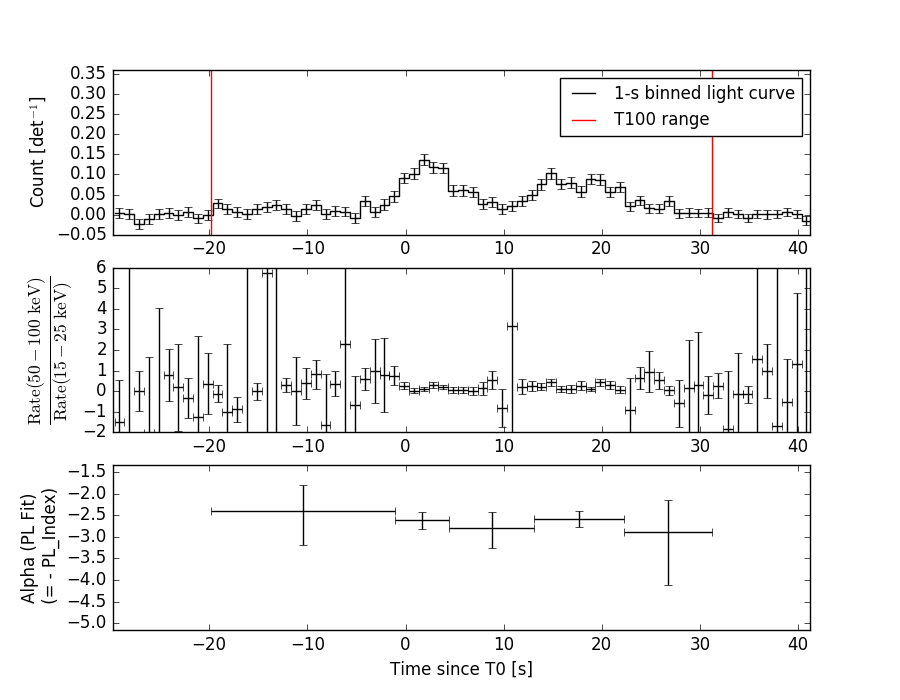
1 s binning
From T0-310 s to T0+310 s
From T100_start - 20 s to T100_end + 30 s

Full time interval

64 ms binning
Full time interval

From T100_start to T100_end

From T0-5 sec to T0+5 sec

16 ms binning
From T100_start-5 s to T100_start+5 s

Blue+Cyan dotted lines: Time interval of the scaled map
From 0.000000 to 1.024000
8 ms binning
From T100_start-3 s to T100_start+3 s

Blue+Cyan dotted lines: Time interval of the scaled map
From 0.000000 to 1.024000
2 ms binning
From T100_start-1 s to T100_start+1 s
Blue+Cyan dotted lines: Time interval of the scaled map
From 0.000000 to 1.024000
SN=5 or 10 sec. binning (whichever binning is satisfied first)

SN=5 or 10 sec. binning (T < 200 sec)

Quad-rate summed light curves (from T0-300s to T0+1000s)

Spectral Evolution
Spectra
Notes:
- 1) The fitting includes the systematic errors.
- 2) When the burst includes telescope slew time periods, the fitting uses an average response file made from multiple 5-s response files through out the slew time plus single time preiod for the non-slew times, and weighted by the total counts in the corresponding time period using addrmf. An average response file is needed becuase a spectral fit using the pre-slew DRM will introduce some errors in both a spectral shape and a normalization if the PHA file contains a lot of the slew/post-slew time interval.
- 3) For fits to more complicated models (e.g. a power-law over a cutoff power-law), the BAT team has decided to require a chi-square improvement of more than 6 for each extra dof.
Time averaged spectrum fit using the average DRM
Power-law model
Time interval is from  -19.856 sec. to   31.216 sec.

Spectral model in power-law:
------------------------------------------------------------
Parameters  : value       lower 90%   higher 90%
Photon index: 2.67082     ( -0.162302   0.171795 )
Norm@50keV  : 1.77547E-03    ( -0.000221512   0.000221912 )
------------------------------------------------------------
#Fit statistic : Chi-Squared =          48.01 using 59 PHA bins.
# Reduced chi-squared =         0.8423 for     57 degrees of freedom
# Null hypothesis probability =   7.959120e-01

Photon flux (15-150 keV)    in 51.07 sec: 0.388775 ( -0.028559  0.028567 ) ph/cm2/s
Energy fluence (15-150 keV)             : 9.55223e-07 ( -8.1114e-08  8.28207e-08 ) ergs/cm2
Cutoff power-law model

Time interval is from  -19.856 sec. to   31.216 sec.
Spectral model in the cutoff power-law:
------------------------------------------------------------
Parameters  : value       lower 90%   higher 90%
Photon index: 1.14606     ( -1.09289   0.673546 )
Epeak [keV] : 18.9511      ( -18.2501 6.53538 )
Norm@50keV  : 1.71562E-02    ( -0.0171562   0.074001 )
------------------------------------------------------------
#Fit statistic : Chi-Squared =          37.93 using 59 PHA bins.
# Reduced chi-squared =         0.6772 for     56 degrees of freedom
# Null hypothesis probability =   9.693693e-01

Photon flux (15-150 keV)    in 51.07 sec: 0.369905 ( -0.029808  0.029953 ) ph/cm2/s
Energy fluence (15-150 keV)             : 8.45076e-07 ( -8.15991e-08  9.06441e-08 ) ergs/cm2
Band function

Time interval is from  -19.856 sec. to   31.216 sec.


Spectral model in the Band function:
------------------------------------------------------------
Parameters  : value       lower 90%   higher 90%
alpha       :    (     )
beta        :     (     )
Epeak [keV] :       (   )
Norm@50keV   :     (     )
------------------------------------------------------------

Photon flux (15-150 keV)    in  sec:  (    ) ph/cm2/s
Energy fluence (15-150 keV)             : 0 ( 0  0 ) ergs/cm2
Single BB
Spectral model blackbody:
------------------------------------------------------------
Parameters  : value    Lower 90%  Upper 90%
kT [keV]    : 6.88044  (-0.531787  0.574179)
R^2/D10^2   : 0.762183  (-0.223813   0.322244)
(R is the radius in km and D10 is the distance to the source in units of 10 kpc)
------------------------------------------------------------
#Fit statistic : Chi-Squared =          51.82 using 59 PHA bins.
# Reduced chi-squared =         0.9091 for     57 degrees of freedom
# Null hypothesis probability =   6.691439e-01

Energy  Fluence     90% Error
[keV]   [erg/cm2]   [erg/cm2]
15- 25  2.907e-07   3.486e-08
25- 50  3.849e-07   3.789e-08
50-150  5.991e-08   1.768e-08
15-150  7.355e-07   6.460e-08
Thermal bremsstrahlung (OTTB)
Spectral model: thermal bremsstrahlung
------------------------------------------------------------
Parameters  : value         Lower 90%    Upper 90%
kT [keV]    : 26.6670       (-4.04924      5.00841)
Norm        : 3.42711       (-0.556621     0.690561)
------------------------------------------------------------
#Fit statistic : Chi-Squared =          38.03 using 59 PHA bins.
# Reduced chi-squared =         0.6672 for     57 degrees of freedom
# Null hypothesis probability =   9.749551e-01

Energy  Fluence     90% Error
[keV]   [erg/cm2]   [erg/cm2]
15- 25  3.337e-07   3.271e-08
25- 50  3.561e-07   3.457e-08
50-150  1.662e-07   4.578e-08
15-150  8.560e-07   7.354e-08
Double BB

Spectral model: bbodyrad<1> + bbodyrad<2>
------------------------------------------------------------
Parameters  : value         Lower 90%    Upper 90%
kT1 [keV]   : 4.45355        (-1.4373      1.37632)
R1^2/D10^2  : 3.20972        (-1.92424      12.355)
kT2 [keV]   : 10.6731        (-2.53765      6.16266)
R2^2/D10^2  : 7.19842E-02    (-0.0644378   0.141496)
------------------------------------------------------------
#Fit statistic : Chi-Squared =          37.63 using 59 PHA bins.
# Reduced chi-squared =         0.6842 for     55 degrees of freedom
# Null hypothesis probability =   9.645739e-01

Energy  Fluence     90% Error
[keV]   [erg/cm2]   [erg/cm2]
15- 25  3.320e-07   1.585e-07
25- 50  3.552e-07   1.788e-07
50-150  1.511e-07   8.884e-08
15-150  8.384e-07   4.257e-07
Peak spectrum fit
Power-law model
Time interval is from    1.268 sec. to    2.268 sec.

Spectral model in power-law:
------------------------------------------------------------
Parameters  : value       lower 90%   higher 90%
Photon index: 2.69494     ( -0.310306   0.357563 )
Norm@50keV  : 5.96856E-03    ( -0.0016134   0.00163597 )
------------------------------------------------------------
#Fit statistic : Chi-Squared =          75.34 using 59 PHA bins.
# Reduced chi-squared =          1.322 for     57 degrees of freedom
# Null hypothesis probability =   5.231707e-02

Photon flux (15-150 keV)    in 1 sec: 1.32786 ( -0.1962  0.19629 ) ph/cm2/s
Energy fluence (15-150 keV)             : 6.34001e-08 ( -1.15929e-08  1.21526e-08 ) ergs/cm2
Cutoff power-law model
Time interval is from    1.268 sec. to    2.268 sec.
Spectral model in the cutoff power-law:
------------------------------------------------------------
Parameters  : value       lower 90%   higher 90%
Photon index: 0.666360     ( -2.2724   1.27614 )
Epeak [keV] : 21.3783      (   )
Norm@50keV  : 0.134283    (     )
------------------------------------------------------------
#Fit statistic : Chi-Squared =          71.27 using 59 PHA bins.
# Reduced chi-squared =          1.273 for     56 degrees of freedom
# Null hypothesis probability =   8.215159e-02

Photon flux (15-150 keV)    in 1 sec:  (    ) ph/cm2/s
Energy fluence (15-150 keV)             : 0 ( 0  0 ) ergs/cm2
Band function

Time interval is from    1.268 sec. to    2.268 sec.


Spectral model in the Band function:
------------------------------------------------------------
Parameters  : value       lower 90%   higher 90%
alpha       :    (     )
beta        :     (     )
Epeak [keV] :       (   )
Norm@50keV   :     (     )
------------------------------------------------------------

Photon flux (15-150 keV)    in  sec:  (    ) ph/cm2/s
Energy fluence (15-150 keV)             : 0 ( 0  0 ) ergs/cm2
Single BB
Spectral model blackbody:
------------------------------------------------------------
Parameters  : value    Lower 90%  Upper 90%
kT [keV]    : 6.75885  (-0.994911  1.10464)
R^2/D10^2   : 2.98364  (-1.41583   2.89882)
(R is the radius in km and D10 is the distance to the source in units of 10 kpc)
------------------------------------------------------------
#Fit statistic : Chi-Squared =          74.15 using 59 PHA bins.
# Reduced chi-squared =          1.301 for     57 degrees of freedom
# Null hypothesis probability =   6.301696e-02

Energy  Fluence     90% Error
[keV]   [erg/cm2]   [erg/cm2]
15- 25  2.108e-08   4.780e-09
25- 50  2.695e-08   7.035e-09
50-150  3.927e-09   2.050e-09
15-150  5.196e-08   1.187e-08
Thermal bremsstrahlung (OTTB)

Spectral model: thermal bremsstrahlung
------------------------------------------------------------
Parameters  : value         Lower 90%    Upper 90%
kT [keV]    : 25.1846       (-6.74956      9.93131)
Norm        : 12.7037       (-3.56428     5.35751)
------------------------------------------------------------
#Fit statistic : Chi-Squared =          71.64 using 59 PHA bins.
# Reduced chi-squared =          1.257 for     57 degrees of freedom
# Null hypothesis probability =   9.174190e-02

Energy  Fluence     90% Error
[keV]   [erg/cm2]   [erg/cm2]
15- 25  2.338e-08   4.565e-09
25- 50  2.407e-08   5.640e-09
50-150  1.035e-08   5.794e-09
15-150  5.780e-08   1.276e-08
Double BB
Spectral model: bbodyrad<1> + bbodyrad<2>
------------------------------------------------------------
Parameters  : value         Lower 90%    Upper 90%
kT1 [keV]   : 3.02206        (-2.78302      12.2659)
R1^2/D10^2  : 48.8360        (-47.4202      -49.7017)
kT2 [keV]   : 8.29642        (-1.91918      6.96736)
R2^2/D10^2  : 1.02111    (-0.99707   2.59146)
------------------------------------------------------------
#Fit statistic : Chi-Squared =          70.63 using 59 PHA bins.
# Reduced chi-squared =          1.284 for     55 degrees of freedom
# Null hypothesis probability =   7.617008e-02

Energy  Fluence     90% Error
[keV]   [erg/cm2]   [erg/cm2]
15- 25  2.259e-08   1.107e-08
25- 50  2.572e-08   1.461e-08
50-150  7.181e-09   4.719e-09
15-150  5.549e-08   2.759e-08
Pre-slew spectrum (Pre-slew PHA with pre-slew DRM)
Power-law model
Spectral model in power-law:
------------------------------------------------------------
Parameters  : value       lower 90%   higher 90%
Photon index: 2.63782     ( -0.213586   0.231821 )
Norm@50keV  : 1.56364E-03    ( -0.000274183   0.000276589 )
------------------------------------------------------------
#Fit statistic : Chi-Squared =          60.55 using 59 PHA bins.
# Reduced chi-squared =          1.062 for     57 degrees of freedom
# Null hypothesis probability =   3.490849e-01

Photon flux (15-150 keV)    in 31.91 sec: 0.335048 ( -0.0331905  0.0331911 ) ph/cm2/s
Energy fluence (15-150 keV)             : 5.19782e-07 ( -6.31611e-08  6.54008e-08 ) ergs/cm2
Cutoff power-law model

Spectral model in the cutoff power-law:
------------------------------------------------------------
Parameters  : value       lower 90%   higher 90%
Photon index: 0.595057     ( -1.69687   1.32079 )
Epeak [keV] : 21.9247      ( -18.1595 5.23365 )
Norm@50keV  : 3.66680E-02    ( -0.0369724   0.516643 )
------------------------------------------------------------
#Fit statistic : Chi-Squared =          52.59 using 59 PHA bins.
# Reduced chi-squared =         0.9390 for     56 degrees of freedom
# Null hypothesis probability =   6.048975e-01

Photon flux (15-150 keV)    in 31.91 sec: 0.320647 ( -0.033189  0.033434 ) ph/cm2/s
Energy fluence (15-150 keV)             : 4.46935e-07 ( -5.59957e-08  6.53676e-08 ) ergs/cm2
Band function
Spectral model in the Band function:
------------------------------------------------------------
Parameters  : value       lower 90%   higher 90%
alpha       :    (     )
beta        :     (     )
Epeak [keV] :       (   )
Norm@50keV   :     (     )
------------------------------------------------------------

Photon flux (15-150 keV)    in  sec:  (    ) ph/cm2/s
Energy fluence (15-150 keV)             : 0 ( 0  0 ) ergs/cm2
S(25-50 keV) vs. S(50-100 keV) plot

S(25-50 keV)  = 3.21e-07
S(50-100 keV) = 2.01e-07
T90 vs. Hardness ratio plot

T90                                   = 36.7680000066757 sec.
Hardness ratio (energy fluence ratio) = 0.626168
Color vs. Color plot

Count Ratio  (25-50 keV) / (15-25 keV) = 0.773465
Count Ratio (50-100 keV) / (15-25 keV) = 0.182613
Mask shadow pattern
IMX = 5.050395590385686E-01, IMY = -2.484686641430191E-01
TIME vs. PHA plot around the trigger time

Blue+Cyan dotted lines: Time interval of the scaled map
From 0.000000 to 1.024000
TIME vs. DetID plot around the trigger time
Blue+Cyan dotted lines: Time interval of the scaled map
From 0.000000 to 1.024000
100 us light curve (15-350 keV)
Blue+Cyan dotted lines: Time interval of the scaled map
From 0.000000 to 1.024000
Spacecraft aspect plot

Bright source in the pre-burst/pre-slew/post-slew images
Pre-burst image of 15-350 keV band
Time interval of the image:
-239.648000 -19.856000

# RAcent  DECcent POSerr Theta    Phi  PeakCts   SNR AngSep     Name
#  [deg]    [deg]    ['] [deg]  [deg]                   [']
333.4923  -8.6104    2.7  51.3  150.3   4.5202   4.3 ------	UNKNOWN
 91.7248 -57.0023    2.9  53.9    8.1   2.5104   4.0 ------	UNKNOWN
 71.4644 -13.1853    3.0  47.1  -52.8   3.6527   3.9 ------	UNKNOWN
Pre-slew background subtracted image of 15-350 keV band
Time interval of the image:
-19.856000 12.052600

# RAcent  DECcent POSerr Theta    Phi  PeakCts   SNR AngSep     Name
#  [deg]    [deg]    ['] [deg]  [deg]                   [']
342.6071  -4.3620    2.2  46.1  161.7   0.8329   5.2 ------	UNKNOWN
 41.5415 -55.9319    0.7  29.4   26.2   1.2340  16.3 ------	UNKNOWN
346.7848   6.7715    2.0  50.6  176.5   1.1083   5.7 ------	UNKNOWN
 40.2956 -33.0327    2.3  14.7  -24.9   0.3103   5.1 ------	UNKNOWN
  4.1510   9.6679    2.2  43.4 -161.7   0.5598   5.3 ------	UNKNOWN
 31.4250  15.3457    2.6  45.4 -122.6   1.1805   4.5 ------	UNKNOWN
Post-slew image of 15-350 keV band
Time interval of the image:
66.452620 484.052610

# RAcent  DECcent POSerr Theta    Phi  PeakCts   SNR AngSep     Name
#  [deg]    [deg]    ['] [deg]  [deg]                   [']
318.6687 -75.1718    3.4  35.1  104.8   2.3621   3.4 ------	UNKNOWN
339.6420 -73.5397    3.8  29.7  108.9   1.4059   3.0 ------	UNKNOWN
 26.9205 -39.5391    3.3  19.0 -138.4   0.9448   3.5 ------	UNKNOWN
106.8566 -23.7343    3.1  56.7  -17.7   4.6040   3.7 ------	UNKNOWN
Plot creation:
Wed Jun  7 14:11:16 EDT 2017