Estimated redshift from machine learning (Ukwatta et al. 2016) - may take a few minute to calcaulte
Image
Pre-slew 15.0-350.0 keV image (Event data)
#   RAcent    DECcent   POSerr    Theta     Phi              Peak Cts       SNR   Name
  163.4295    25.3803   0.0111    13.0237   160.6342         1.6839444     17.458 TRIG_00753445

Foreground time interval of the image:
-30.200  35.613 (delta_t =  65.813 [sec])
Background time interval of the image:
-713.287 -695.698 (delta_t =  17.589 [sec])
-239.888 -30.200 (delta_t = 209.688 [sec])
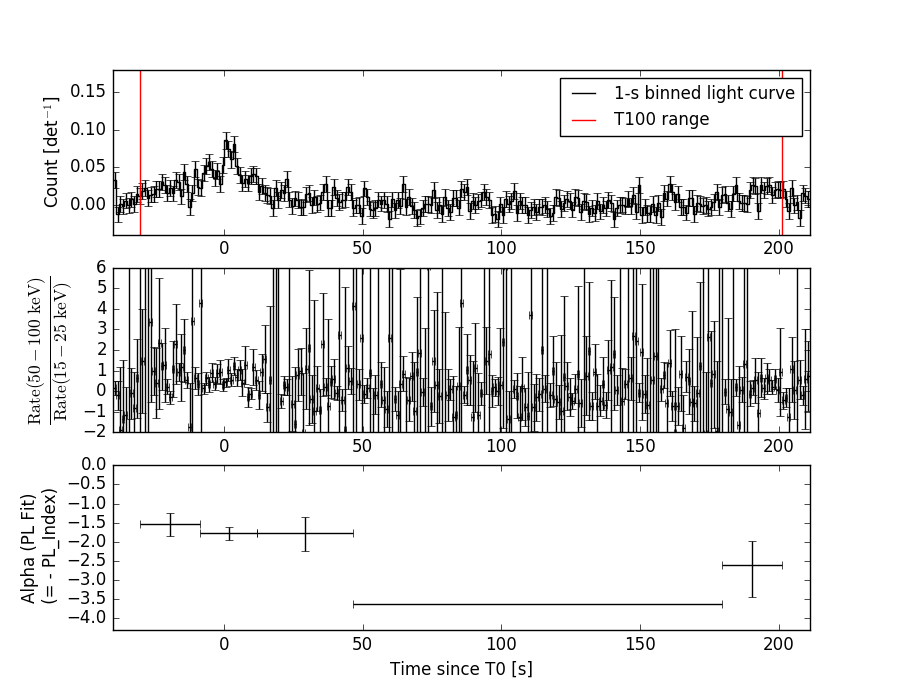
Lightcurves
Notes:
- 1) The mask-weighted light curves are using the flight position.
- 2) Multiple plots of different time binning/intervals are shown to cover all scenarios of short/long GRBs, rate/image triggers, and real/false positives.
- 3) For all the mask-weighted lightcurves, the y-axis units are counts/sec/det where a det is 0.4 x 0.4 = 0.16 sq cm.
- 4) The verticle lines correspond to following: green dotted lines are T50 interval, black dotted lines are T90 interval, blue solid line(s) is a spacecraft slew start time, and orange solid line(s) is a spacecraft slew end time.
- 5) Time of each bin is in the middle of the bin.
1 s binning
From T0-310 s to T0+310 s

From T100_start - 20 s to T100_end + 30 s
Full time interval
64 ms binning
Full time interval
From T100_start to T100_end

From T0-5 sec to T0+5 sec
16 ms binning
From T100_start-5 s to T100_start+5 s
Blue+Cyan dotted lines: Time interval of the scaled map
From 0.000000 to 4.096000
8 ms binning
From T100_start-3 s to T100_start+3 s
Blue+Cyan dotted lines: Time interval of the scaled map
From 0.000000 to 4.096000
2 ms binning
From T100_start-1 s to T100_start+1 s

Blue+Cyan dotted lines: Time interval of the scaled map
From 0.000000 to 4.096000
SN=5 or 10 sec. binning (whichever binning is satisfied first)
SN=5 or 10 sec. binning (T < 200 sec)
Quad-rate summed light curves (from T0-300s to T0+1000s)

Spectral Evolution
Spectra
Notes:
- 1) The fitting includes the systematic errors.
- 2) When the burst includes telescope slew time periods, the fitting uses an average response file made from multiple 5-s response files through out the slew time plus single time preiod for the non-slew times, and weighted by the total counts in the corresponding time period using addrmf. An average response file is needed becuase a spectral fit using the pre-slew DRM will introduce some errors in both a spectral shape and a normalization if the PHA file contains a lot of the slew/post-slew time interval.
- 3) For fits to more complicated models (e.g. a power-law over a cutoff power-law), the BAT team has decided to require a chi-square improvement of more than 6 for each extra dof.
Time averaged spectrum fit using the average DRM
Power-law model
Time interval is from  -30.200 sec. to  201.264 sec.

Spectral model in power-law:
------------------------------------------------------------
Parameters  : value       lower 90%   higher 90%
Photon index: 1.94814     ( -0.228056   0.242673 )
Norm@50keV  : 5.25385E-04    ( -8.23195e-05   7.96964e-05 )
------------------------------------------------------------
#Fit statistic : Chi-Squared =          41.41 using 59 PHA bins.
# Reduced chi-squared =         0.7265 for     57 degrees of freedom
# Null hypothesis probability =   9.400895e-01

Photon flux (15-150 keV)    in 231.5 sec: 7.69921E-02 ( -0.0088509  0.008851 ) ph/cm2/s
Energy fluence (15-150 keV)             : 1.11941e-06 ( -1.64529e-07  1.69848e-07 ) ergs/cm2
Cutoff power-law model
Time interval is from  -30.200 sec. to  201.264 sec.
Spectral model in the cutoff power-law:
------------------------------------------------------------
Parameters  : value       lower 90%   higher 90%
Photon index: 2.16285     ( -0.857529   0.0872157 )
Epeak [keV] : 67.4866      (   )
Norm@50keV  : 4.02085E-04    (     )
------------------------------------------------------------
#Fit statistic : Chi-Squared =          41.15 using 59 PHA bins.
# Reduced chi-squared =         0.7349 for     56 degrees of freedom
# Null hypothesis probability =   9.313585e-01

Photon flux (15-150 keV)    in 231.5 sec: 7.17152E-02 ( -0.0214052  0.0140112 ) ph/cm2/s
Energy fluence (15-150 keV)             : 1.09064e-06 ( -2.00021e-07  1.48532e-07 ) ergs/cm2
Band function

Time interval is from  -30.200 sec. to  201.264 sec.


Spectral model in the Band function:
------------------------------------------------------------
Parameters  : value       lower 90%   higher 90%
alpha       :    (     )
beta        :     (     )
Epeak [keV] :       (   )
Norm@50keV   :     (     )
------------------------------------------------------------

Photon flux (15-150 keV)    in  sec:  (    ) ph/cm2/s
Energy fluence (15-150 keV)             : 0 ( 0  0 ) ergs/cm2
Single BB
Spectral model blackbody:
------------------------------------------------------------
Parameters  : value    Lower 90%  Upper 90%
kT [keV]    : 9.12624  (-1.33109  1.61333)
R^2/D10^2   : 4.90282E-02  (-0.022657   0.0410769)
(R is the radius in km and D10 is the distance to the source in units of 10 kpc)
------------------------------------------------------------
#Fit statistic : Chi-Squared =          64.07 using 59 PHA bins.
# Reduced chi-squared =          1.124 for     57 degrees of freedom
# Null hypothesis probability =   2.425711e-01

Energy  Fluence     90% Error
[keV]   [erg/cm2]   [erg/cm2]
15- 25  1.854e-07   4.110e-08
25- 50  4.026e-07   6.332e-08
50-150  1.602e-07   5.759e-08
15-150  7.482e-07   1.181e-07
Thermal bremsstrahlung (OTTB)

Spectral model: thermal bremsstrahlung
------------------------------------------------------------
Parameters  : value         Lower 90%    Upper 90%
kT [keV]    : 72.7290       (-25.1473      50.769)
Norm        : 0.370111       (-0.0647226     0.083842)
------------------------------------------------------------
#Fit statistic : Chi-Squared =          43.84 using 59 PHA bins.
# Reduced chi-squared =         0.7690 for     57 degrees of freedom
# Null hypothesis probability =   8.996152e-01

Energy  Fluence     90% Error
[keV]   [erg/cm2]   [erg/cm2]
15- 25  2.207e-07   3.652e-08
25- 50  3.547e-07   4.746e-08
50-150  4.685e-07   2.240e-07
15-150  1.044e-06   2.255e-07
Double BB
Spectral model: bbodyrad<1> + bbodyrad<2>
------------------------------------------------------------
Parameters  : value         Lower 90%    Upper 90%
kT1 [keV]   : 5.75824        (-1.6177      1.71669)
R1^2/D10^2  : 0.229580        (-0.139344      0.597608)
kT2 [keV]   : 25.5597        (-9.63374      30.037)
R2^2/D10^2  : 7.97706E-04    (-0.000699787   0.00363563)
------------------------------------------------------------
#Fit statistic : Chi-Squared =          41.93 using 59 PHA bins.
# Reduced chi-squared =         0.7623 for     55 degrees of freedom
# Null hypothesis probability =   9.026068e-01

Energy  Fluence     90% Error
[keV]   [erg/cm2]   [erg/cm2]
15- 25  2.409e-07   8.819e-08
25- 50  3.193e-07   1.362e-07
50-150  5.891e-07   3.393e-07
15-150  1.149e-06   5.173e-07
Peak spectrum fit
Power-law model
Time interval is from    0.836 sec. to    1.836 sec.

Spectral model in power-law:
------------------------------------------------------------
Parameters  : value       lower 90%   higher 90%
Photon index: 1.39561     ( -0.356212   0.354674 )
Norm@50keV  : 5.60541E-03    ( -0.00116247   0.0011455 )
------------------------------------------------------------
#Fit statistic : Chi-Squared =          60.31 using 59 PHA bins.
# Reduced chi-squared =          1.058 for     57 degrees of freedom
# Null hypothesis probability =   3.570587e-01

Photon flux (15-150 keV)    in 1 sec: 0.681969 ( -0.135742  0.135864 ) ph/cm2/s
Energy fluence (15-150 keV)             : 5.42188e-08 ( -1.25415e-08  1.29009e-08 ) ergs/cm2
Cutoff power-law model

Time interval is from    0.836 sec. to    1.836 sec.
Spectral model in the cutoff power-law:
------------------------------------------------------------
Parameters  : value       lower 90%   higher 90%
Photon index: 1.39892     ( -1.22098   0.352989 )
Epeak [keV] : 9999.36      ( -9999.36 -9999.36 )
Norm@50keV  : 5.61118E-03    ( -0.00116408   0.042395 )
------------------------------------------------------------
#Fit statistic : Chi-Squared =          60.31 using 59 PHA bins.
# Reduced chi-squared =          1.077 for     56 degrees of freedom
# Null hypothesis probability =   3.227440e-01

Photon flux (15-150 keV)    in 1 sec: 0.682824 ( -0.069829  0.135611 ) ph/cm2/s
Energy fluence (15-150 keV)             : 5.43588e-08 ( -1.56945e-08  1.00552e-08 ) ergs/cm2
Band function

Time interval is from    0.836 sec. to    1.836 sec.


Spectral model in the Band function:
------------------------------------------------------------
Parameters  : value       lower 90%   higher 90%
alpha       :    (     )
beta        :     (     )
Epeak [keV] :       (   )
Norm@50keV   :     (     )
------------------------------------------------------------

Photon flux (15-150 keV)    in  sec:  (    ) ph/cm2/s
Energy fluence (15-150 keV)             : 0 ( 0  0 ) ergs/cm2
Single BB

Spectral model blackbody:
------------------------------------------------------------
Parameters  : value    Lower 90%  Upper 90%
kT [keV]    : 12.3640  (-2.68232  4.22891)
R^2/D10^2   : 0.152152  (-0.0981594   0.213755)
(R is the radius in km and D10 is the distance to the source in units of 10 kpc)
------------------------------------------------------------
#Fit statistic : Chi-Squared =          65.63 using 59 PHA bins.
# Reduced chi-squared =          1.151 for     57 degrees of freedom
# Null hypothesis probability =   2.025117e-01

Energy  Fluence     90% Error
[keV]   [erg/cm2]   [erg/cm2]
15- 25  4.929e-09   1.990e-09
25- 50  1.606e-08   6.455e-09
50-150  1.505e-08   7.364e-09
15-150  3.604e-08   1.305e-08
Thermal bremsstrahlung (OTTB)
Spectral model: thermal bremsstrahlung
------------------------------------------------------------
Parameters  : value         Lower 90%    Upper 90%
kT [keV]    : 199.363       (-103.563      -199.363)
Norm        : 2.78864       (-0.553745     0.553745)
------------------------------------------------------------
#Fit statistic : Chi-Squared =          60.83 using 59 PHA bins.
# Reduced chi-squared =          1.067 for     57 degrees of freedom
# Null hypothesis probability =   3.396721e-01

Energy  Fluence     90% Error
[keV]   [erg/cm2]   [erg/cm2]
15- 25  6.944e-09   4.045e-09
25- 50  1.336e-08   7.690e-09
50-150  2.930e-08   1.712e-08
15-150  4.960e-08   2.924e-08
Double BB

------------------------------------------------------------
Parameters  : value         Lower 90%    Upper 90%
kT1 [keV]   : 9.55784        (-2.45883      2.31108)
R1^2/D10^2  : 0.326649        (-0.174685      0.537371)
kT2 [keV]   : 199.154        (-168.008      -199.155)
R2^2/D10^2  : 1.10287E-04    (-5.15718e-05   0.00449357)
------------------------------------------------------------
#Fit statistic : Chi-Squared =          56.30 using 59 PHA bins.
#Fit statistic : Chi-Squared =          56.28 using 59 PHA bins.
# Reduced chi-squared =          1.024 for     55 degrees of freedom
# Reduced chi-squared =          1.023 for     55 degrees of freedom
# Null hypothesis probability =   4.262050e-01
# Null hypothesis probability =   4.268259e-01

Energy  Fluence     90% Error
[keV]   [erg/cm2]   [erg/cm2]
15- 25  6.010e-09   3.490e-09
25- 50  1.517e-08   8.615e-09
50-150  3.500e-08   1.105e-08
15-150  5.619e-08   2.028e-08
Pre-slew spectrum (Pre-slew PHA with pre-slew DRM)
Power-law model

Spectral model in power-law:
------------------------------------------------------------
Parameters  : value       lower 90%   higher 90%
Photon index: 1.67470     ( -0.157633   0.160674 )
Norm@50keV  : 1.57548E-03    ( -0.000146604   0.000144172 )
------------------------------------------------------------
#Fit statistic : Chi-Squared =          55.25 using 59 PHA bins.
# Reduced chi-squared =         0.9692 for     57 degrees of freedom
# Null hypothesis probability =   5.411085e-01

Photon flux (15-150 keV)    in 65.81 sec: 0.207426 ( -0.0170875  0.0171034 ) ph/cm2/s
Energy fluence (15-150 keV)             : 9.62017e-07 ( -9.5027e-08  9.65367e-08 ) ergs/cm2
Cutoff power-law model
Spectral model in the cutoff power-law:
------------------------------------------------------------
Parameters  : value       lower 90%   higher 90%
Photon index: 1.68143     ( -0.212142   0.155981 )
Epeak [keV] : 9999.36      ( -9999.35 -9999.36 )
Norm@50keV  : 1.57024E-03    ( -0.00157598   0.000771728 )
------------------------------------------------------------
#Fit statistic : Chi-Squared =          55.27 using 59 PHA bins.
# Reduced chi-squared =         0.9869 for     56 degrees of freedom
# Null hypothesis probability =   5.025683e-01

Photon flux (15-150 keV)    in 65.81 sec: 0.207550 ( -0.01728  0.016955 ) ph/cm2/s
Energy fluence (15-150 keV)             : 9.56463e-07 ( -8.94358e-08  9.96232e-08 ) ergs/cm2
Band function

Spectral model in the Band function:
------------------------------------------------------------
Parameters  : value       lower 90%   higher 90%
alpha       :    (     )
beta        :     (     )
Epeak [keV] :       (   )
Norm@50keV   :     (     )
------------------------------------------------------------

Photon flux (15-150 keV)    in  sec:  (    ) ph/cm2/s
Energy fluence (15-150 keV)             : 0 ( 0  0 ) ergs/cm2
S(25-50 keV) vs. S(50-100 keV) plot

S(25-50 keV)  = 3.31e-07
S(50-100 keV) = 3.45e-07
T90 vs. Hardness ratio plot
T90                                   = 220.251999914646 sec.
Hardness ratio (energy fluence ratio) = 1.0423
Color vs. Color plot

Count Ratio  (25-50 keV) / (15-25 keV) = 1.04329
Count Ratio (50-100 keV) / (15-25 keV) = 0.552639
Mask shadow pattern
IMX = -2.182161826913611E-01, IMY = -7.669959570072656E-02
TIME vs. PHA plot around the trigger time
Blue+Cyan dotted lines: Time interval of the scaled map
From 0.000000 to 4.096000
TIME vs. DetID plot around the trigger time
Blue+Cyan dotted lines: Time interval of the scaled map
From 0.000000 to 4.096000
100 us light curve (15-350 keV)
Blue+Cyan dotted lines: Time interval of the scaled map
From 0.000000 to 4.096000
Spacecraft aspect plot

Bright source in the pre-burst/pre-slew/post-slew images
Pre-burst image of 15-350 keV band
Time interval of the image:
-713.287400 -695.698000
-239.888000 -30.200000

# RAcent  DECcent POSerr Theta    Phi  PeakCts   SNR AngSep     Name
#  [deg]    [deg]    ['] [deg]  [deg]                   [']
143.8059  34.9781    2.0  18.1 -123.4   1.1583   5.6 ------	UNKNOWN
133.3504  19.0137    3.0  34.3 -144.8   1.0514   3.8 ------	UNKNOWN
111.1831  67.9066    2.7  42.0  -57.4   2.5273   4.3 ------	UNKNOWN
Pre-slew background subtracted image of 15-350 keV band
Time interval of the image:
-30.200000 35.612590

# RAcent  DECcent POSerr Theta    Phi  PeakCts   SNR AngSep     Name
#  [deg]    [deg]    ['] [deg]  [deg]                   [']
163.4295  25.3803    0.7  13.0  160.6   1.6840  17.4 ------	UNKNOWN
149.7552   4.6811    2.0  36.7  178.0   0.7548   5.7 ------	UNKNOWN
 35.4355  86.7251    2.6  54.0  -33.1   1.9432   4.4 ------	UNKNOWN
Post-slew image of 15-350 keV band
Time interval of the image:
69.612600 842.412000

# RAcent  DECcent POSerr Theta    Phi  PeakCts   SNR AngSep     Name
#  [deg]    [deg]    ['] [deg]  [deg]                   [']
168.5369  70.5613    2.7  45.3  -22.8   2.8551   4.3 ------	UNKNOWN
123.6059  -4.6699    3.1  49.0 -147.3   3.6305   3.8 ------	UNKNOWN
116.7462   7.2234    3.5  48.0 -129.0   6.1319   3.3 ------	UNKNOWN
Plot creation:
Wed Jun  7 18:01:36 EDT 2017