Estimated redshift from machine learning (Ukwatta et al. 2016) - may take a few minute to calcaulte
Image
Pre-slew 15.0-350.0 keV image (Event data)
#   RAcent    DECcent   POSerr    Theta     Phi              Peak Cts       SNR   Name
  319.4889    48.6042   0.0176    10.9843   -77.4637         0.0549190     10.927 TRIG_00754322

Foreground time interval of the image:
  0.000   0.120 (delta_t =   0.120 [sec])
Background time interval of the image:
-239.620   0.000 (delta_t = 239.620 [sec])
Lightcurves
Notes:
- 1) The mask-weighted light curves are using the flight position.
- 2) Multiple plots of different time binning/intervals are shown to cover all scenarios of short/long GRBs, rate/image triggers, and real/false positives.
- 3) For all the mask-weighted lightcurves, the y-axis units are counts/sec/det where a det is 0.4 x 0.4 = 0.16 sq cm.
- 4) The verticle lines correspond to following: green dotted lines are T50 interval, black dotted lines are T90 interval, blue solid line(s) is a spacecraft slew start time, and orange solid line(s) is a spacecraft slew end time.
- 5) Time of each bin is in the middle of the bin.
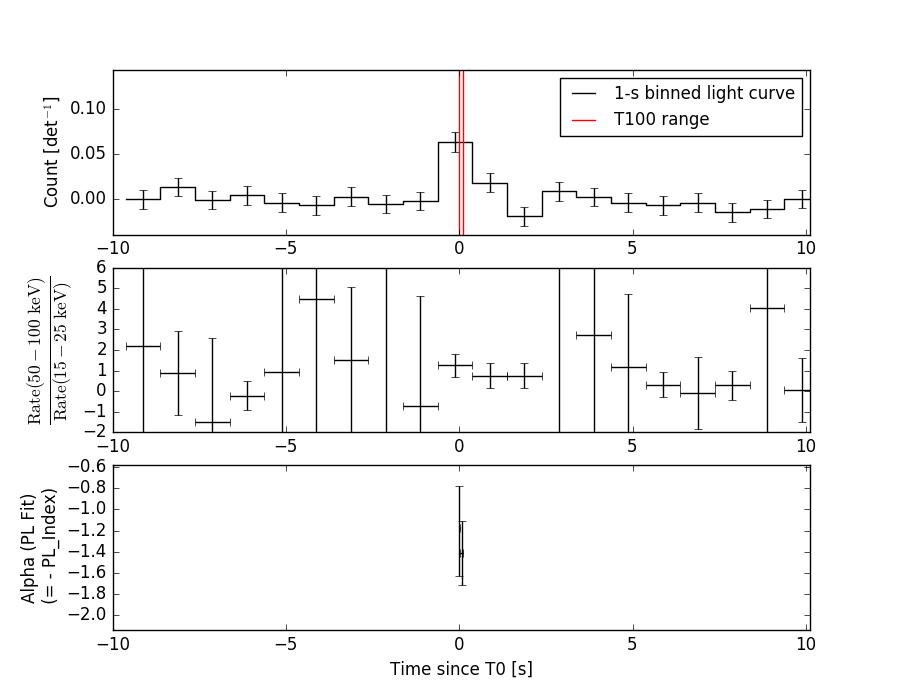
1 s binning
From T0-310 s to T0+310 s
From T100_start - 20 s to T100_end + 30 s
Full time interval

64 ms binning
Full time interval

From T100_start to T100_end
From T0-5 sec to T0+5 sec

16 ms binning
From T100_start-5 s to T100_start+5 s
Blue+Cyan dotted lines: Time interval of the scaled map
From 0.000000 to 0.064000
8 ms binning
From T100_start-3 s to T100_start+3 s

Blue+Cyan dotted lines: Time interval of the scaled map
From 0.000000 to 0.064000
2 ms binning
From T100_start-1 s to T100_start+1 s

Blue+Cyan dotted lines: Time interval of the scaled map
From 0.000000 to 0.064000
SN=5 or 10 sec. binning (whichever binning is satisfied first)
SN=5 or 10 sec. binning (T < 200 sec)

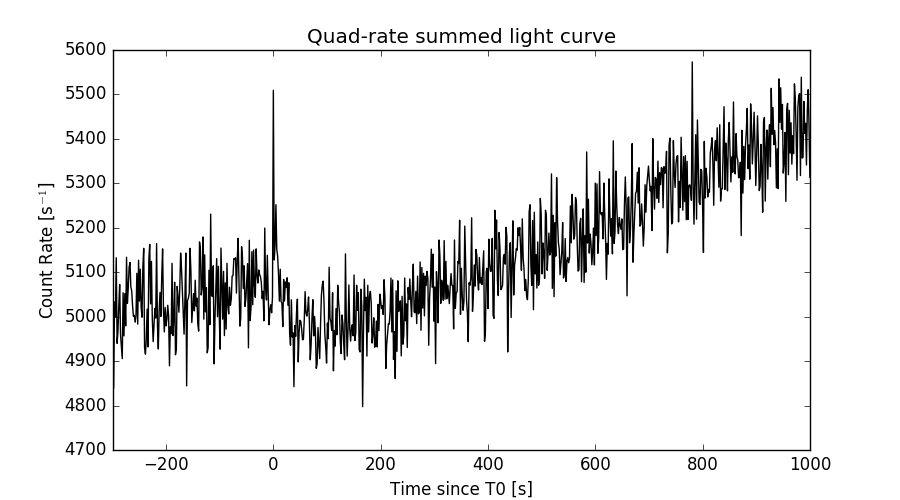
Quad-rate summed light curves (from T0-300s to T0+1000s)
Spectral Evolution
Spectra
Notes:
- 1) The fitting includes the systematic errors.
- 2) When the burst includes telescope slew time periods, the fitting uses an average response file made from multiple 5-s response files through out the slew time plus single time preiod for the non-slew times, and weighted by the total counts in the corresponding time period using addrmf. An average response file is needed becuase a spectral fit using the pre-slew DRM will introduce some errors in both a spectral shape and a normalization if the PHA file contains a lot of the slew/post-slew time interval.
- 3) For fits to more complicated models (e.g. a power-law over a cutoff power-law), the BAT team has decided to require a chi-square improvement of more than 6 for each extra dof.
Time averaged spectrum fit using the average DRM
Power-law model

Time interval is from    0.000 sec. to    0.120 sec.

Spectral model in power-law:
------------------------------------------------------------
Parameters  : value       lower 90%   higher 90%
Photon index: 1.06933     ( -0.24083   0.235145 )
Norm@50keV  : 2.96098E-02    ( -0.00446625   0.00445842 )
------------------------------------------------------------
#Fit statistic : Chi-Squared =          47.68 using 59 PHA bins.
# Reduced chi-squared =         0.8365 for     57 degrees of freedom
# Null hypothesis probability =   8.057291e-01

Photon flux (15-150 keV)    in 0.12 sec: 3.42505 ( -0.52443  0.52491 ) ph/cm2/s
Energy fluence (15-150 keV)             : 3.75251e-08 ( -6.16182e-09  6.18798e-09 ) ergs/cm2
Cutoff power-law model

Time interval is from    0.000 sec. to    0.120 sec.
Spectral model in the cutoff power-law:
------------------------------------------------------------
Parameters  : value       lower 90%   higher 90%
Photon index: 0.455252     ( -1.18131   0.728196 )
Epeak [keV] : 142.215      ( -60.009 -142.215 )
Norm@50keV  : 5.70185E-02    ( -0.0305133   0.1264 )
------------------------------------------------------------
#Fit statistic : Chi-Squared =          46.45 using 59 PHA bins.
# Reduced chi-squared =         0.8295 for     56 degrees of freedom
# Null hypothesis probability =   8.147032e-01

Photon flux (15-150 keV)    in 0.12 sec: 3.39630 ( -0.52951  0.52851 ) ph/cm2/s
Energy fluence (15-150 keV)             : 3.69991e-08 ( -3.58567e-09  6.33612e-09 ) ergs/cm2
Band function

Time interval is from    0.000 sec. to    0.120 sec.


Spectral model in the Band function:
------------------------------------------------------------
Parameters  : value       lower 90%   higher 90%
alpha       :    (     )
beta        :     (     )
Epeak [keV] :       (   )
Norm@50keV   :     (     )
------------------------------------------------------------

Photon flux (15-150 keV)    in  sec:  (    ) ph/cm2/s
Energy fluence (15-150 keV)             : 0 ( 0  0 ) ergs/cm2
Single BB
Spectral model blackbody:
------------------------------------------------------------
Parameters  : value    Lower 90%  Upper 90%
kT [keV]    : 21.0879  (-3.51882  4.45734)
R^2/D10^2   : 0.145307  (-0.0671028   0.115893)
(R is the radius in km and D10 is the distance to the source in units of 10 kpc)
------------------------------------------------------------
#Fit statistic : Chi-Squared =          51.91 using 59 PHA bins.
# Reduced chi-squared =         0.9106 for     57 degrees of freedom
# Null hypothesis probability =   6.660846e-01

Energy  Fluence     90% Error
[keV]   [erg/cm2]   [erg/cm2]
15- 25  1.462e-09   4.618e-10
25- 50  7.536e-09   2.065e-09
50-150  2.499e-08   7.110e-09
15-150  3.399e-08   8.022e-09
Thermal bremsstrahlung (OTTB)
Spectral model: thermal bremsstrahlung
------------------------------------------------------------
Parameters  : value         Lower 90%    Upper 90%
kT [keV]    : 200.000       (-39.0602      -200)
Norm        : 13.7259       (-2.15653     2.15653)
------------------------------------------------------------
#Fit statistic : Chi-Squared =          57.83 using 59 PHA bins.
# Reduced chi-squared =          1.015 for     57 degrees of freedom
# Null hypothesis probability =   4.442846e-01

Energy  Fluence     90% Error
[keV]   [erg/cm2]   [erg/cm2]
15- 25  4.101e-09   2.349e-09
25- 50  7.889e-09   4.390e-09
50-150  1.730e-08   9.780e-09
15-150  2.929e-08   1.669e-08
Double BB

Spectral model: bbodyrad<1> + bbodyrad<2>
------------------------------------------------------------
Parameters  : value         Lower 90%    Upper 90%
kT1 [keV]   : 5.83958        (-2.94326      72.6143)
R1^2/D10^2  : 3.74386        (-3.44576      19.9994)
kT2 [keV]   : 25.9529        (-5.74192      25.1514)
R2^2/D10^2  : 6.73565E-02    (-0.064796   0.0790084)
------------------------------------------------------------
#Fit statistic : Chi-Squared =          45.99 using 59 PHA bins.
# Reduced chi-squared =         0.8362 for     55 degrees of freedom
# Null hypothesis probability =   8.013341e-01

Energy  Fluence     90% Error
[keV]   [erg/cm2]   [erg/cm2]
15- 25  2.883e-09   1.649e-09
25- 50  7.195e-09   3.125e-09
50-150  2.674e-08   1.503e-08
15-150  3.682e-08   1.742e-08
Peak spectrum fit
Power-law model
Time interval is from   -0.438 sec. to    0.562 sec.

Spectral model in power-law:
------------------------------------------------------------
Parameters  : value       lower 90%   higher 90%
Photon index: 1.30088     ( -0.431071   0.42631 )
Norm@50keV  : 4.26771E-03    ( -0.00113987   0.00113765 )
------------------------------------------------------------
#Fit statistic : Chi-Squared =          57.48 using 59 PHA bins.
# Reduced chi-squared =          1.009 for     57 degrees of freedom
# Null hypothesis probability =   4.571065e-01

Photon flux (15-150 keV)    in 1 sec: 0.509244 ( -0.137587  0.138067 ) ph/cm2/s
Energy fluence (15-150 keV)             : 4.21677e-08 ( -1.22375e-08  1.24861e-08 ) ergs/cm2
Cutoff power-law model
Time interval is from   -0.438 sec. to    0.562 sec.
Spectral model in the cutoff power-law:
------------------------------------------------------------
Parameters  : value       lower 90%   higher 90%
Photon index: -0.361456     ( -3.4259   1.82371 )
Epeak [keV] : 74.0713      ( -19.8763 -74.0714 )
Norm@50keV  : 2.71941E-02    ( -0.0271939   0.758801 )
------------------------------------------------------------
#Fit statistic : Chi-Squared =          55.47 using 59 PHA bins.
# Reduced chi-squared =         0.9905 for     56 degrees of freedom
# Null hypothesis probability =   4.949623e-01

Photon flux (15-150 keV)    in 1 sec: 0.481666 ( -0.143446  0.143084 ) ph/cm2/s
Energy fluence (15-150 keV)             : 3.86242e-08 ( -1.21691e-08  1.31699e-08 ) ergs/cm2
Band function

Time interval is from   -0.438 sec. to    0.562 sec.


Spectral model in the Band function:
------------------------------------------------------------
Parameters  : value       lower 90%   higher 90%
alpha       :    (     )
beta        :     (     )
Epeak [keV] :       (   )
Norm@50keV   :     (     )
------------------------------------------------------------

Photon flux (15-150 keV)    in  sec:  (    ) ph/cm2/s
Energy fluence (15-150 keV)             : 0 ( 0  0 ) ergs/cm2
Single BB
Spectral model blackbody:
------------------------------------------------------------
Parameters  : value    Lower 90%  Upper 90%
kT [keV]    : 17.2029  (-4.16269  5.76391)
R^2/D10^2   : 4.04322E-02  (-0.0255605   0.0627343)
(R is the radius in km and D10 is the distance to the source in units of 10 kpc)
------------------------------------------------------------
#Fit statistic : Chi-Squared =          55.84 using 59 PHA bins.
# Reduced chi-squared =         0.9797 for     57 degrees of freedom
# Null hypothesis probability =   5.185531e-01

Energy  Fluence     90% Error
[keV]   [erg/cm2]   [erg/cm2]
15- 25  2.429e-09   1.260e-09
25- 50  1.085e-08   5.845e-09
50-150  2.301e-08   1.371e-08
15-150  3.628e-08   1.911e-08
Thermal bremsstrahlung (OTTB)
Spectral model: thermal bremsstrahlung
------------------------------------------------------------
Parameters  : value         Lower 90%    Upper 90%
kT [keV]    : 199.363       (-105.729      -199.363)
Norm        : 2.11947       (-0.565291     0.565286)
------------------------------------------------------------
#Fit statistic : Chi-Squared =          57.77 using 59 PHA bins.
# Reduced chi-squared =          1.013 for     57 degrees of freedom
# Null hypothesis probability =   4.466431e-01

Energy  Fluence     90% Error
[keV]   [erg/cm2]   [erg/cm2]
15- 25  5.278e-09   3.256e-09
25- 50  1.015e-08   6.105e-09
50-150  2.227e-08   1.349e-08
15-150  3.770e-08   2.264e-08
Double BB

Spectral model: bbodyrad<1> + bbodyrad<2>
------------------------------------------------------------
Parameters  : value         Lower 90%    Upper 90%
kT1 [keV]   : 5.02444        (-5.10453      -5.10453)
R1^2/D10^2  : 0.701001        (-0.68886      -0.68886)
kT2 [keV]   : 19.0179        (-5.44498      -19.0282)
R2^2/D10^2  : 2.67611E-02    (-0.0266876   0.0635411)
------------------------------------------------------------
#Fit statistic : Chi-Squared =          55.13 using 59 PHA bins.
# Reduced chi-squared =          1.002 for     55 degrees of freedom
# Null hypothesis probability =   4.696108e-01

Energy  Fluence     90% Error
[keV]   [erg/cm2]   [erg/cm2]
15- 25  3.640e-09   2.285e-09
25- 50  1.030e-08   6.065e-09
50-150  2.438e-08   1.552e-08
15-150  3.833e-08   2.239e-08
Pre-slew spectrum (Pre-slew PHA with pre-slew DRM)
Power-law model
Spectral model in power-law:
------------------------------------------------------------
Parameters  : value       lower 90%   higher 90%
Photon index: 1.06933     ( -0.24083   0.235145 )
Norm@50keV  : 2.96098E-02    ( -0.00446625   0.00445842 )
------------------------------------------------------------
#Fit statistic : Chi-Squared =          47.68 using 59 PHA bins.
# Reduced chi-squared =         0.8365 for     57 degrees of freedom
# Null hypothesis probability =   8.057291e-01

Photon flux (15-150 keV)    in 0.12 sec: 3.42508 ( -0.524391  0.524862 ) ph/cm2/s
Energy fluence (15-150 keV)             : 3.75214e-08 ( -6.16084e-09  6.19042e-09 ) ergs/cm2
Cutoff power-law model

Spectral model in the cutoff power-law:
------------------------------------------------------------
Parameters  : value       lower 90%   higher 90%
Photon index: 0.455251     ( -1.18131   0.728197 )
Epeak [keV] : 142.215      ( -60.009 -142.215 )
Norm@50keV  : 5.70185E-02    ( -0.0305133   0.1264 )
------------------------------------------------------------
#Fit statistic : Chi-Squared =          46.45 using 59 PHA bins.
# Reduced chi-squared =         0.8295 for     56 degrees of freedom
# Null hypothesis probability =   8.147032e-01

Photon flux (15-150 keV)    in 0.12 sec: 3.39619 ( -0.52938  0.52844 ) ph/cm2/s
Energy fluence (15-150 keV)             : 3.7016e-08 ( -6.38508e-09  6.34596e-09 ) ergs/cm2
Band function
Spectral model in the Band function:
------------------------------------------------------------
Parameters  : value       lower 90%   higher 90%
alpha       :    (     )
beta        :     (     )
Epeak [keV] :       (   )
Norm@50keV   :     (     )
------------------------------------------------------------

Photon flux (15-150 keV)    in  sec:  (    ) ph/cm2/s
Energy fluence (15-150 keV)             : 0 ( 0  0 ) ergs/cm2
S(25-50 keV) vs. S(50-100 keV) plot
S(25-50 keV)  = 7.27e-09
S(50-100 keV) = 1.38e-08
T90 vs. Hardness ratio plot

T90                                   = 0.1039999127388 sec.
Hardness ratio (energy fluence ratio) = 1.89821
Color vs. Color plot

Count Ratio  (25-50 keV) / (15-25 keV) = 1.56978
Count Ratio (50-100 keV) / (15-25 keV) = 1.87698
Mask shadow pattern
IMX = 4.213017554193794E-02, IMY = 1.894690431926533E-01
TIME vs. PHA plot around the trigger time
Blue+Cyan dotted lines: Time interval of the scaled map
From 0.000000 to 0.064000
TIME vs. DetID plot around the trigger time
Blue+Cyan dotted lines: Time interval of the scaled map
From 0.000000 to 0.064000
100 us light curve (15-350 keV)
Blue+Cyan dotted lines: Time interval of the scaled map
From 0.000000 to 0.064000
Spacecraft aspect plot

Bright source in the pre-burst/pre-slew/post-slew images
Pre-burst image of 15-350 keV band
Time interval of the image:
-239.620000 0.000000

# RAcent  DECcent POSerr Theta    Phi  PeakCts   SNR AngSep     Name
#  [deg]    [deg]    ['] [deg]  [deg]                   [']
254.5052  35.3115    8.2  39.3  138.7   0.7064   1.4    3.0	Her X-1
288.6332  10.9534   10.9  35.8   71.9   0.5218   1.1    9.7	GRS 1915+105
299.5890  35.1894    0.3   9.6   71.7   6.8579  33.5    0.7	Cyg X-1
308.0372  40.8619    1.7   3.6    6.7   1.3059   6.6    6.4	Cyg X-3
326.1890  38.1578   16.0  16.8  -34.2  -0.1564  -0.7    9.9	Cyg X-2
  4.8084  35.8051    3.4  45.5  -57.8   4.0924   3.4 ------	UNKNOWN
 25.6364  78.9779    2.8  45.4 -121.3   3.9102   4.1 ------	UNKNOWN
Pre-slew background subtracted image of 15-350 keV band
Time interval of the image:
0.000000 0.120000

# RAcent  DECcent POSerr Theta    Phi  PeakCts   SNR AngSep     Name
#  [deg]    [deg]    ['] [deg]  [deg]                   [']
254.4608  35.3816   39.7  39.3  138.8   0.0030   0.3    2.4	Her X-1
288.8001  10.7635    0.0  36.0   71.5   0.0328   3.0   10.9	GRS 1915+105
299.5974  34.9920    0.0   9.8   71.2  -0.0055  -1.0   12.6	Cyg X-1
307.9891  40.8302   17.0   3.6    7.5  -0.0032  -0.7    9.2	Cyg X-3
326.4208  38.2653    0.0  16.9  -34.8  -0.0105  -2.1   12.2	Cyg X-2
319.4889  48.6041    1.1  11.0  -77.5   0.0549  10.9 ------	UNKNOWN
Post-slew image of 15-350 keV band
Time interval of the image:
44.480620 839.352100
840.380000 962.420000

# RAcent  DECcent POSerr Theta    Phi  PeakCts   SNR AngSep     Name
#  [deg]    [deg]    ['] [deg]  [deg]                   [']
299.5843  35.1938    0.3  19.8   78.1  26.7043  35.6    0.6	Cyg X-1
308.1190  40.9706    1.2  11.0   73.9   5.8948   9.7    1.2	Cyg X-3
326.2030  38.4351    4.8  11.3   -5.1   1.5685   2.4    7.0	Cyg X-2
326.2812  -1.7234    3.6  50.6   14.3   5.3138   3.3 ------	UNKNOWN
315.7389  35.4166    3.1  13.4   36.2   2.2707   3.7 ------	UNKNOWN
355.6049   2.6826    3.1  55.3  -22.6   9.3809   3.7  308.9	UNKNOWN
129.9833  76.0688    3.4  55.2 -154.1  12.9481   3.4 ------	UNKNOWN
 57.7764  69.5567    3.4  48.0 -129.1  13.0347   3.4 ------	UNKNOWN
 45.2096  65.4719    2.9  45.4 -121.3  13.2326   4.0 ------	UNKNOWN
Plot creation:
Thu Jun 22 11:39:11 EDT 2017