Estimated redshift from machine learning (Ukwatta et al. 2016) - may take a few minute to calcaulte
Image
Pre-slew 15.0-350.0 keV image (Event data)
#   RAcent    DECcent   POSerr    Theta     Phi              Peak Cts       SNR   Name
  121.2176   -14.0162   0.0219    16.0180  -132.1513         0.9843636      8.765 TRIG_00755343

Foreground time interval of the image:
-13.244  25.796 (delta_t =  39.040 [sec])
Background time interval of the image:
-119.000 -13.244 (delta_t = 105.756 [sec])
Lightcurves
Notes:
- 1) The mask-weighted light curves are using the flight position.
- 2) Multiple plots of different time binning/intervals are shown to cover all scenarios of short/long GRBs, rate/image triggers, and real/false positives.
- 3) For all the mask-weighted lightcurves, the y-axis units are counts/sec/det where a det is 0.4 x 0.4 = 0.16 sq cm.
- 4) The verticle lines correspond to following: green dotted lines are T50 interval, black dotted lines are T90 interval, blue solid line(s) is a spacecraft slew start time, and orange solid line(s) is a spacecraft slew end time.
- 5) Time of each bin is in the middle of the bin.
1 s binning
From T0-310 s to T0+310 s
From T100_start - 20 s to T100_end + 30 s

Full time interval

64 ms binning
Full time interval
From T100_start to T100_end

From T0-5 sec to T0+5 sec

16 ms binning
From T100_start-5 s to T100_start+5 s

Blue+Cyan dotted lines: Time interval of the scaled map
From 0.000000 to 64.000000
8 ms binning
From T100_start-3 s to T100_start+3 s
Blue+Cyan dotted lines: Time interval of the scaled map
From 0.000000 to 64.000000
2 ms binning
From T100_start-1 s to T100_start+1 s

Blue+Cyan dotted lines: Time interval of the scaled map
From 0.000000 to 64.000000
SN=5 or 10 sec. binning (whichever binning is satisfied first)

SN=5 or 10 sec. binning (T < 200 sec)
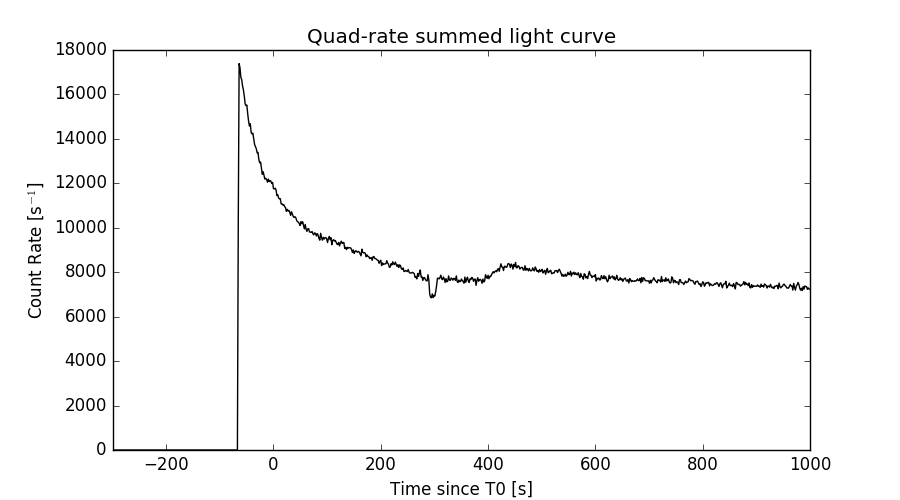
Quad-rate summed light curves (from T0-300s to T0+1000s)
Spectral Evolution

Spectra
Notes:
- 1) The fitting includes the systematic errors.
- 2) When the burst includes telescope slew time periods, the fitting uses an average response file made from multiple 5-s response files through out the slew time plus single time preiod for the non-slew times, and weighted by the total counts in the corresponding time period using addrmf. An average response file is needed becuase a spectral fit using the pre-slew DRM will introduce some errors in both a spectral shape and a normalization if the PHA file contains a lot of the slew/post-slew time interval.
- 3) For fits to more complicated models (e.g. a power-law over a cutoff power-law), the BAT team has decided to require a chi-square improvement of more than 6 for each extra dof.
Time averaged spectrum fit using the average DRM
Power-law model

Time interval is from  -13.244 sec. to   25.796 sec.

Spectral model in power-law:
------------------------------------------------------------
Parameters  : value       lower 90%   higher 90%
Photon index: 1.21744     ( -0.279872   0.275695 )
Norm@50keV  : 1.90562E-03    ( -0.000259102   0.000258463 )
------------------------------------------------------------
#Fit statistic : Chi-Squared =          57.89 using 59 PHA bins.
# Reduced chi-squared =          1.016 for     57 degrees of freedom
# Null hypothesis probability =   4.422032e-01

Photon flux (15-150 keV)    in 39.04 sec: 0.224247 ( -0.031114  0.031267 ) ph/cm2/s
Energy fluence (15-150 keV)             : 7.51188e-07 ( -1.18733e-07  1.20819e-07 ) ergs/cm2
Cutoff power-law model
Time interval is from  -13.244 sec. to   25.796 sec.
Spectral model in the cutoff power-law:
------------------------------------------------------------
Parameters  : value       lower 90%   higher 90%
Photon index: 2.14785     ( -1.24813   0.69212 )
Epeak [keV] : 53.3538      (   )
Norm@50keV  : 5.90396E-04    (     )
------------------------------------------------------------
#Fit statistic : Chi-Squared =          56.70 using 59 PHA bins.
# Reduced chi-squared =          1.012 for     56 degrees of freedom
# Null hypothesis probability =   4.488946e-01

Photon flux (15-150 keV)    in 39.04 sec: 0.224226 ( -0.031198  0.031203 ) ph/cm2/s
Energy fluence (15-150 keV)             : 7.50396e-07 ( -1.18377e-07  1.21129e-07 ) ergs/cm2
Band function

Time interval is from  -13.244 sec. to   25.796 sec.


Spectral model in the Band function:
------------------------------------------------------------
Parameters  : value       lower 90%   higher 90%
alpha       :    (     )
beta        :     (     )
Epeak [keV] :       (   )
Norm@50keV   :     (     )
------------------------------------------------------------

Photon flux (15-150 keV)    in  sec:  (    ) ph/cm2/s
Energy fluence (15-150 keV)             : 0 ( 0  0 ) ergs/cm2
Single BB
Spectral model blackbody:
------------------------------------------------------------
Parameters  : value    Lower 90%  Upper 90%
kT [keV]    : 21.1435  (-4.28402  5.79525)
R^2/D10^2   : 8.21214E-03  (-0.00428404   0.00869467)
(R is the radius in km and D10 is the distance to the source in units of 10 kpc)
------------------------------------------------------------
#Fit statistic : Chi-Squared =          76.59 using 59 PHA bins.
# Reduced chi-squared =          1.344 for     57 degrees of freedom
# Null hypothesis probability =   4.272877e-02

Energy  Fluence     90% Error
[keV]   [erg/cm2]   [erg/cm2]
15- 25  2.700e-08   8.643e-09
25- 50  1.394e-07   3.117e-08
50-150  4.646e-07   1.215e-07
15-150  6.310e-07   1.638e-07
Thermal bremsstrahlung (OTTB)
Spectral model: thermal bremsstrahlung
------------------------------------------------------------
Parameters  : value         Lower 90%    Upper 90%
kT [keV]    : 200.000       (-50.7075      -200)
Norm        : 0.917994       (-0.126813     0.126813)
------------------------------------------------------------
#Fit statistic : Chi-Squared =          63.59 using 59 PHA bins.
# Reduced chi-squared =          1.116 for     57 degrees of freedom
# Null hypothesis probability =   2.555345e-01

Energy  Fluence     90% Error
[keV]   [erg/cm2]   [erg/cm2]
15- 25  8.924e-08   4.983e-08
25- 50  1.717e-07   9.674e-08
50-150  3.765e-07   2.083e-07
15-150  6.374e-07   3.531e-07
Double BB
Spectral model: bbodyrad<1> + bbodyrad<2>
------------------------------------------------------------
Parameters  : value         Lower 90%    Upper 90%
kT1 [keV]   : 5.31978        (-1.79979      2.3377)
R1^2/D10^2  : 0.638932        (-0.484542      1.93038)
kT2 [keV]   : 32.8183        (-8.96452      21.3191)
R2^2/D10^2  : 1.94580E-03    (-0.00142447   0.00317033)
------------------------------------------------------------
#Fit statistic : Chi-Squared =          55.10 using 59 PHA bins.
# Reduced chi-squared =          1.002 for     55 degrees of freedom
# Null hypothesis probability =   4.709867e-01

Energy  Fluence     90% Error
[keV]   [erg/cm2]   [erg/cm2]
15- 25  8.934e-08   4.805e-08
25- 50  1.359e-07   5.709e-08
50-150  5.676e-07   2.894e-07
15-150  7.928e-07   3.644e-07
Peak spectrum fit
Power-law model
Time interval is from   -4.316 sec. to   -3.316 sec.

Spectral model in power-law:
------------------------------------------------------------
Parameters  : value       lower 90%   higher 90%
Photon index: -2.10194     ( -0.720059   2.33913 )
Norm@50keV  : 2.86290E-04    ( -0.000290132   0.0035707 )
------------------------------------------------------------
#Fit statistic : Chi-Squared =          65.38 using 59 PHA bins.
# Reduced chi-squared =          1.147 for     57 degrees of freedom
# Null hypothesis probability =   2.087096e-01

Photon flux (15-150 keV)    in 1 sec: 0.408909 ( -0.408909  0.074177 ) ph/cm2/s
Energy fluence (15-150 keV)             : 5.70637e-08 ( -2.15038e-08  2.07991e-08 ) ergs/cm2
Cutoff power-law model

Time interval is from   -4.316 sec. to   -3.316 sec.
Spectral model in the cutoff power-law:
------------------------------------------------------------
Parameters  : value       lower 90%   higher 90%
Photon index: -3.27315     (     )
Epeak [keV] : 9568.00      (   )
Norm@50keV  : 5.39512E-05    (     )
------------------------------------------------------------
#Fit statistic : Chi-Squared =          65.37 using 59 PHA bins.
# Reduced chi-squared =          1.167 for     56 degrees of freedom
# Null hypothesis probability =   1.833258e-01

Photon flux (15-150 keV)    in 1 sec:  (    ) ph/cm2/s
Energy fluence (15-150 keV)             : 5.68617e-08 ( -2.1413e-08  2.06666e-08 ) ergs/cm2
Band function

Time interval is from   -4.316 sec. to   -3.316 sec.


Spectral model in the Band function:
------------------------------------------------------------
Parameters  : value       lower 90%   higher 90%
alpha       :    (     )
beta        :     (     )
Epeak [keV] :       (   )
Norm@50keV   :     (     )
------------------------------------------------------------

Photon flux (15-150 keV)    in  sec:  (    ) ph/cm2/s
Energy fluence (15-150 keV)             : 0 ( 0  0 ) ergs/cm2
Single BB
Spectral model blackbody:
------------------------------------------------------------
Parameters  : value    Lower 90%  Upper 90%
kT [keV]    : 200.000  (-200  -200)
R^2/D10^2   : 2.04347E-04  (-7.48506e-05   -0.000204452)
(R is the radius in km and D10 is the distance to the source in units of 10 kpc)
------------------------------------------------------------
#Fit statistic : Chi-Squared =          68.19 using 59 PHA bins.
# Reduced chi-squared =          1.196 for     57 degrees of freedom
# Null hypothesis probability =   1.473559e-01

Energy  Fluence     90% Error
[keV]   [erg/cm2]   [erg/cm2]
15- 25  3.463e-10   2.650e-10
25- 50  2.785e-09   2.056e-09
50-150  5.391e-08   5.475e-08
15-150  5.704e-08   5.960e-08
Thermal bremsstrahlung (OTTB)
Spectral model: thermal bremsstrahlung
------------------------------------------------------------
Parameters  : value         Lower 90%    Upper 90%
kT [keV]    : 199.362       (-123.466      -199.363)
Norm        : 1.85411       (-0.788435     0.788396)
------------------------------------------------------------
#Fit statistic : Chi-Squared =          73.39 using 59 PHA bins.
# Reduced chi-squared =          1.287 for     57 degrees of freedom
# Null hypothesis probability =   7.085450e-02

Energy  Fluence     90% Error
[keV]   [erg/cm2]   [erg/cm2]
15- 25  4.617e-09   3.191e-09
25- 50  8.881e-09   5.835e-09
50-150  1.948e-08   1.255e-08
15-150  3.298e-08   2.145e-08
Double BB
Spectral model: bbodyrad<1> + bbodyrad<2>
------------------------------------------------------------
Parameters  : value         Lower 90%    Upper 90%
kT1 [keV]   : 6.17901        (-4.12437      5.73847)
R1^2/D10^2  : 0.775470        (-0.759993      1.48518)
kT2 [keV]   : 199.363        (-199.363      -199.363)
R2^2/D10^2  : 1.90059E-04    (-7.57763e-05   0.00113076)
------------------------------------------------------------
#Fit statistic : Chi-Squared =          63.89 using 59 PHA bins.
# Reduced chi-squared =          1.162 for     55 degrees of freedom
# Null hypothesis probability =   1.924356e-01

Energy  Fluence     90% Error
[keV]   [erg/cm2]   [erg/cm2]
15- 25  4.342e-09   2.910e-09
25- 50  6.422e-09   3.714e-09
50-150  5.077e-08   2.119e-08
15-150  6.154e-08   2.121e-08
Pre-slew spectrum (Pre-slew PHA with pre-slew DRM)
Power-law model

Spectral model in power-law:
------------------------------------------------------------
Parameters  : value       lower 90%   higher 90%
Photon index: 1.21744     ( -0.279872   0.275695 )
Norm@50keV  : 1.90562E-03    ( -0.000259102   0.000258463 )
------------------------------------------------------------
#Fit statistic : Chi-Squared =          57.89 using 59 PHA bins.
# Reduced chi-squared =          1.016 for     57 degrees of freedom
# Null hypothesis probability =   4.422032e-01

Photon flux (15-150 keV)    in 39.04 sec: 0.224245 ( -0.0311125  0.0312658 ) ph/cm2/s
Energy fluence (15-150 keV)             : 7.51106e-07 ( -1.187e-07  1.20808e-07 ) ergs/cm2
Cutoff power-law model

Spectral model in the cutoff power-law:
------------------------------------------------------------
Parameters  : value       lower 90%   higher 90%
Photon index: 2.18249     ( -1.27618   0.780515 )
Epeak [keV] : 65.1036      (   )
Norm@50keV  : 5.69584E-04    (     )
------------------------------------------------------------
#Fit statistic : Chi-Squared =          56.66 using 59 PHA bins.
# Reduced chi-squared =          1.012 for     56 degrees of freedom
# Null hypothesis probability =   4.501106e-01

Photon flux (15-150 keV)    in 39.04 sec: 0.224806 ( -0.031956  0.030694 ) ph/cm2/s
Energy fluence (15-150 keV)             : 7.53667e-07 ( -1.2127e-07  1.13013e-07 ) ergs/cm2
Band function

Spectral model in the Band function:
------------------------------------------------------------
Parameters  : value       lower 90%   higher 90%
alpha       :    (     )
beta        :     (     )
Epeak [keV] :       (   )
Norm@50keV   :     (     )
------------------------------------------------------------

Photon flux (15-150 keV)    in  sec:  (    ) ph/cm2/s
Energy fluence (15-150 keV)             : 0 ( 0  0 ) ergs/cm2
S(25-50 keV) vs. S(50-100 keV) plot
S(25-50 keV)  = 1.59e-07
S(50-100 keV) = 2.74e-07
T90 vs. Hardness ratio plot
T90                                   = 32.3039999604225 sec.
Hardness ratio (energy fluence ratio) = 1.72327
Color vs. Color plot

Count Ratio  (25-50 keV) / (15-25 keV) = 1.12436
Count Ratio (50-100 keV) / (15-25 keV) = 1.27236
Mask shadow pattern
IMX = -1.926601922337032E-01, IMY = 2.128380030077487E-01
TIME vs. PHA plot around the trigger time
Blue+Cyan dotted lines: Time interval of the scaled map
From 0.000000 to 64.000000
TIME vs. DetID plot around the trigger time

Blue+Cyan dotted lines: Time interval of the scaled map
From 0.000000 to 64.000000
100 us light curve (15-350 keV)

Blue+Cyan dotted lines: Time interval of the scaled map
From 0.000000 to 64.000000
Spacecraft aspect plot
Bright source in the pre-burst/pre-slew/post-slew images
Pre-burst image of 15-350 keV band
Time interval of the image:
-119.000000 -13.244000

# RAcent  DECcent POSerr Theta    Phi  PeakCts   SNR AngSep     Name
#  [deg]    [deg]    ['] [deg]  [deg]                   [']
135.5723 -40.7221   42.6  30.8  156.2  -0.0611  -0.3   10.2	Vela X-1
113.4315 -57.8283    3.1  51.2  169.9   2.3167   3.6 ------	UNKNOWN
115.0679 -50.9821    2.3  44.8  173.6   1.9623   5.0 ------	UNKNOWN
107.4145 -45.2510    2.5  43.5 -175.6   1.4443   4.5 ------	UNKNOWN
105.8199  15.5592    2.8  40.1  -76.8   2.6237   4.1 ------	UNKNOWN
Pre-slew background subtracted image of 15-350 keV band
Time interval of the image:
-13.244000 25.796000

# RAcent  DECcent POSerr Theta    Phi  PeakCts   SNR AngSep     Name
#  [deg]    [deg]    ['] [deg]  [deg]                   [']
135.4460 -40.4819    8.1  30.5  156.4  -0.2070  -1.4    5.8	Vela X-1
179.9939  -6.0312    1.9  42.7   62.1   3.0161   6.2 ------	UNKNOWN
180.1564  -1.5882    2.2  43.6   55.7   2.3158   5.4 ------	UNKNOWN
147.3637   1.7816    2.4  15.6   15.6   0.4970   4.8 ------	UNKNOWN
100.0524 -55.1929    2.8  53.8  179.2   1.7004   4.0 ------	UNKNOWN
121.2176 -14.0162    1.3  16.0 -132.2   0.9843   8.8 ------	UNKNOWN
146.3641  34.0395    2.4  44.9  -15.1   0.8774   4.8 ------	UNKNOWN
 90.7111 -11.1087    2.8  45.5 -121.8   2.0173   4.1 ------	UNKNOWN
Post-slew image of 15-350 keV band
Time interval of the image:
111.500600 288.300600

# RAcent  DECcent POSerr Theta    Phi  PeakCts   SNR AngSep     Name
#  [deg]    [deg]    ['] [deg]  [deg]                   [']
135.6062 -40.4310    4.5  29.2  123.2  -0.9813  -2.6    8.2	Vela X-1
 69.9458 -42.0899    2.9  52.2 -167.0   3.0116   4.0 ------	UNKNOWN
 98.0630   2.0840    2.6  28.1  -90.9   1.5745   4.5 ------	UNKNOWN
 62.7853 -30.2192    2.9  55.9 -151.3   6.0571   4.0 ------	UNKNOWN
116.2696  36.2861    2.9  50.5  -39.4   4.4226   4.0 ------	UNKNOWN
 65.7029 -22.8142    2.4  53.2 -142.3   8.9868   4.8 ------	UNKNOWN
Plot creation:
Thu Jun 22 11:36:05 EDT 2017