Estimated redshift from machine learning (Ukwatta et al. 2016) - may take a few minute to calcaulte
Image
Pre-slew 15.0-350.0 keV image (Event data)
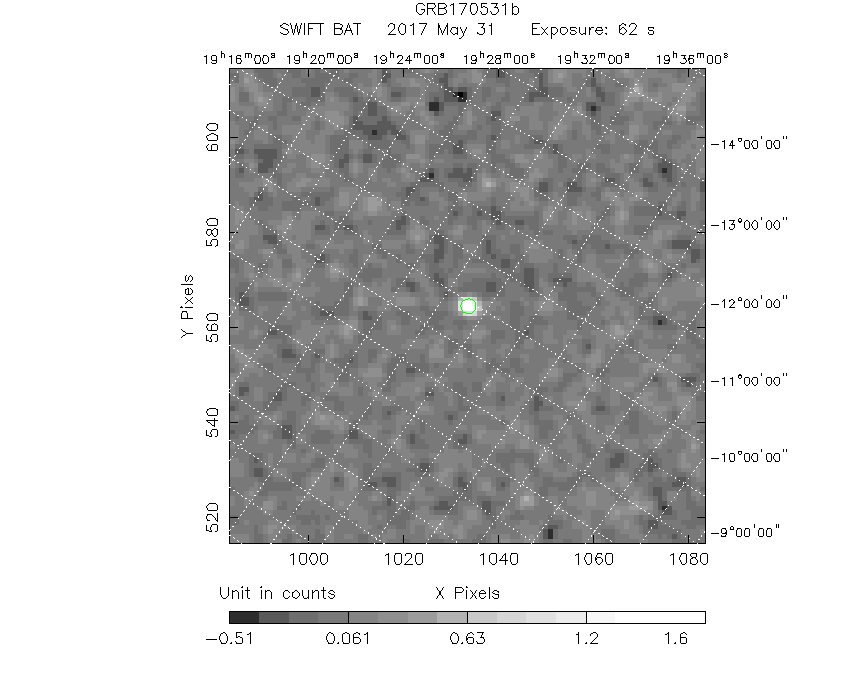
#   RAcent    DECcent   POSerr    Theta     Phi              Peak Cts       SNR   Name
  286.8994   -16.4093   0.0117    20.4338  -150.3150         2.0491415     16.472 TRIG_00755354

Foreground time interval of the image:
  0.240  62.349 (delta_t =  62.109 [sec])
Background time interval of the image:
-512.151 -493.100 (delta_t =  19.052 [sec])
-239.352   0.240 (delta_t = 239.592 [sec])
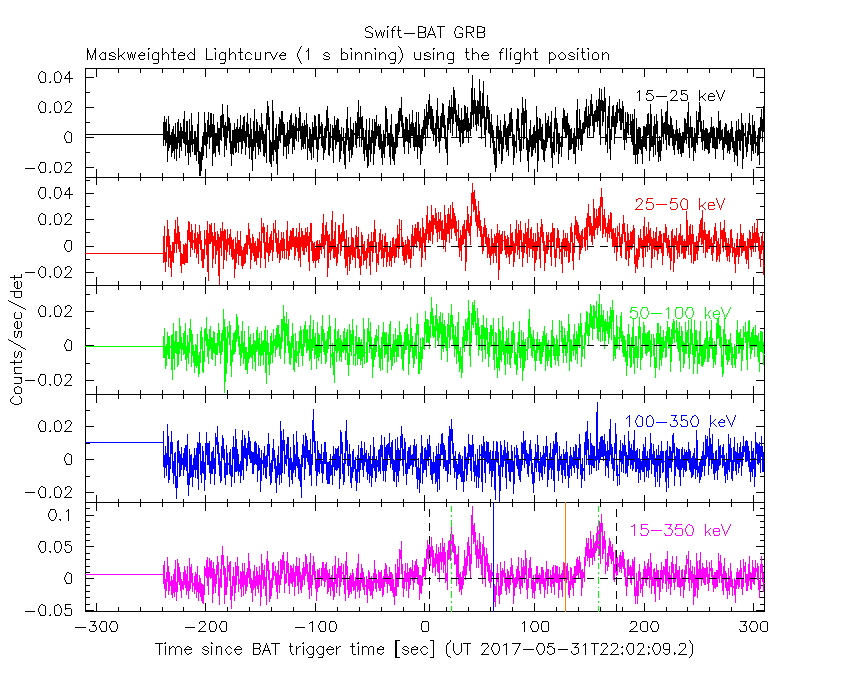
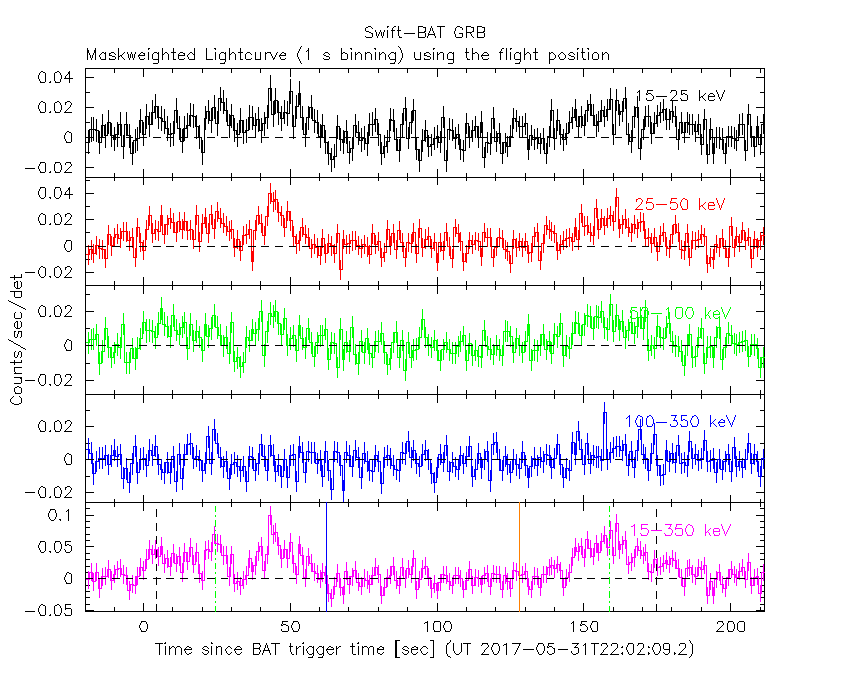
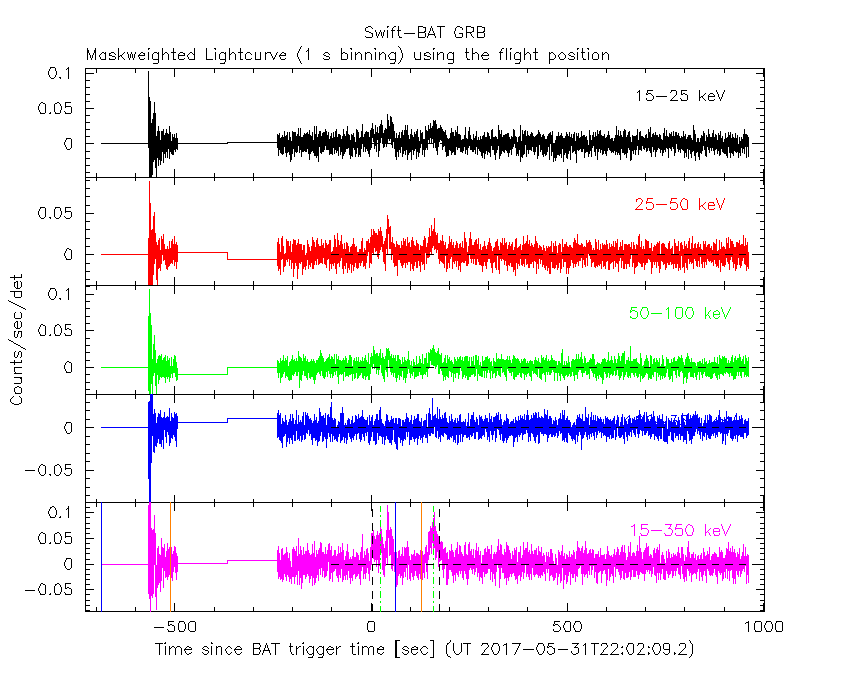
Lightcurves
Notes:
- 1) The mask-weighted light curves are using the flight position.
- 2) Multiple plots of different time binning/intervals are shown to cover all scenarios of short/long GRBs, rate/image triggers, and real/false positives.
- 3) For all the mask-weighted lightcurves, the y-axis units are counts/sec/det where a det is 0.4 x 0.4 = 0.16 sq cm.
- 4) The verticle lines correspond to following: green dotted lines are T50 interval, black dotted lines are T90 interval, blue solid line(s) is a spacecraft slew start time, and orange solid line(s) is a spacecraft slew end time.
- 5) Time of each bin is in the middle of the bin.
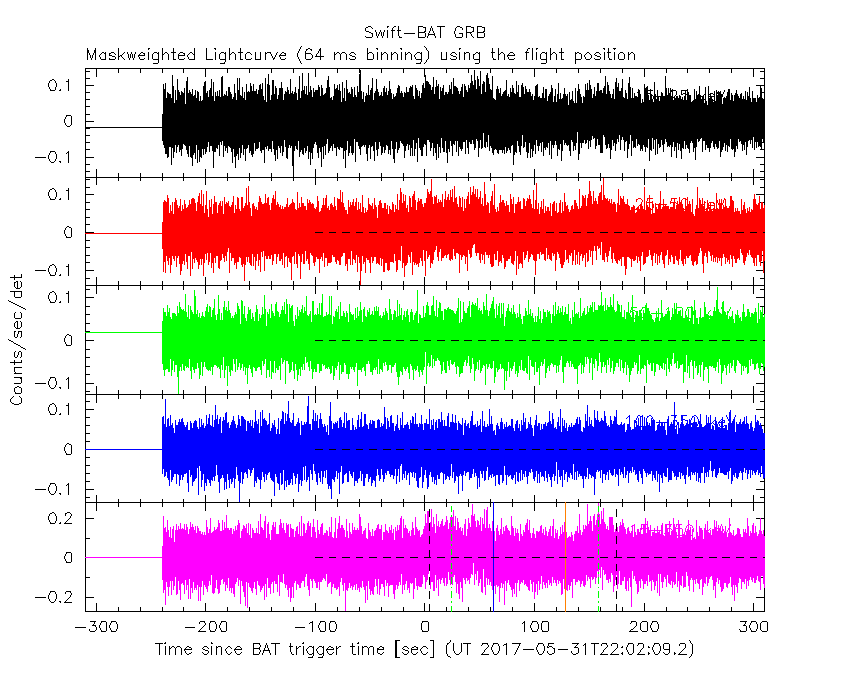
1 s binning
From T0-310 s to T0+310 s
From T100_start - 20 s to T100_end + 30 s
Full time interval
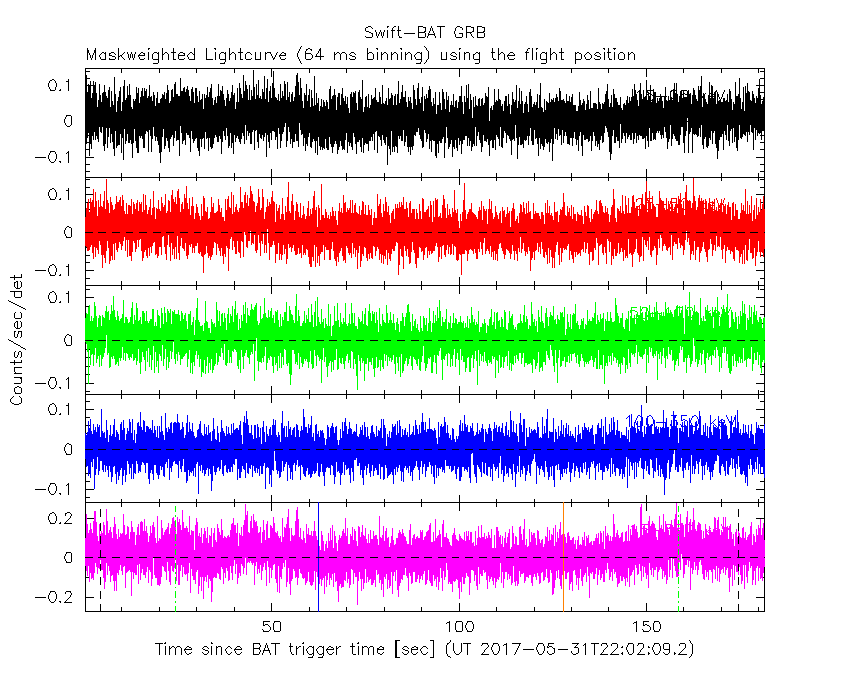
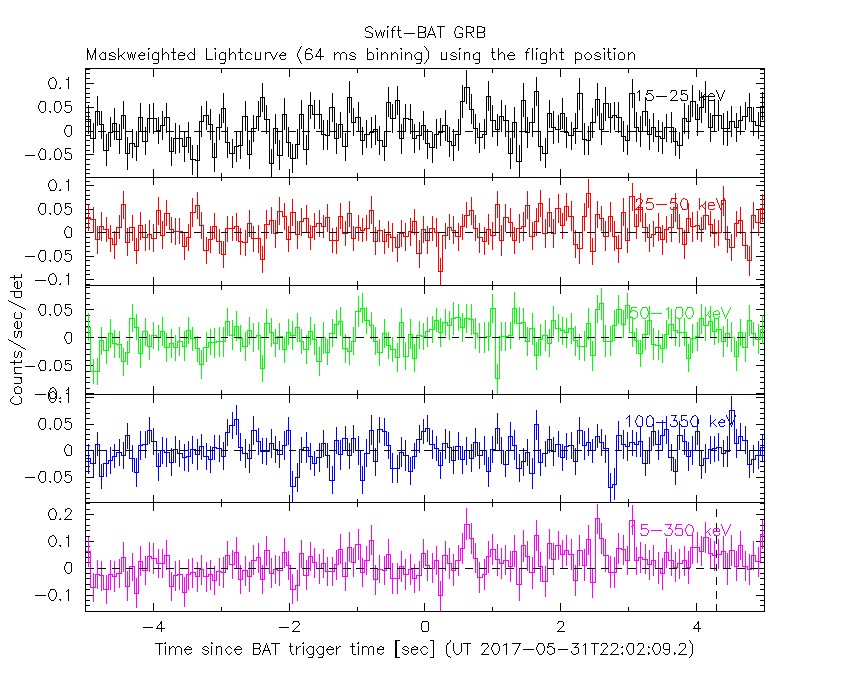
64 ms binning
Full time interval
From T100_start to T100_end
From T0-5 sec to T0+5 sec
16 ms binning
From T100_start-5 s to T100_start+5 s

Blue+Cyan dotted lines: Time interval of the scaled map
From 0.000000 to 12.160000
8 ms binning
From T100_start-3 s to T100_start+3 s

Blue+Cyan dotted lines: Time interval of the scaled map
From 0.000000 to 12.160000
2 ms binning
From T100_start-1 s to T100_start+1 s

Blue+Cyan dotted lines: Time interval of the scaled map
From 0.000000 to 12.160000
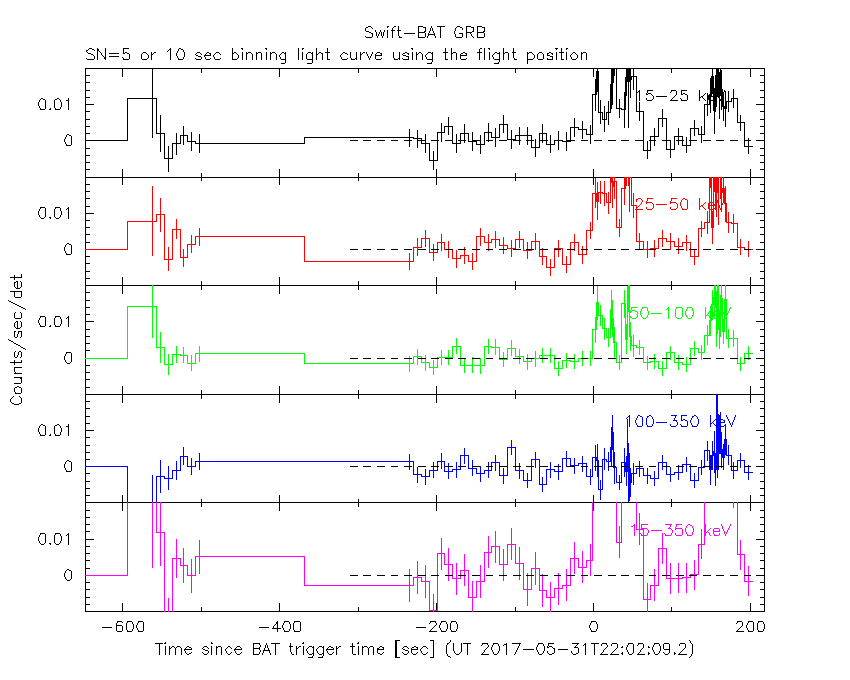
SN=5 or 10 sec. binning (whichever binning is satisfied first)

SN=5 or 10 sec. binning (T < 200 sec)
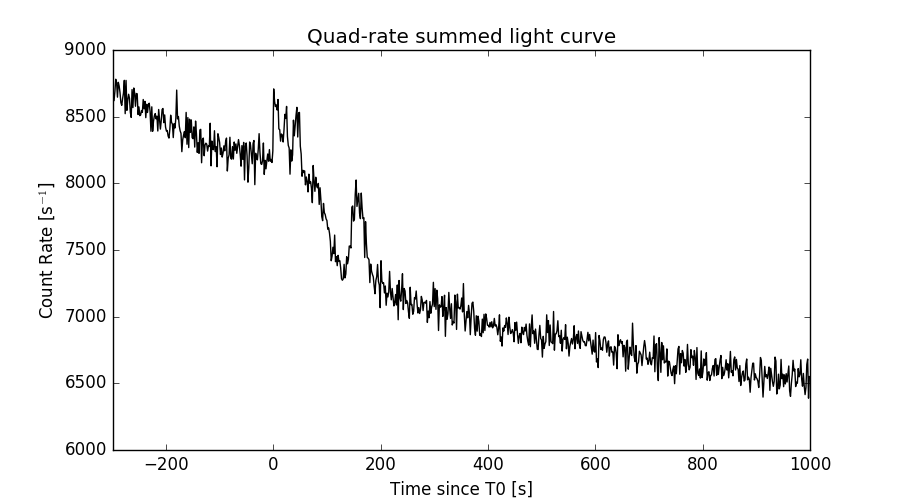
Quad-rate summed light curves (from T0-300s to T0+1000s)
Spectral Evolution

Spectra
Notes:
- 1) The fitting includes the systematic errors.
- 2) When the burst includes telescope slew time periods, the fitting uses an average response file made from multiple 5-s response files through out the slew time plus single time preiod for the non-slew times, and weighted by the total counts in the corresponding time period using addrmf. An average response file is needed becuase a spectral fit using the pre-slew DRM will introduce some errors in both a spectral shape and a normalization if the PHA file contains a lot of the slew/post-slew time interval.
- 3) For fits to more complicated models (e.g. a power-law over a cutoff power-law), the BAT team has decided to require a chi-square improvement of more than 6 for each extra dof.
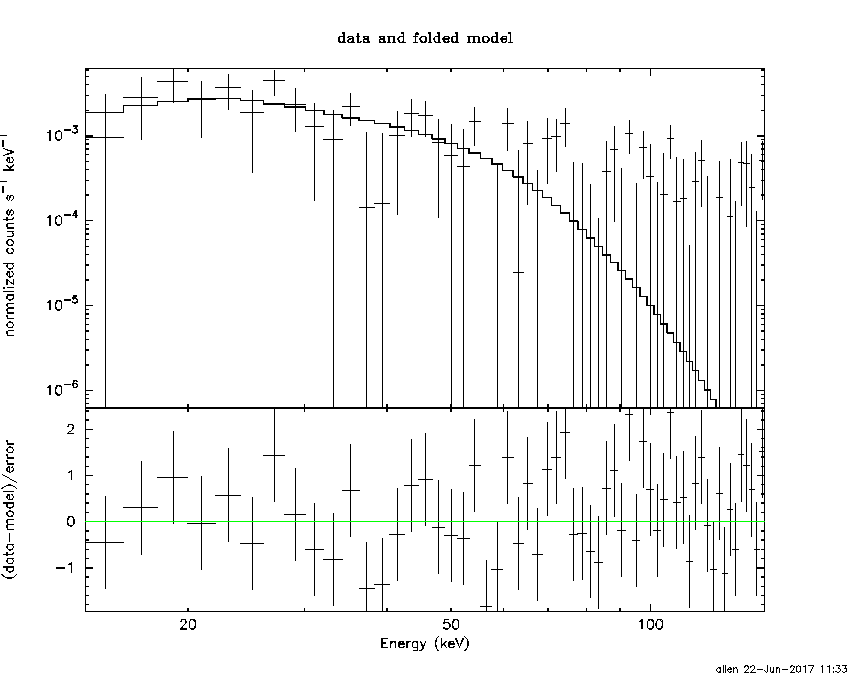
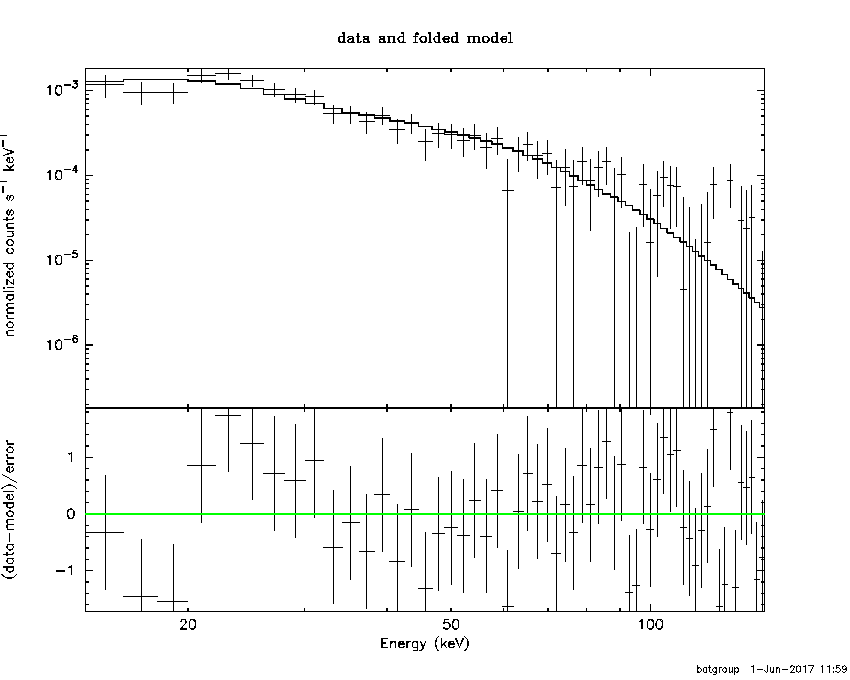
Time averaged spectrum fit using the average DRM
Power-law model
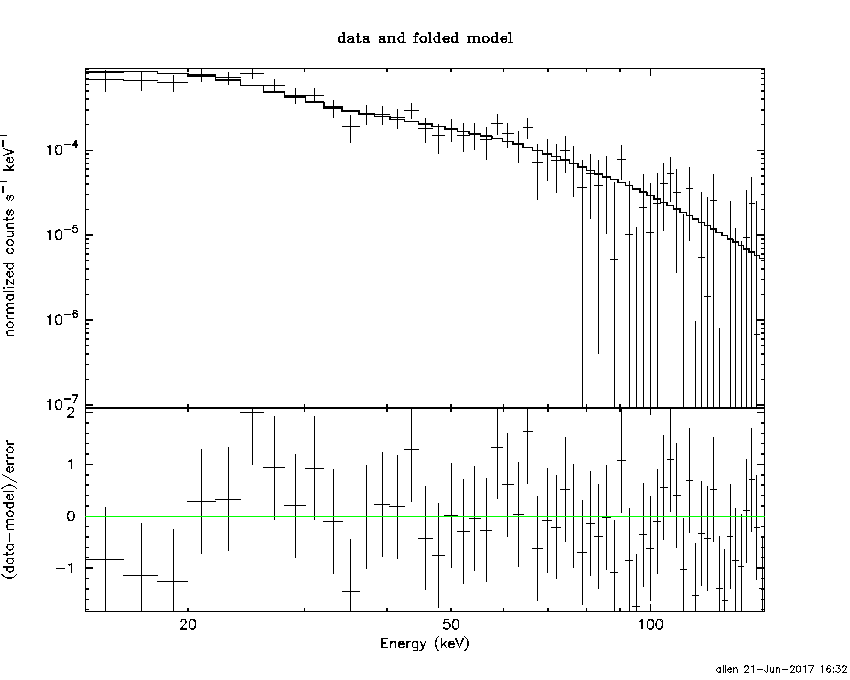
Time interval is from    0.240 sec. to  181.560 sec.

Spectral model in power-law:
------------------------------------------------------------
Parameters  : value       lower 90%   higher 90%
Photon index: 1.93735     ( -0.14488   0.149438 )
Norm@50keV  : 1.14833E-03    ( -0.000109282   0.00010774 )
------------------------------------------------------------
#Fit statistic : Chi-Squared =          42.16 using 59 PHA bins.
# Reduced chi-squared =         0.7397 for     57 degrees of freedom
# Null hypothesis probability =   9.290725e-01

Photon flux (15-150 keV)    in 181.3 sec: 0.167485 ( -0.012934  0.01294 ) ph/cm2/s
Energy fluence (15-150 keV)             : 1.91556e-06 ( -1.75046e-07  1.78492e-07 ) ergs/cm2
Cutoff power-law model
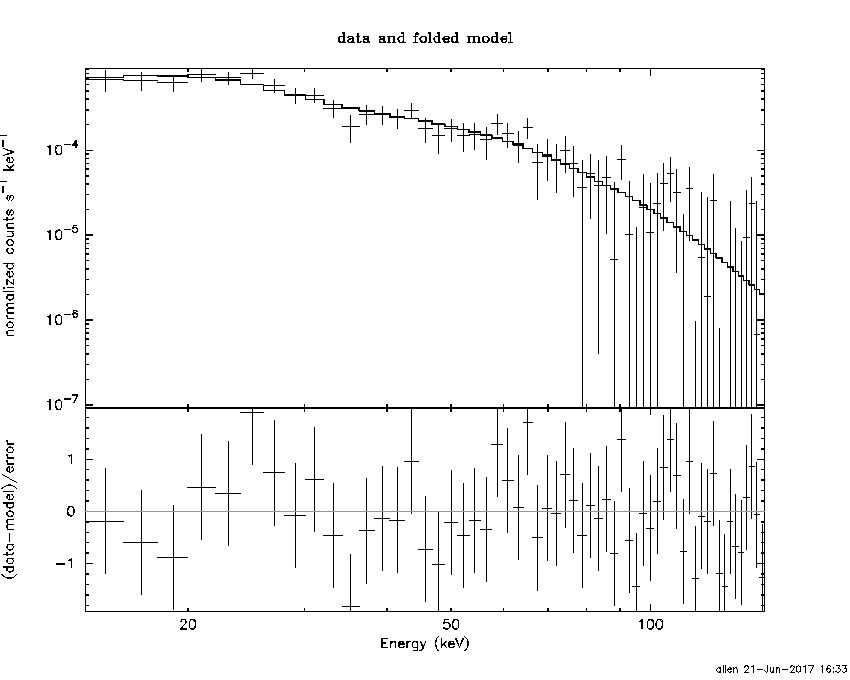
Time interval is from    0.240 sec. to  181.560 sec.
Spectral model in the cutoff power-law:
------------------------------------------------------------
Parameters  : value       lower 90%   higher 90%
Photon index: 1.21562     ( -0.6821   0.585574 )
Epeak [keV] : 45.1658      ( -10.7706 24.5168 )
Norm@50keV  : 2.98146E-03    ( -0.00157951   0.00434873 )
------------------------------------------------------------
#Fit statistic : Chi-Squared =          37.57 using 59 PHA bins.
# Reduced chi-squared =         0.6708 for     56 degrees of freedom
# Null hypothesis probability =   9.723188e-01

Photon flux (15-150 keV)    in 181.3 sec: 0.161710 ( -0.013623  0.013663 ) ph/cm2/s
Energy fluence (15-150 keV)             : 1.76245e-06 ( -1.98558e-07  2.10323e-07 ) ergs/cm2
Band function

Time interval is from    0.240 sec. to  181.560 sec.


Spectral model in the Band function:
------------------------------------------------------------
Parameters  : value       lower 90%   higher 90%
alpha       :    (     )
beta        :     (     )
Epeak [keV] :       (   )
Norm@50keV   :     (     )
------------------------------------------------------------

Photon flux (15-150 keV)    in  sec:  (    ) ph/cm2/s
Energy fluence (15-150 keV)             : 0 ( 0  0 ) ergs/cm2
Single BB

Spectral model blackbody:
------------------------------------------------------------
Parameters  : value    Lower 90%  Upper 90%
kT [keV]    : 10.2176  (-0.957006  1.07256)
R^2/D10^2   : 7.04999E-02  (-0.0223813   0.0324789)
(R is the radius in km and D10 is the distance to the source in units of 10 kpc)
------------------------------------------------------------
#Fit statistic : Chi-Squared =          66.52 using 59 PHA bins.
# Reduced chi-squared =          1.167 for     57 degrees of freedom
# Null hypothesis probability =   1.820237e-01

Energy  Fluence     90% Error
[keV]   [erg/cm2]   [erg/cm2]
15- 25  2.737e-07   3.699e-08
25- 50  7.012e-07   6.182e-08
50-150  3.894e-07   8.231e-08
15-150  1.364e-06   1.304e-07
Thermal bremsstrahlung (OTTB)

Spectral model: thermal bremsstrahlung
------------------------------------------------------------
Parameters  : value         Lower 90%    Upper 90%
kT [keV]    : 71.6273       (-16.0227      24.2482)
Norm        : 0.813245       (-0.0979516     0.11558)
------------------------------------------------------------
#Fit statistic : Chi-Squared =          37.61 using 59 PHA bins.
# Reduced chi-squared =         0.6598 for     57 degrees of freedom
# Null hypothesis probability =   9.778883e-01

Energy  Fluence     90% Error
[keV]   [erg/cm2]   [erg/cm2]
15- 25  3.792e-07   4.061e-08
25- 50  6.070e-07   5.095e-08
50-150  7.929e-07   1.753e-07
15-150  1.779e-06   1.902e-07
Double BB
Spectral model: bbodyrad<1> + bbodyrad<2>
------------------------------------------------------------
Parameters  : value         Lower 90%    Upper 90%
kT1 [keV]   : 5.69032        (-1.10986      1.25582)
R1^2/D10^2  : 0.437435        (-0.220694      0.546359)
kT2 [keV]   : 18.1787        (-3.5528      5.77681)
R2^2/D10^2  : 5.70530E-03    (-0.00382962   0.00699793)
------------------------------------------------------------
#Fit statistic : Chi-Squared =          34.34 using 59 PHA bins.
# Reduced chi-squared =         0.6243 for     55 degrees of freedom
# Null hypothesis probability =   9.869500e-01

Energy  Fluence     90% Error
[keV]   [erg/cm2]   [erg/cm2]
15- 25  3.831e-07   1.238e-07
25- 50  5.970e-07   2.054e-07
50-150  7.848e-07   4.198e-07
15-150  1.765e-06   6.457e-07
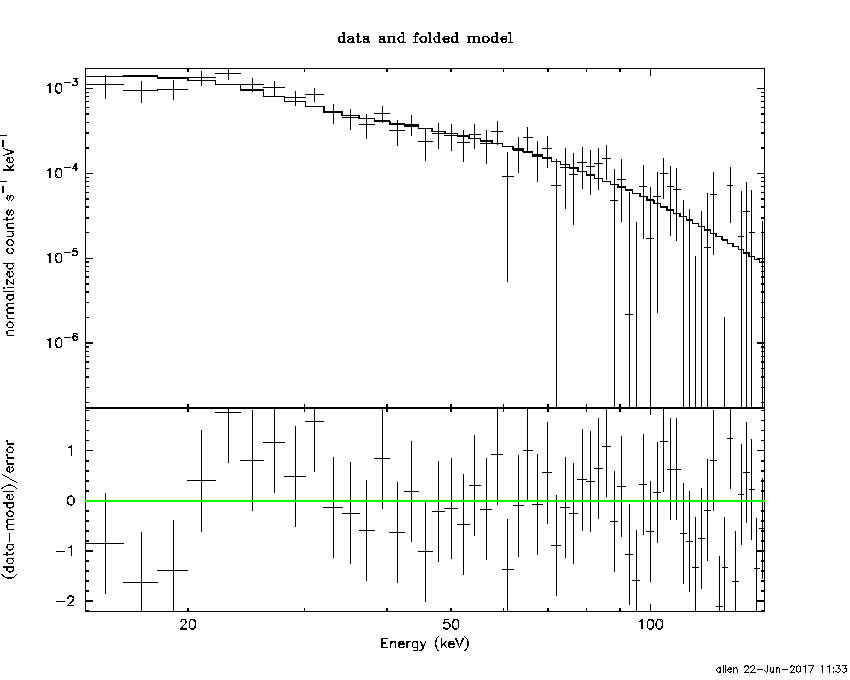
Peak spectrum fit
Power-law model

Time interval is from   42.708 sec. to   43.708 sec.

Spectral model in power-law:
------------------------------------------------------------
Parameters  : value       lower 90%   higher 90%
Photon index: 1.72435     ( -0.454524   0.470371 )
Norm@50keV  : 5.56784E-03    ( -0.00152857   0.00146256 )
------------------------------------------------------------
#Fit statistic : Chi-Squared =          54.20 using 59 PHA bins.
# Reduced chi-squared =         0.9509 for     57 degrees of freedom
# Null hypothesis probability =   5.806945e-01

Photon flux (15-150 keV)    in 1 sec: 0.745908 ( -0.176584  0.176925 ) ph/cm2/s
Energy fluence (15-150 keV)             : 5.14671e-08 ( -1.41807e-08  1.48705e-08 ) ergs/cm2
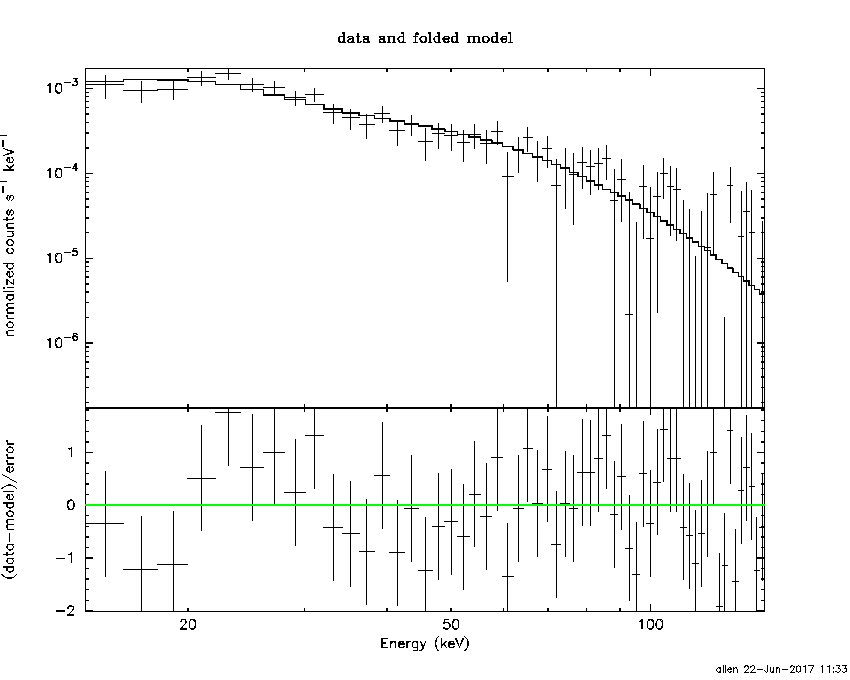
Cutoff power-law model

Time interval is from   42.708 sec. to   43.708 sec.
Spectral model in the cutoff power-law:
------------------------------------------------------------
Parameters  : value       lower 90%   higher 90%
Photon index: 2.01649     ( -0.750696   0.00502127 )
Epeak [keV] : 6.91250      (   )
Norm@50keV  : 3.88046E-03    (     )
------------------------------------------------------------
#Fit statistic : Chi-Squared =          54.14 using 59 PHA bins.
# Reduced chi-squared =         0.9667 for     56 degrees of freedom
# Null hypothesis probability =   5.457509e-01

Photon flux (15-150 keV)    in 1 sec: 0.749671 ( -0.186521  0.177328 ) ph/cm2/s
Energy fluence (15-150 keV)             : 5.19505e-08 ( -1.78532e-08  1.49193e-08 ) ergs/cm2
Band function

Time interval is from   42.708 sec. to   43.708 sec.


Spectral model in the Band function:
------------------------------------------------------------
Parameters  : value       lower 90%   higher 90%
alpha       :    (     )
beta        :     (     )
Epeak [keV] :       (   )
Norm@50keV   :     (     )
------------------------------------------------------------

Photon flux (15-150 keV)    in  sec:  (    ) ph/cm2/s
Energy fluence (15-150 keV)             : 0 ( 0  0 ) ergs/cm2
Single BB
Spectral model blackbody:
------------------------------------------------------------
Parameters  : value    Lower 90%  Upper 90%
kT [keV]    : 9.81823  (-2.49697  3.99916)
R^2/D10^2   : 0.367520  (-0.267084   0.776495)
(R is the radius in km and D10 is the distance to the source in units of 10 kpc)
------------------------------------------------------------
#Fit statistic : Chi-Squared =          59.08 using 59 PHA bins.
# Reduced chi-squared =          1.036 for     57 degrees of freedom
# Null hypothesis probability =   3.995837e-01

Energy  Fluence     90% Error
[keV]   [erg/cm2]   [erg/cm2]
15- 25  7.168e-09   3.972e-09
25- 50  1.736e-08   8.202e-09
50-150  8.591e-09   5.227e-09
15-150  3.312e-08   1.699e-08
Thermal bremsstrahlung (OTTB)
Spectral model: thermal bremsstrahlung
------------------------------------------------------------
Parameters  : value         Lower 90%    Upper 90%
kT [keV]    : 110.578       (-67.2696      -112.041)
Norm        : 3.21501       (-0.892684     1.48733)
------------------------------------------------------------
#Fit statistic : Chi-Squared =          54.67 using 59 PHA bins.
# Reduced chi-squared =         0.9591 for     57 degrees of freedom
# Null hypothesis probability =   5.629788e-01

Energy  Fluence     90% Error
[keV]   [erg/cm2]   [erg/cm2]
15- 25  8.395e-09   5.070e-09
25- 50  1.480e-08   8.650e-09
50-150  2.534e-08   1.834e-08
15-150  4.853e-08   3.128e-08
Double BB

Spectral model: bbodyrad<1> + bbodyrad<2>
------------------------------------------------------------
Parameters  : value         Lower 90%    Upper 90%
kT1 [keV]   : 7.52961        (-2.31389      2.90684)
R1^2/D10^2  : 0.883347        (-0.492268      2.98687)
kT2 [keV]   : 81.0356        (-72.1633      -91.6043)
R2^2/D10^2  : 4.56532E-04    (-0.000311545   0.020541)
------------------------------------------------------------
#Fit statistic : Chi-Squared =          51.84 using 59 PHA bins.
# Reduced chi-squared =         0.9425 for     55 degrees of freedom
# Null hypothesis probability =   5.962512e-01

Energy  Fluence     90% Error
[keV]   [erg/cm2]   [erg/cm2]
15- 25  8.844e-09   5.135e-09
25- 50  1.528e-08   8.655e-09
50-150  3.335e-08   1.926e-08
15-150  5.747e-08   2.977e-08
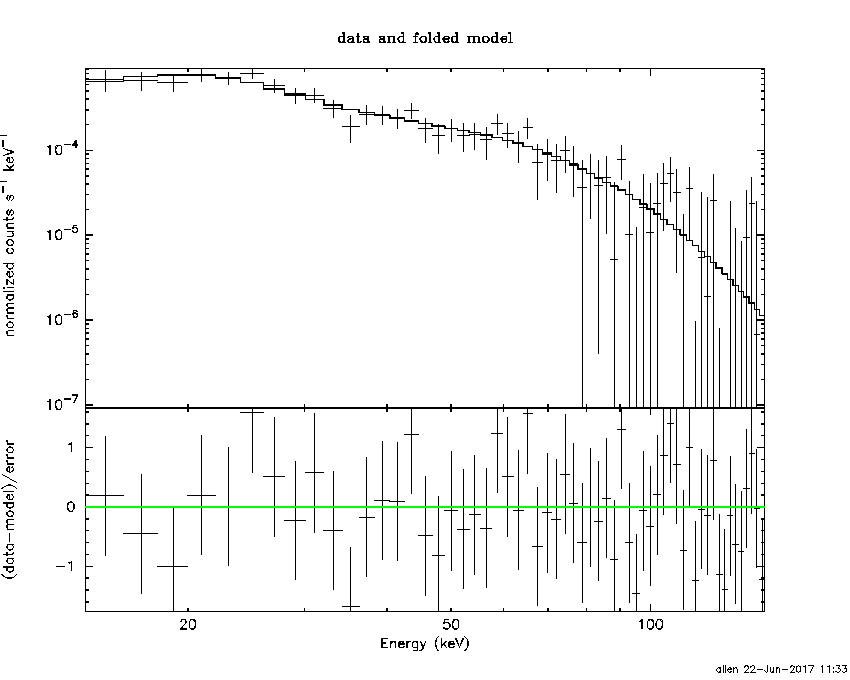
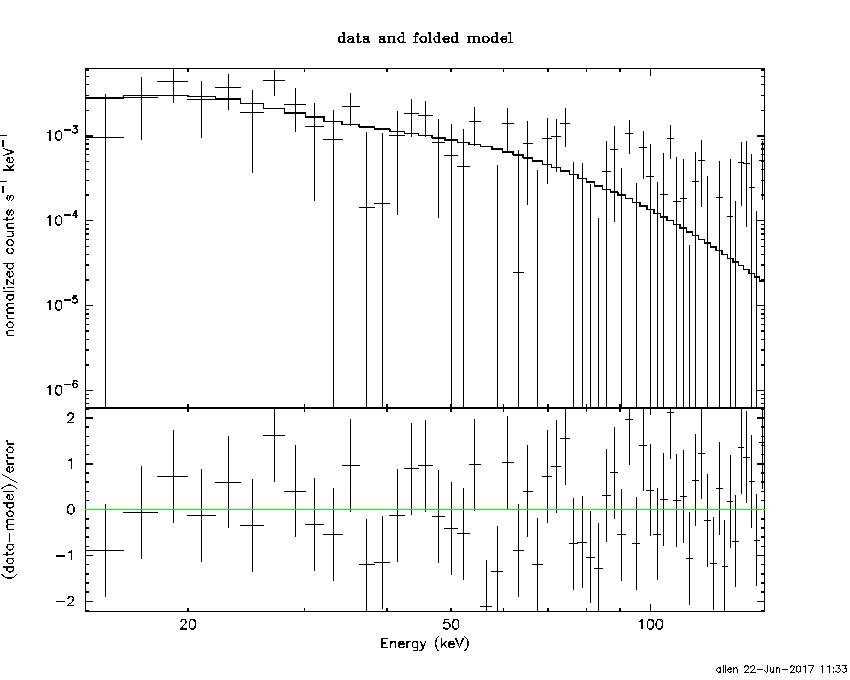
Pre-slew spectrum (Pre-slew PHA with pre-slew DRM)
Power-law model
Spectral model in power-law:
------------------------------------------------------------
Parameters  : value       lower 90%   higher 90%
Photon index: 1.93830     ( -0.154048   0.158656 )
Norm@50keV  : 1.93823E-03    ( -0.000194386   0.000191517 )
------------------------------------------------------------
#Fit statistic : Chi-Squared =          46.87 using 59 PHA bins.
# Reduced chi-squared =         0.8222 for     57 degrees of freedom
# Null hypothesis probability =   8.285385e-01

Photon flux (15-150 keV)    in 62.11 sec: 0.282789 ( -0.0232278  0.0232432 ) ph/cm2/s
Energy fluence (15-150 keV)             : 1.10748e-06 ( -1.06697e-07  1.08722e-07 ) ergs/cm2
Cutoff power-law model
Spectral model in the cutoff power-law:
------------------------------------------------------------
Parameters  : value       lower 90%   higher 90%
Photon index: 1.31902     ( -0.723237   0.604928 )
Epeak [keV] : 45.1287      ( -14.7427 59.9802 )
Norm@50keV  : 4.43124E-03    ( -0.00241276   0.00727892 )
------------------------------------------------------------
#Fit statistic : Chi-Squared =          43.79 using 59 PHA bins.
# Reduced chi-squared =         0.7819 for     56 degrees of freedom
# Null hypothesis probability =   8.822245e-01

Photon flux (15-150 keV)    in 62.11 sec: 0.274354 ( -0.024466  0.024525 ) ph/cm2/s
Energy fluence (15-150 keV)             : 1.02664e-06 ( -1.25282e-07  1.31897e-07 ) ergs/cm2
Band function
Spectral model in the Band function:
------------------------------------------------------------
Parameters  : value       lower 90%   higher 90%
alpha       :    (     )
beta        :     (     )
Epeak [keV] :       (   )
Norm@50keV   :     (     )
------------------------------------------------------------

Photon flux (15-150 keV)    in  sec:  (    ) ph/cm2/s
Energy fluence (15-150 keV)             : 0 ( 0  0 ) ergs/cm2
S(25-50 keV) vs. S(50-100 keV) plot
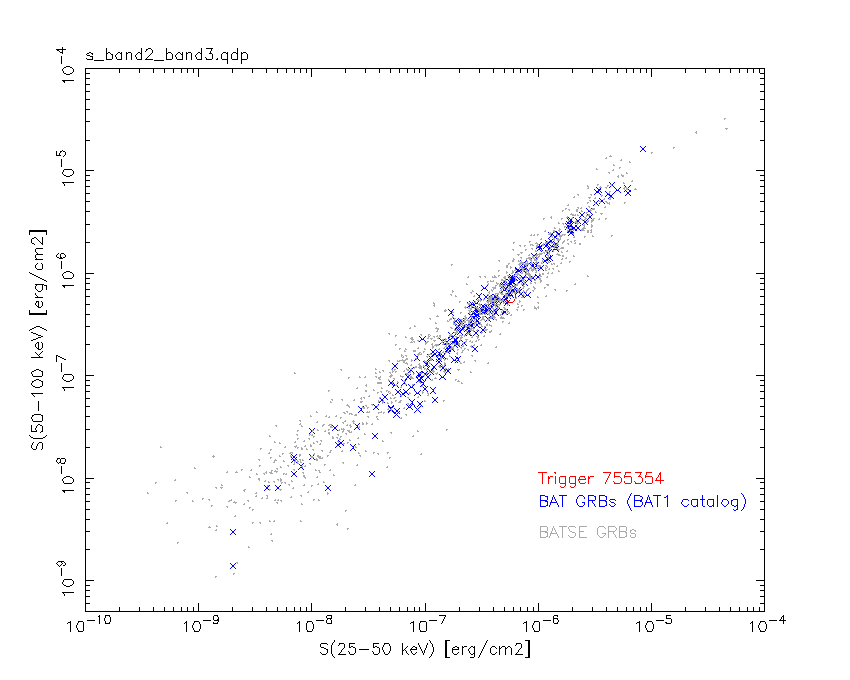
S(25-50 keV)  = 5.66e-07
S(50-100 keV) = 5.91e-07
T90 vs. Hardness ratio plot
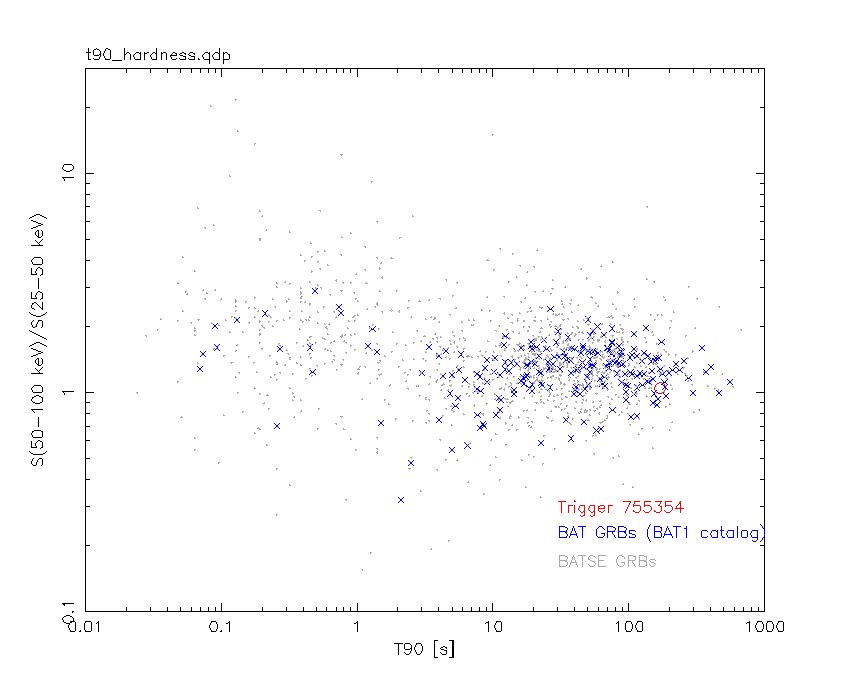
T90                                   = 170.29599994421 sec.
Hardness ratio (energy fluence ratio) = 1.04417
Color vs. Color plot
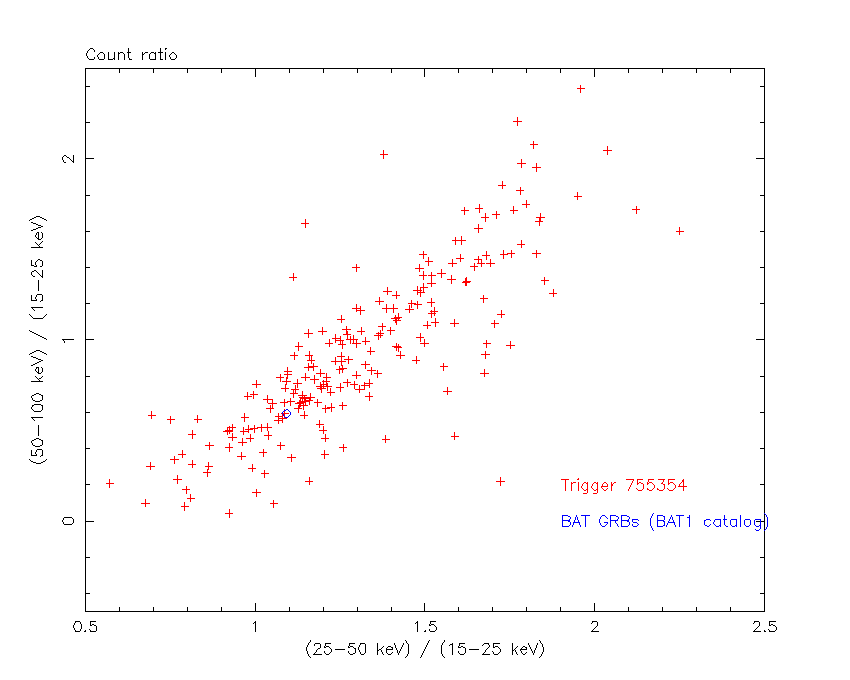
Count Ratio  (25-50 keV) / (15-25 keV) = 1.09257
Count Ratio (50-100 keV) / (15-25 keV) = 0.594302
Mask shadow pattern

IMX = -3.236722325517952E-01, IMY = 1.845073450929686E-01
TIME vs. PHA plot around the trigger time
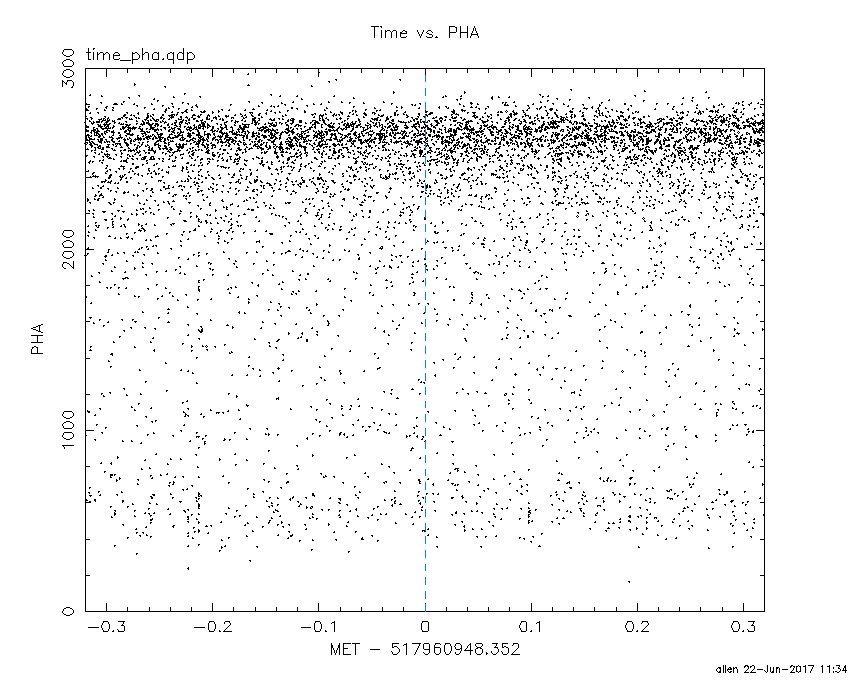
Blue+Cyan dotted lines: Time interval of the scaled map
From 0.000000 to 12.160000
TIME vs. DetID plot around the trigger time
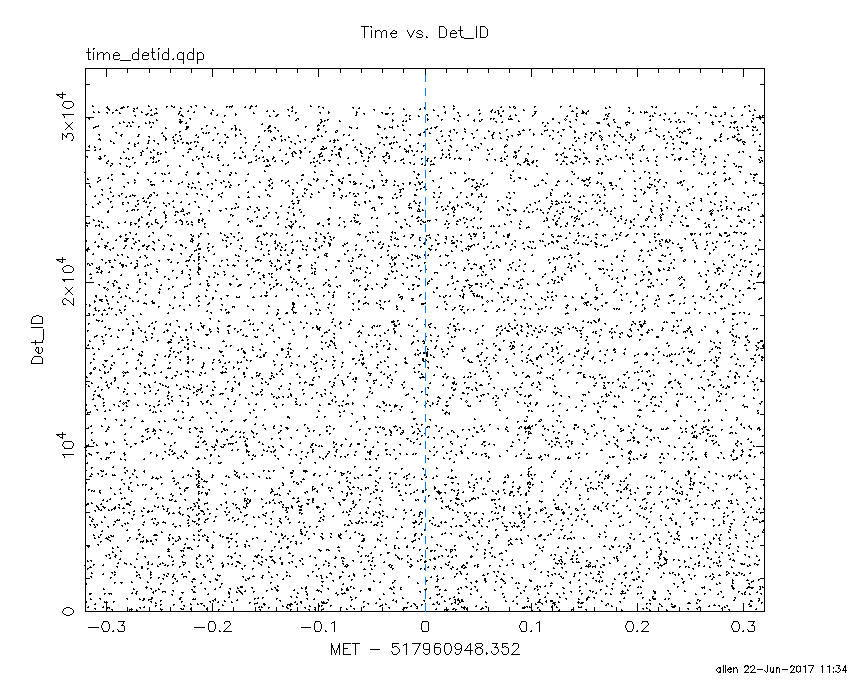
Blue+Cyan dotted lines: Time interval of the scaled map
From 0.000000 to 12.160000
100 us light curve (15-350 keV)
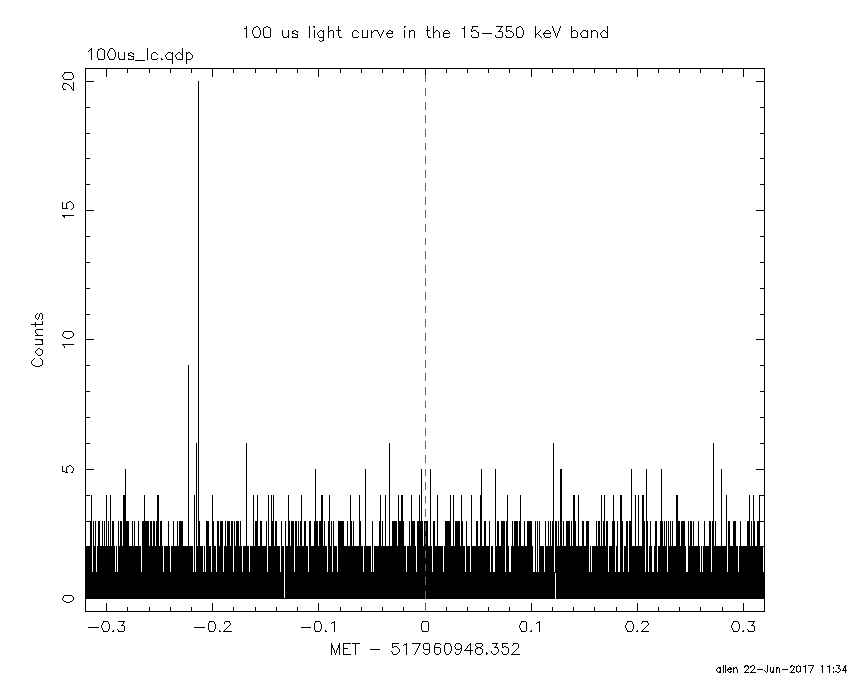
Blue+Cyan dotted lines: Time interval of the scaled map
From 0.000000 to 12.160000
Spacecraft aspect plot

Bright source in the pre-burst/pre-slew/post-slew images
Pre-burst image of 15-350 keV band
Time interval of the image:
-512.151410 -493.099600
-239.352000 0.240000

# RAcent  DECcent POSerr Theta    Phi  PeakCts   SNR AngSep     Name
#  [deg]    [deg]    ['] [deg]  [deg]                   [']
244.9800 -15.6428    0.3  22.5   70.1  17.2208  41.2    0.2	Sco X-1
255.9688 -37.8266    0.7  16.0   -6.7   5.5549  15.6    1.3	4U 1700-377
256.3074 -36.3520    3.4  14.7   -3.9   1.2103   3.4    7.5	GX 349+2
262.9898 -24.7637    2.1   3.6   50.4   1.7567   5.5    1.5	GX 1+4
264.8829 -44.4949    6.9  19.7  -35.4   0.6354   1.7    6.6	4U 1735-44
268.3492  -1.2609    5.2  23.6  143.6  -0.8865  -2.2   11.6	SW J1753.5-0127
270.3356 -25.0755    2.6   3.1 -124.5   1.5195   4.4    2.8	GX 5-1
270.2902 -25.8023    5.7   3.2 -111.2   0.7220   2.0    3.6	GRS 1758-258
273.9780 -14.0208    3.2  12.7  172.9   1.2532   3.6    1.9	GX 17+2
276.0623 -30.2701    6.1   9.7  -93.8   0.6330   1.9    9.2	H1820-303
285.0521 -24.7554    7.8  16.4 -126.2  -0.5221  -1.5    9.9	HT1900.1-2455
288.8209  10.7939    7.9  41.5  173.7   0.8848   1.5    9.2	GRS 1915+105
263.1135 -33.8260   11.8   9.6  -20.2   0.3310   1.0    6.2	GX 354-0
250.0184 -19.2517    3.2  16.7   66.4   1.2616   3.7 ------	UNKNOWN
284.0904  10.0631    3.3  38.7  167.8   1.8744   3.5 ------	UNKNOWN
259.9091 -25.0163    1.0   6.4   47.1   4.0288  11.6 ------	UNKNOWN
294.5620  16.3724    2.4  49.2  176.1   4.2387   4.8 ------	UNKNOWN
224.8963 -53.5194    2.8  42.4   -3.6   2.3767   4.1 ------	UNKNOWN
278.9189 -20.3139    3.1  11.9 -149.7   1.1847   3.7 ------	UNKNOWN
234.1752 -65.2798    2.6  45.5  -21.3   2.6157   4.4 ------	UNKNOWN
303.5279  -6.8955    2.8  39.3 -150.7   2.2466   4.1 ------	UNKNOWN
	UNKNOWN
	UNKNOWN
Pre-slew background subtracted image of 15-350 keV band
Time interval of the image:
0.240000 62.348600

# RAcent  DECcent POSerr Theta    Phi  PeakCts   SNR AngSep     Name
#  [deg]    [deg]    ['] [deg]  [deg]                   [']
244.8197 -15.6763    5.1  22.7   69.8  -0.3434  -2.3    9.5	Sco X-1
255.9348 -37.8083    4.4  16.0   -6.6  -0.3199  -2.6    3.3	4U 1700-377
256.5048 -36.4057   10.0  14.6   -4.5  -0.1437  -1.2    3.5	GX 349+2
263.0009 -24.9392    8.4   3.6   47.7  -0.1703  -1.4   11.6	GX 1+4
264.6485 -44.5485    4.9  19.8  -34.9   0.2986   2.4    7.2	4U 1735-44
268.5326  -1.4818   10.3  23.4  144.1  -0.1652  -1.1   10.0	SW J1753.5-0127
270.5088 -25.0493   97.8   3.2 -125.2  -0.0138  -0.1   12.3	GX 5-1
270.2362 -25.7204   11.6   3.1 -112.4   0.1167   1.0    3.8	GRS 1758-258
274.0362 -13.9069    5.2  12.8  172.8   0.2721   2.2    8.0	GX 17+2
276.0553 -30.4677    6.2   9.8  -92.8  -0.2368  -1.9    9.1	H1820-303
285.0896 -25.1269    0.0  16.4 -124.9  -0.0825  -0.6   12.7	HT1900.1-2455
288.8750  10.8595    5.0  41.6  173.7  -0.4656  -2.3    6.9	GRS 1915+105
262.9486 -33.9422  132.9   9.8  -19.7   0.0104   0.1    6.8	GX 354-0
267.7826 -16.9818    3.0   7.9  145.9   0.4498   3.9 ------	UNKNOWN
286.8994 -16.4092    0.7  20.4 -150.3   2.0490  16.5 ------	UNKNOWN
Post-slew image of 15-350 keV band
Time interval of the image:
127.948600 962.718000

# RAcent  DECcent POSerr Theta    Phi  PeakCts   SNR AngSep     Name
#  [deg]    [deg]    ['] [deg]  [deg]                   [']
244.9814 -15.6765    0.8  40.2  100.2  48.7059  13.7    2.2	Sco X-1
256.0063 -37.8533    1.5  34.6   60.9  12.1913   7.6    1.1	4U 1700-377
256.4904 -36.2948   10.4  33.5   63.0  -1.6071  -1.1    8.1	GX 349+2
263.0177 -24.7545    1.9  23.8   80.9   5.8733   6.2    0.7	GX 1+4
264.6171 -44.3091   19.2  33.6   44.6   0.7156   0.6   10.0	4U 1735-44
268.4522  -1.5810    8.8  23.5  142.6  -1.0844  -1.3    9.2	SW J1753.5-0127
270.2768 -25.1190    2.4  17.8   73.3   3.9542   4.9    2.4	GX 5-1
270.3592 -25.6793    6.4  18.0   71.6   1.6466   2.0    4.9	GRS 1758-258
274.1240 -14.0427    3.2  12.6  114.5   3.2460   3.6    6.9	GX 17+2
275.8547 -30.5121    3.6  17.3   49.0   2.6837   3.2    9.4	H1820-303
284.9402 -25.0970    5.6   8.9   27.0  -1.5684  -2.0   11.8	HT1900.1-2455
288.7859  10.9013    4.5  27.4 -160.8   2.1724   2.6    2.8	GRS 1915+105
299.6168  35.1801    1.4  53.0 -151.8  27.1565   8.6    1.8	Cyg X-1
262.8954 -33.9187    5.6  27.8   61.7   2.1050   2.1    6.9	GX 354-0
259.8829 -25.0239    1.0  26.6   82.0  11.5129  11.0 ------	UNKNOWN
272.4436 -26.4244    4.0  16.8   66.2   2.1104   2.9 ------	UNKNOWN
291.8280 -39.5958    2.6  23.5    5.8   3.2843   4.4 ------	UNKNOWN
314.9822  22.9555    3.2  48.0 -129.1  18.2210   3.6 ------	UNKNOWN
317.7531  17.2576    3.5  45.4 -121.3  15.9537   3.3 ------	UNKNOWN
Plot creation:
Thu Jun 22 11:34:29 EDT 2017