Estimated redshift from machine learning (Ukwatta et al. 2016) - may take a few minutes to calcaulte
Image
Pre-slew 15-350 keV image (Event data; bkg subtracted)
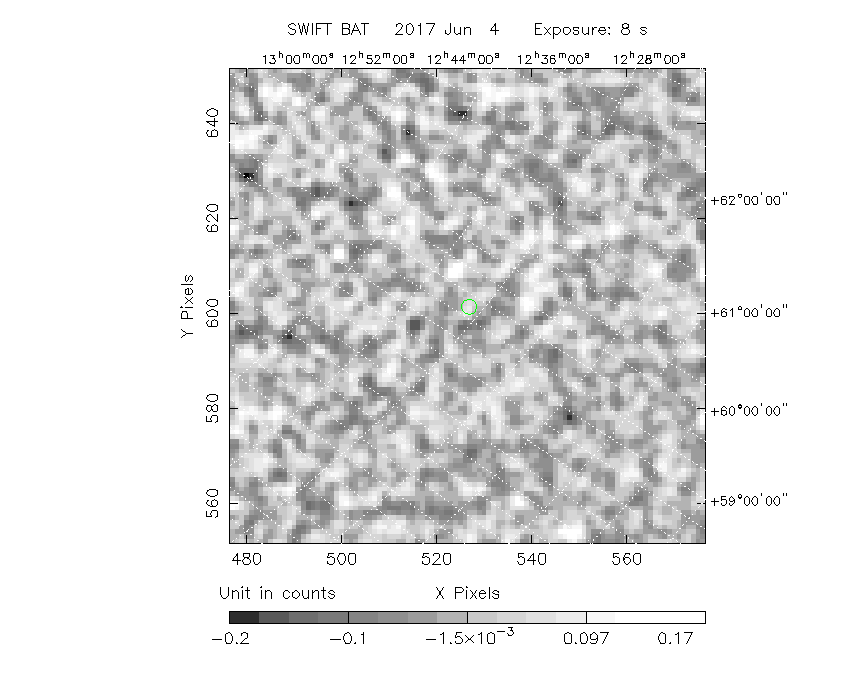
#   RAcent  DECcent POSerr  Theta    Phi     Peak Cts     SNR  Name
  200.5283 +64.2016 0.1019   38.2  -19.5       0.0980     1.9  TRIG_00755873
------------------------------------------

Foreground time interval of the image:
  0.000   8.192 (delta_t =   8.192 [sec])
Background time interval of the image:
-113.179 -54.961 (delta_t =  58.218 [sec])
-53.680 -23.680 (delta_t =  30.000 [sec])
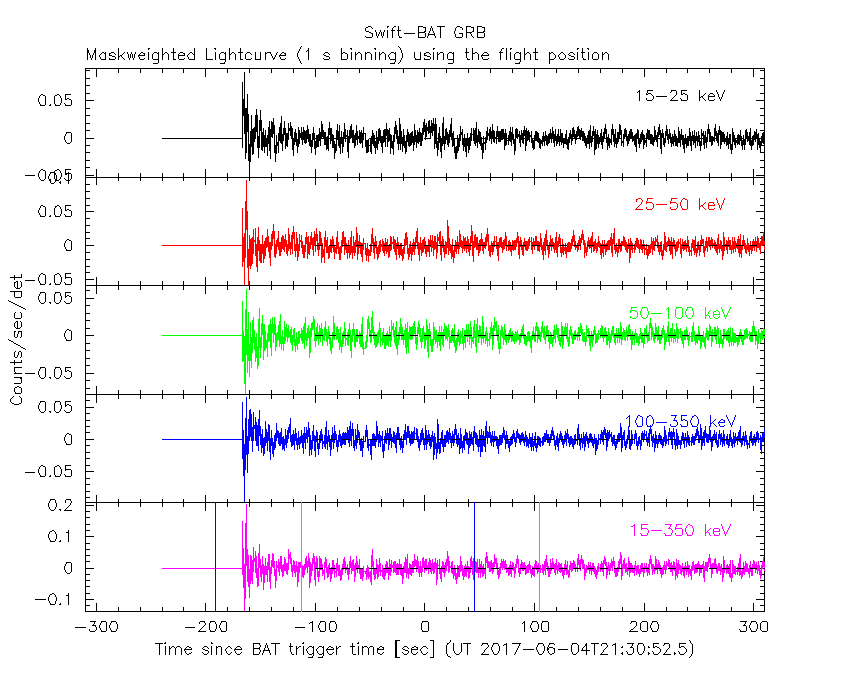
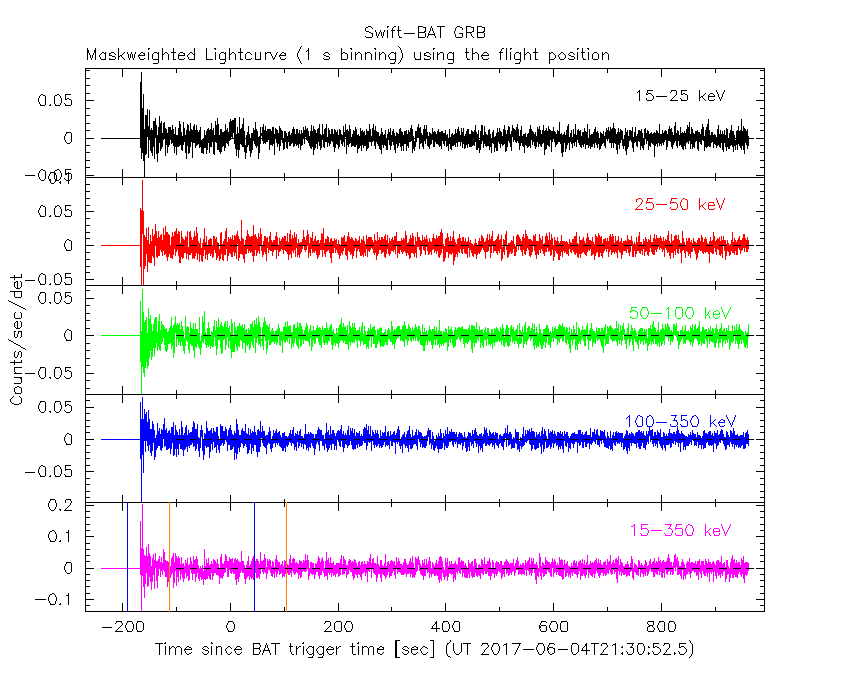
Lightcurves
Notes:
- 1) All plots contain as much data as has been downloaded to date.
- 2) The mask-weighted light curves are using the flight position.
- 3) Multiple plots of different time binning/intervals are shown to cover all scenarios of short/long GRBs, rate/image triggers, and real/false positives.
- 4) For all the mask-weighted lightcurves, the y-axis units are counts/sec/det where a det is 0.4 x 0.4 = 0.16 sq cm.
- 5) The verticle lines correspond to following: green dotted lines are T50 interval, black dotted lines are T90 interval, blue solid line(s) is a spacecraft slew start time, and orange solid line(s) is a spacecraft slew end time.
- 6) Time of each bin is in the middle of the bin.
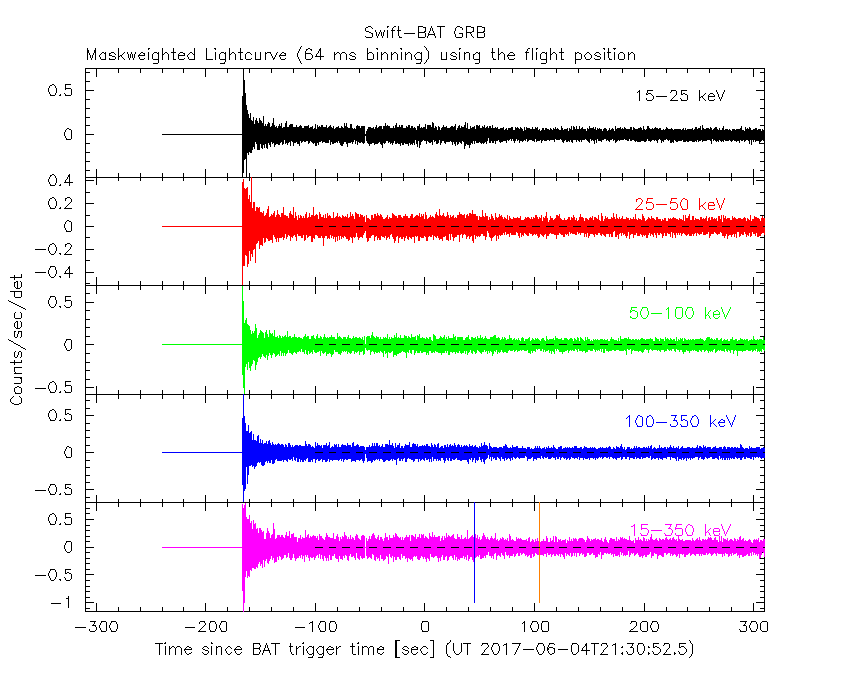
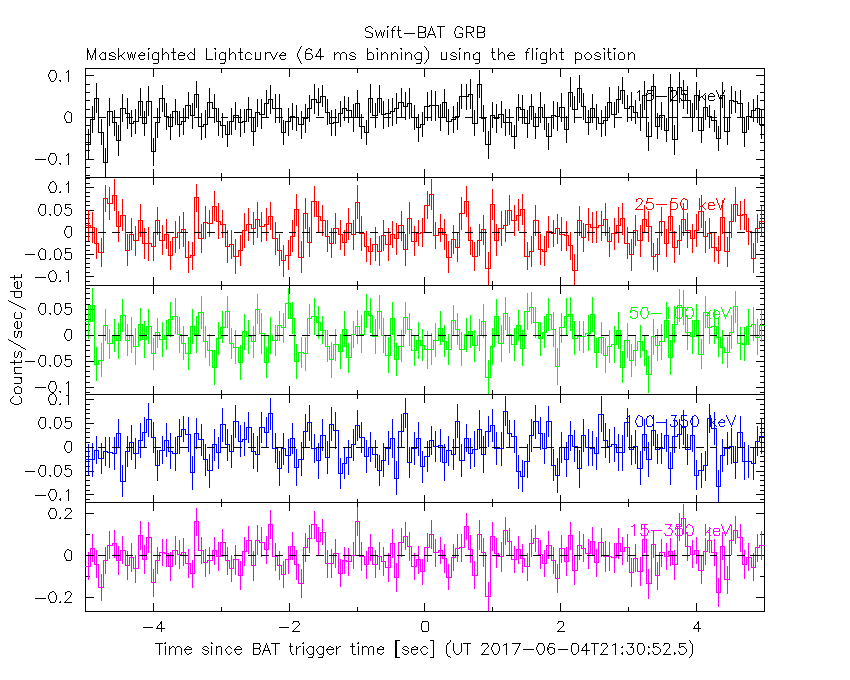
1 s binning
From T0-310 s to T0+310 s
From T100_start - 20 s to T100_end + 30 s
Full time interval
64 ms binning
Full time interval
From T100_start to T100_end
From T0-5 sec to T0+5 sec
16 ms binning
From T100_start-5 s to T100_start+5 s

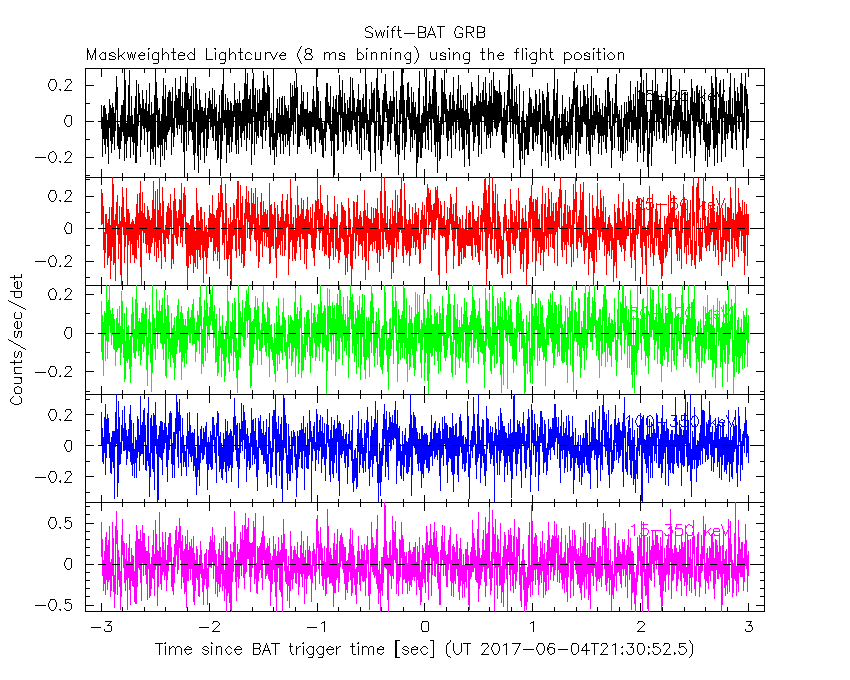
8 ms binning
From T100_start-3 s to T100_start+3 s
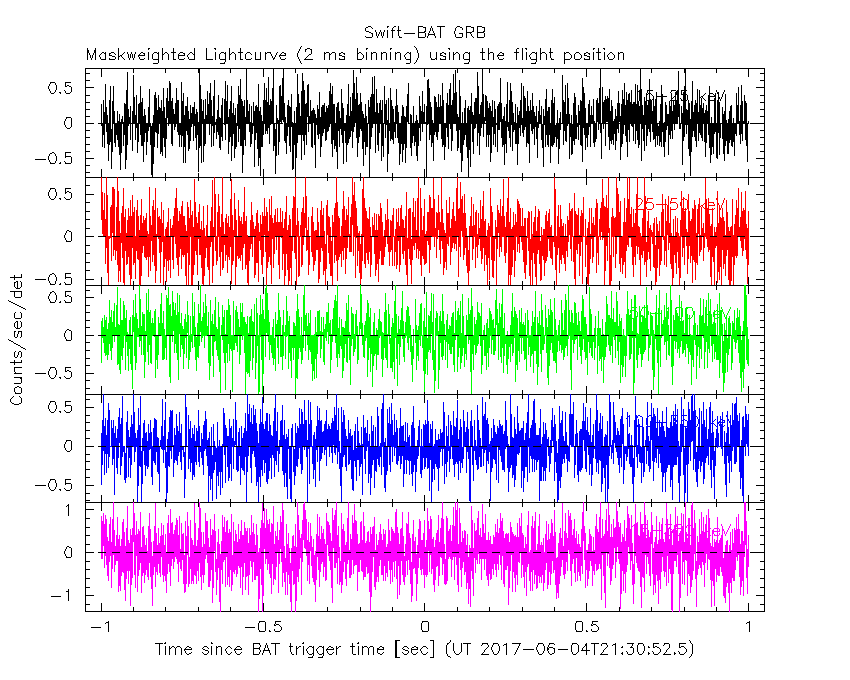
2 ms binning
From T100_start-1 s to T100_start+1 s
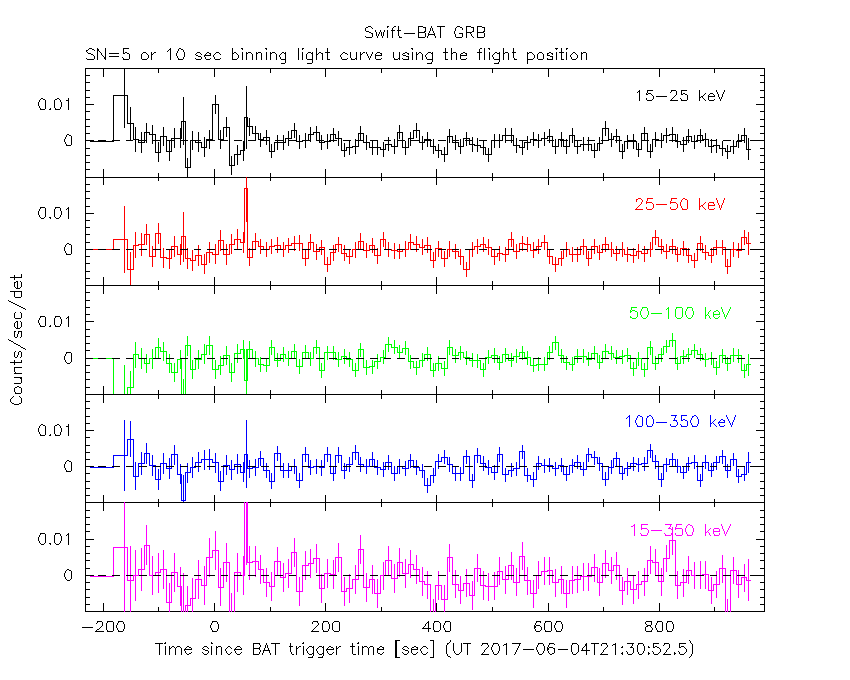
SN=5 or 10 sec. binning (whichever binning is satisfied first)
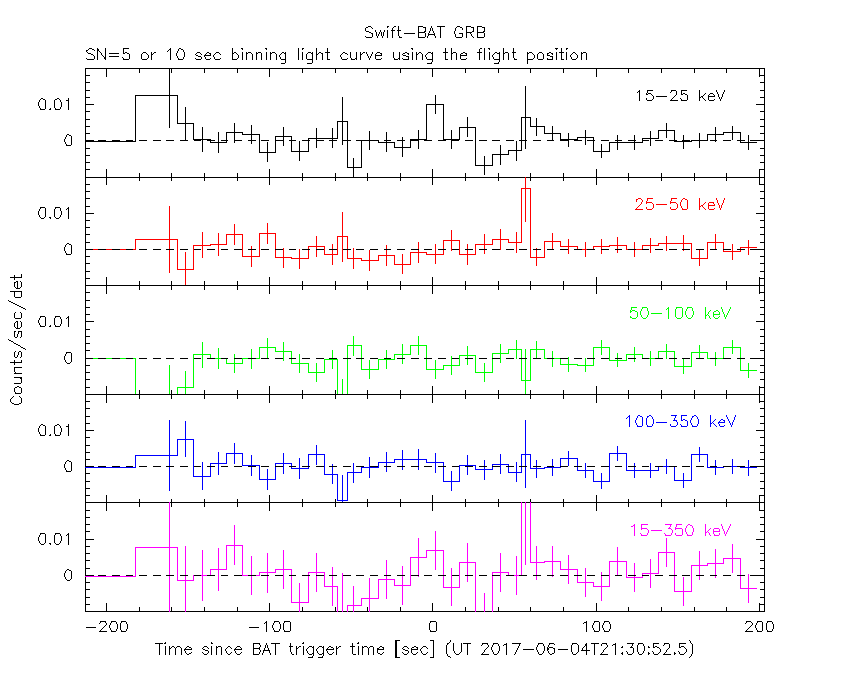
SN=5 or 10 sec. binning (T < 200 sec)
Spectra
Notes:
- 1) The fitting includes the systematic errors.
- 2) For long bursts, a spectral fit of the pre-slew DRM will introduce some errors in both a spectral shape and a normalization if the PHA file contains a lot of the slew/post-slew time interval.
- 3) For fits to more complicated models (e.g. a power-law over a cutoff power-law), the BAT team has decided to require a chi-square improvement of more than 6 for each extra dof.
- 4) For short bursts (T90<1sec), the specrtum is also fit with Blackbody, OTTB, and Double Blackbody.
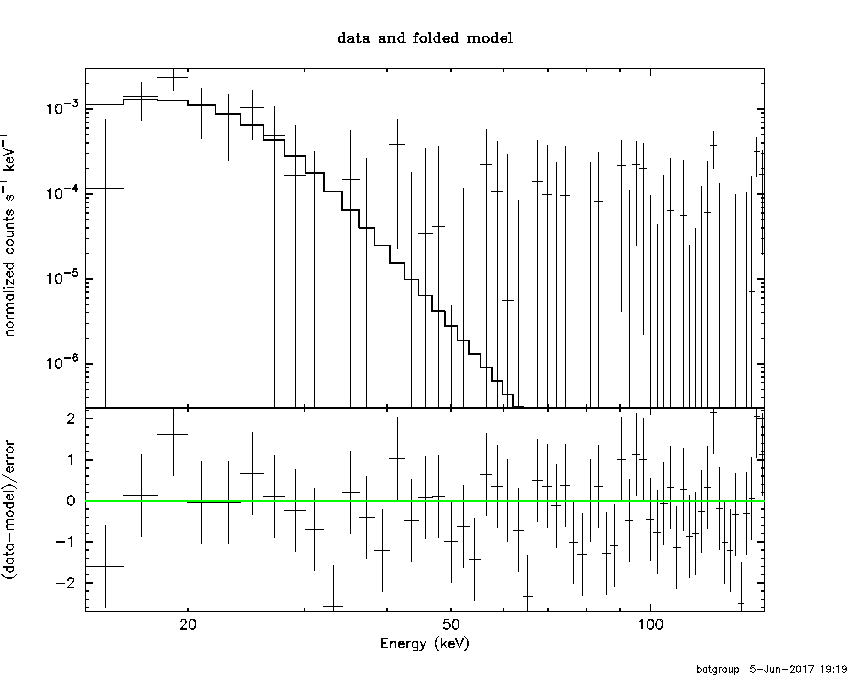
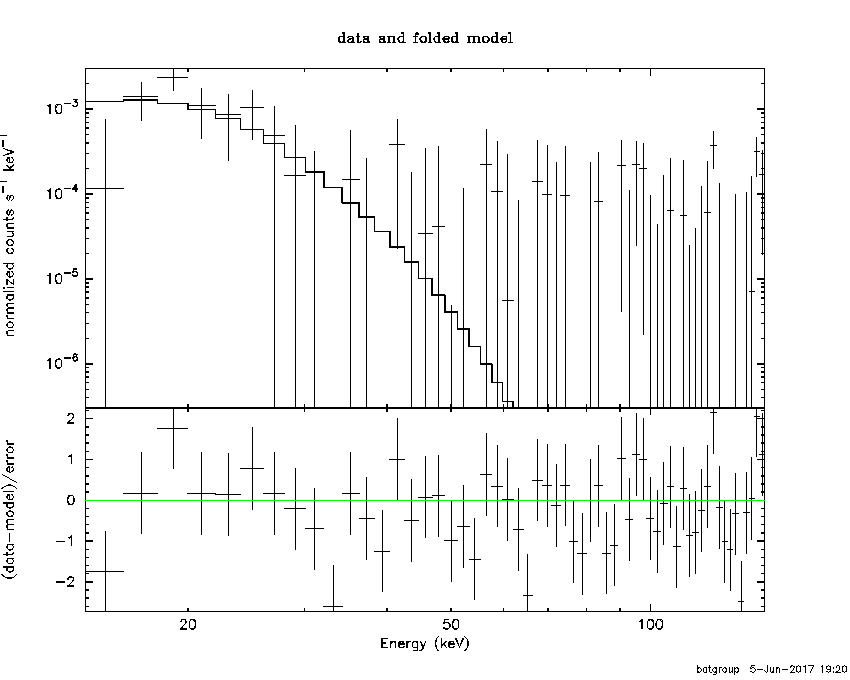
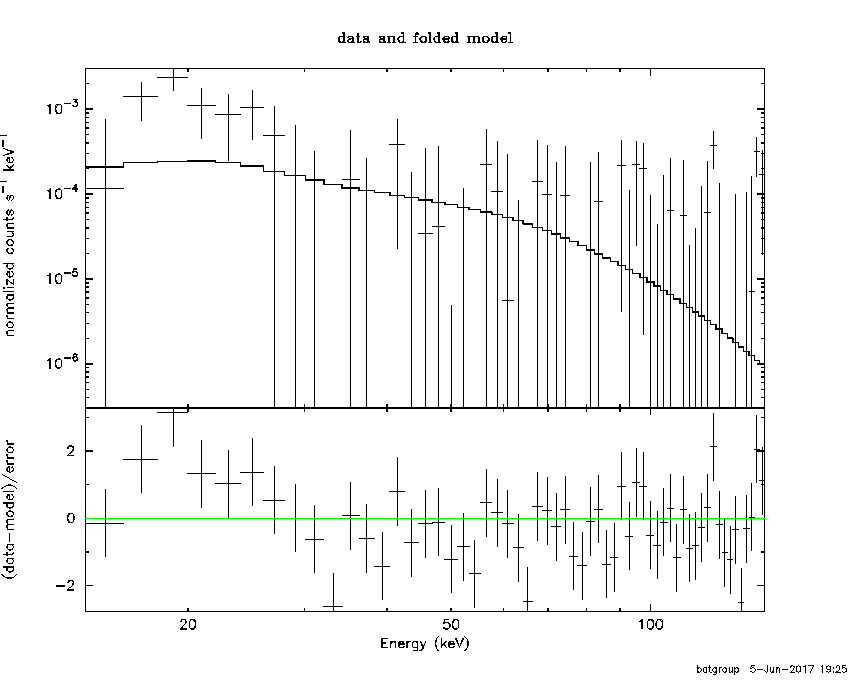
Time averaged spectrum fit using the pre-slew DRM
Power-law model

Time interval is from    0.000 sec. to    8.192 sec.

Spectral model in power-law:
------------------------------------------------------------
Parameters  : value       lower 90%   higher 90%
Photon index: 3.91849     ( -1.09077   1.6558 )
Norm@50keV  : 2.25593E-04    ( -0.000226302   0.000408716 )
------------------------------------------------------------
#Fit statistic : Chi-Squared =          64.44 using 59 PHA bins.
# Reduced chi-squared =          1.130 for     57 degrees of freedom
# Null hypothesis probability =   2.326178e-01

Photon flux (15-150 keV)    in 8.192 sec: 0.129720 ( -0.0640505  0.0667618 ) ph/cm2/s
Energy fluence (15-150 keV)             : 3.81697e-08 ( -2.0993e-08  2.5747e-08 ) ergs/cm2
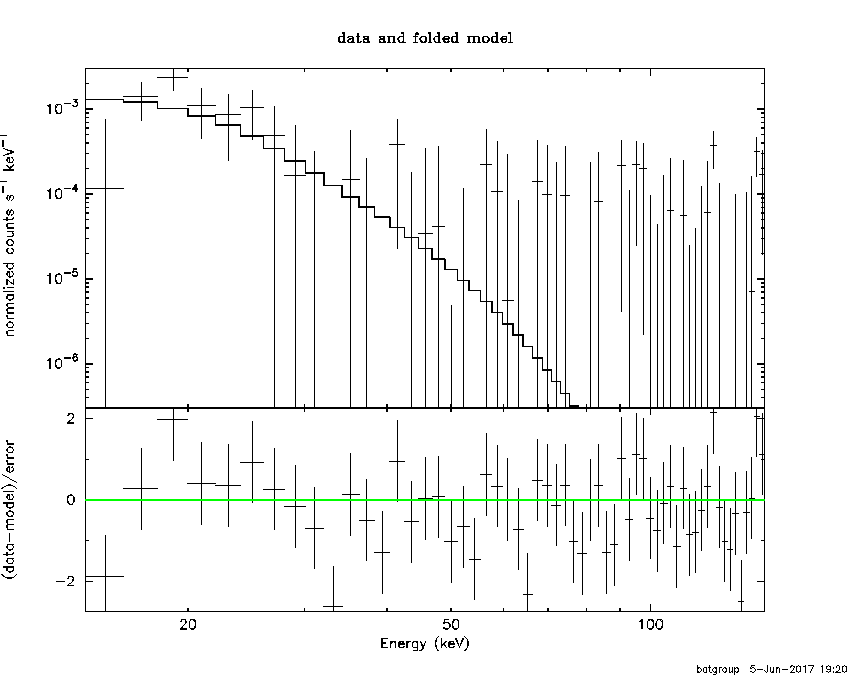
Cutoff power-law model

Time interval is from    0.000 sec. to    8.192 sec.
Spectral model in the cutoff power-law:
------------------------------------------------------------
Parameters  : value       lower 90%   higher 90%
Photon index: 1.00000     (     )
Epeak [keV] : 50.0000      (   )
Norm@50keV  : 1.46459E-03    (     )
------------------------------------------------------------
#Fit statistic : Chi-Squared =          74.33 using 59 PHA bins.
# Reduced chi-squared =          1.327 for     56 degrees of freedom
# Null hypothesis probability =   5.111028e-02

Photon flux (15-150 keV)    in 8.192 sec: 0.166384 0.166941 (    ) ph/cm2/s
Energy fluence (15-150 keV)             : 2.94354e-17 ( 0  0 ) ergs/cm2
Band function
Time interval is from    0.000 sec. to    8.192 sec.

Spectral model in the Band function:
------------------------------------------------------------
Parameters  : value       lower 90%   higher 90%
alpha       : 5.00000   ( -5.10351   -5 )
beta        : -9.37167    ( 9.37167   19.2841 )
Epeak [keV] : 17.8268      ( -3.54875 3.87053 )
Norm@50keV   : 3329.23    ( -1284.83   59934.6 )
------------------------------------------------------------
#Fit statistic : Chi-Squared =          58.50 using 59 PHA bins.
# Reduced chi-squared =          1.064 for     55 degrees of freedom
# Null hypothesis probability =   3.482967e-01

Photon flux (15-150 keV)    in 8.192 sec: 3.28740E-02 ( 6.96713  -0.032874 ) ph/cm2/s
Energy fluence (15-150 keV)             : 0 ( 0  0 ) ergs/cm2
Single BB
Spectral model blackbody:
------------------------------------------------------------
Parameters  : value    Lower 90%  Upper 90%
kT [keV]    : 3.86967  (-1.0211  1.32179)
R^2/D10^2   : 4.93524  (-4.92407   20.3998)
(R is the radius in km and D10 is the distance to the source in units of 10 kpc)
------------------------------------------------------------
#Fit statistic : Chi-Squared =          60.03 using 59 PHA bins.
# Reduced chi-squared =          1.053 for     57 degrees of freedom
# Null hypothesis probability =   3.666653e-01

Energy  Fluence     90% Error
[keV]   [erg/cm2]   [erg/cm2]
15- 25  3.125e-08   1.973e-08
25- 50  1.025e-08   7.422e-09
50-150  1.017e-10   1.393e-10
15-150  4.160e-08   2.560e-08
Thermal bremsstrahlung (OTTB)
Spectral model: thermal bremsstrahlung
------------------------------------------------------------
Parameters  : value         Lower 90%    Upper 90%
kT [keV]    : 9.16928       (-3.82733      8.46642)
Norm        : 5.93937       (-5.97808     18.4849)
------------------------------------------------------------
#Fit statistic : Chi-Squared =          62.11 using 59 PHA bins.
# Reduced chi-squared =          1.090 for     57 degrees of freedom
# Null hypothesis probability =   2.991589e-01

Energy  Fluence     90% Error
[keV]   [erg/cm2]   [erg/cm2]
15- 25  2.790e-08   1.729e-08
25- 50  1.065e-08   8.184e-09
50-150  5.719e-10   6.828e-10
15-150  3.912e-08   2.477e-08
Double BB

Spectral model: bbodyrad<1> + bbodyrad<2>
------------------------------------------------------------
Parameters  : value         Lower 90%    Upper 90%
kT1 [keV]   : 3.87862        (-1.02016      1.32285)
R1^2/D10^2  : 4.87903        (-4.9095      20.4125)
kT2 [keV]   : 8.01127E-02        (-0.0801127      -0.0801127)
R2^2/D10^2  : 2.03374E-02    (-0.0203407   -0.0203407)
------------------------------------------------------------
#Fit statistic : Chi-Squared =          60.03 using 59 PHA bins.
# Reduced chi-squared =          1.091 for     55 degrees of freedom
# Null hypothesis probability =   2.986002e-01

Energy  Fluence     90% Error
[keV]   [erg/cm2]   [erg/cm2]
15- 25  0.000e+00   0.000e+00
25- 50  0.000e+00   0.000e+00
50-150  0.000e+00   0.000e+00
15-150  0.000e+00   0.000e+00
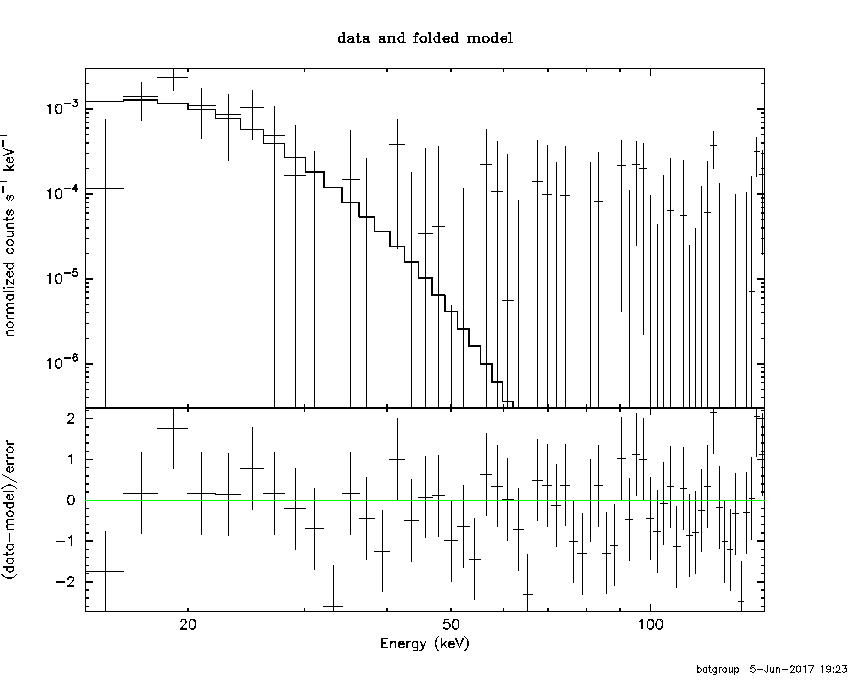
Peak spectrum fit
Power-law model

Time interval is from    0.000 sec. to    8.192 sec.

Spectral model in power-law:
------------------------------------------------------------
Parameters  : value       lower 90%   higher 90%
Photon index: 3.91849     ( -1.09077   1.6558 )
Norm@50keV  : 2.25593E-04    ( -0.000226302   0.000408716 )
------------------------------------------------------------
#Fit statistic : Chi-Squared =          64.44 using 59 PHA bins.
# Reduced chi-squared =          1.130 for     57 degrees of freedom
# Null hypothesis probability =   2.326178e-01

Photon flux (15-150 keV)    in 8.192 sec: 0.129720 ( -0.0640505  0.0667618 ) ph/cm2/s
Energy fluence (15-150 keV)             : 3.81697e-08 ( -2.0993e-08  2.5747e-08 ) ergs/cm2
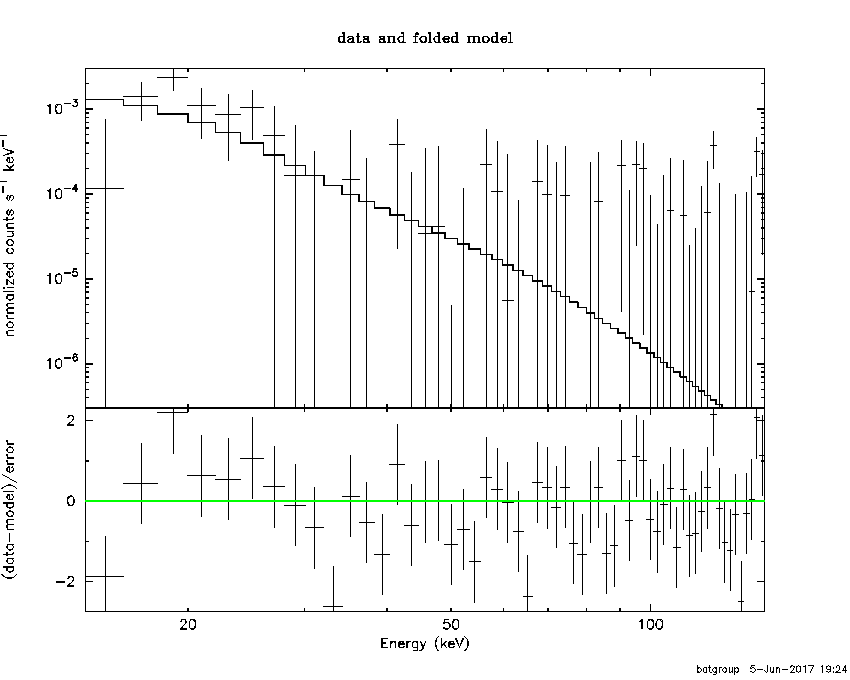
Cutoff power-law model

Time interval is from    0.000 sec. to    8.192 sec.
Spectral model in the cutoff power-law:
------------------------------------------------------------
Parameters  : value       lower 90%   higher 90%
Photon index: 1.00000     (     )
Epeak [keV] : 50.0000      (   )
Norm@50keV  : 1.46459E-03    (     )
------------------------------------------------------------
#Fit statistic : Chi-Squared =          74.33 using 59 PHA bins.
# Reduced chi-squared =          1.327 for     56 degrees of freedom
# Null hypothesis probability =   5.111028e-02

Photon flux (15-150 keV)    in 8.192 sec: 0.166384 0.166941 (    ) ph/cm2/s
Energy fluence (15-150 keV)             : 2.94354e-17 ( 0  0 ) ergs/cm2
Band function

Time interval is from    0.000 sec. to    8.192 sec.

Spectral model in the Band function:
------------------------------------------------------------
Parameters  : value       lower 90%   higher 90%
alpha       : 5.00000   ( -5.10351   -5 )
beta        : -9.37167    ( 9.37167   5.16881 )
Epeak [keV] : 17.8268      ( -3.54875 3.87053 )
Norm@50keV   : 3329.23    ( -1284.83   59934.6 )
------------------------------------------------------------
#Fit statistic : Chi-Squared =          58.50 using 59 PHA bins.
# Reduced chi-squared =          1.064 for     55 degrees of freedom
# Null hypothesis probability =   3.482967e-01

Photon flux (15-150 keV)    in 8.192 sec: 3.28740E-02 ( 6.96713  -0.032874 ) ph/cm2/s
Energy fluence (15-150 keV)             : 0 ( 0  0 ) ergs/cm2
Single BB

Spectral model blackbody:
------------------------------------------------------------
Parameters  : value    Lower 90%  Upper 90%
kT [keV]    : 3.86967  (-1.0211  1.32179)
R^2/D10^2   : 4.93524  (-4.92407   20.3998)
(R is the radius in km and D10 is the distance to the source in units of 10 kpc)
------------------------------------------------------------
#Fit statistic : Chi-Squared =          60.03 using 59 PHA bins.
# Reduced chi-squared =          1.053 for     57 degrees of freedom
# Null hypothesis probability =   3.666653e-01

Energy  Fluence     90% Error
[keV]   [erg/cm2]   [erg/cm2]
15- 25  3.125e-08   1.840e-08
25- 50  1.025e-08   7.156e-09
50-150  1.017e-10   1.184e-10
15-150  4.160e-08   2.728e-08
Thermal bremsstrahlung (OTTB)

Spectral model: thermal bremsstrahlung
------------------------------------------------------------
Parameters  : value         Lower 90%    Upper 90%
kT [keV]    : 9.16928       (-3.82733      8.46642)
Norm        : 5.93937       (-5.97808     18.4849)
------------------------------------------------------------
#Fit statistic : Chi-Squared =          62.11 using 59 PHA bins.
# Reduced chi-squared =          1.090 for     57 degrees of freedom
# Null hypothesis probability =   2.991589e-01

Energy  Fluence     90% Error
[keV]   [erg/cm2]   [erg/cm2]
15- 25  2.790e-08   1.676e-08
25- 50  1.065e-08   7.082e-09
50-150  5.719e-10   6.619e-10
15-150  3.912e-08   2.550e-08
Double BB
Spectral model: bbodyrad<1> + bbodyrad<2>
------------------------------------------------------------
Parameters  : value         Lower 90%    Upper 90%
kT1 [keV]   : 3.87862        (-1.02016      1.32285)
R1^2/D10^2  : 4.87903        (-4.9095      20.4125)
kT2 [keV]   : 8.01127E-02        (-0.0801127      -0.0801127)
R2^2/D10^2  : 2.03374E-02    (-0.0203407   -0.0203407)
------------------------------------------------------------
#Fit statistic : Chi-Squared =          60.03 using 59 PHA bins.
# Reduced chi-squared =          1.091 for     55 degrees of freedom
# Null hypothesis probability =   2.986002e-01

Energy  Fluence     90% Error
[keV]   [erg/cm2]   [erg/cm2]
15- 25  0.000e+00   0.000e+00
25- 50  0.000e+00   0.000e+00
50-150  0.000e+00   0.000e+00
15-150  0.000e+00   0.000e+00
Pre-slew spectrum (Pre-slew PHA with pre-slew DRM)
Power-law model
Spectral model in power-law:
------------------------------------------------------------
Parameters  : value       lower 90%   higher 90%
Photon index: 3.91849     ( -1.09077   1.6558 )
Norm@50keV  : 2.25593E-04    ( -0.000226302   0.000408716 )
------------------------------------------------------------
#Fit statistic : Chi-Squared =          64.44 using 59 PHA bins.
# Reduced chi-squared =          1.130 for     57 degrees of freedom
# Null hypothesis probability =   2.326178e-01

Photon flux (15-150 keV)    in 8.192 sec: 0.129720 ( -0.0640505  0.0667618 ) ph/cm2/s
Energy fluence (15-150 keV)             : 3.81697e-08 ( -2.0993e-08  2.5747e-08 ) ergs/cm2
Cutoff power-law model
Spectral model in the cutoff power-law:
------------------------------------------------------------
Parameters  : value       lower 90%   higher 90%
Photon index: 1.00000     (     )
Epeak [keV] : 50.0000      (   )
Norm@50keV  : 1.46459E-03    (     )
------------------------------------------------------------
#Fit statistic : Chi-Squared =          74.33 using 59 PHA bins.
# Reduced chi-squared =          1.327 for     56 degrees of freedom
# Null hypothesis probability =   5.111028e-02

Photon flux (15-150 keV)    in 8.192 sec: 0.166384 0.166941 (    ) ph/cm2/s
Energy fluence (15-150 keV)             : 2.94354e-17 ( 0  0 ) ergs/cm2
Band function

Spectral model in the Band function:
------------------------------------------------------------
Parameters  : value       lower 90%   higher 90%
alpha       : 5.00000   ( -5.10351   -5 )
beta        : -9.37167    ( 9.37167   5.16623 )
Epeak [keV] : 17.8268      ( -3.54875 3.87053 )
Norm@50keV   : 3329.23    ( -1284.83   59934.6 )
------------------------------------------------------------
#Fit statistic : Chi-Squared =          58.50 using 59 PHA bins.
# Reduced chi-squared =          1.064 for     55 degrees of freedom
# Null hypothesis probability =   3.482967e-01

Photon flux (15-150 keV)    in 8.192 sec: 3.28740E-02 ( 6.96713  -0.032874 ) ph/cm2/s
Energy fluence (15-150 keV)             : 0 ( 0  0 ) ergs/cm2
S(25-50 keV) vs. S(50-100 keV) plot
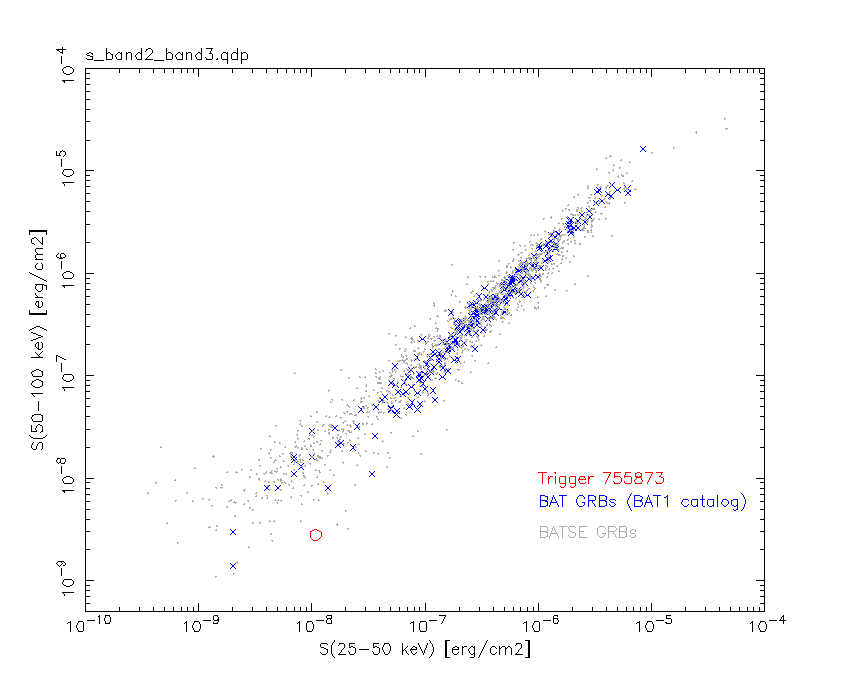
S(25-50 keV)  = 1.08e-08
S(50-100 keV) = 2.81e-09
T90 vs. Hardness ratio plot
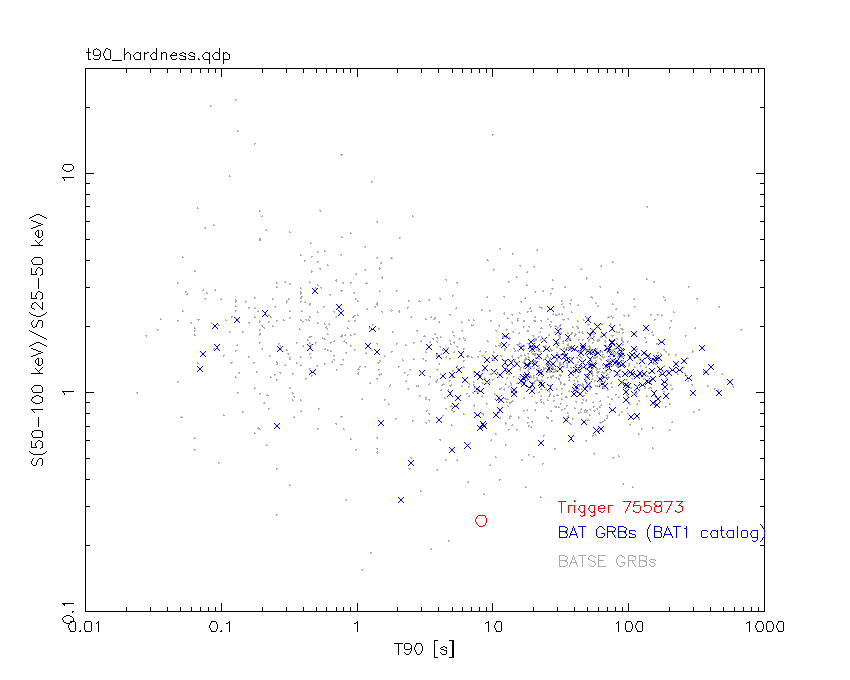
T90                                   = 8.19199997186661 sec.
Hardness ratio (energy fluence ratio) = 0.260185
Color vs. Color plot
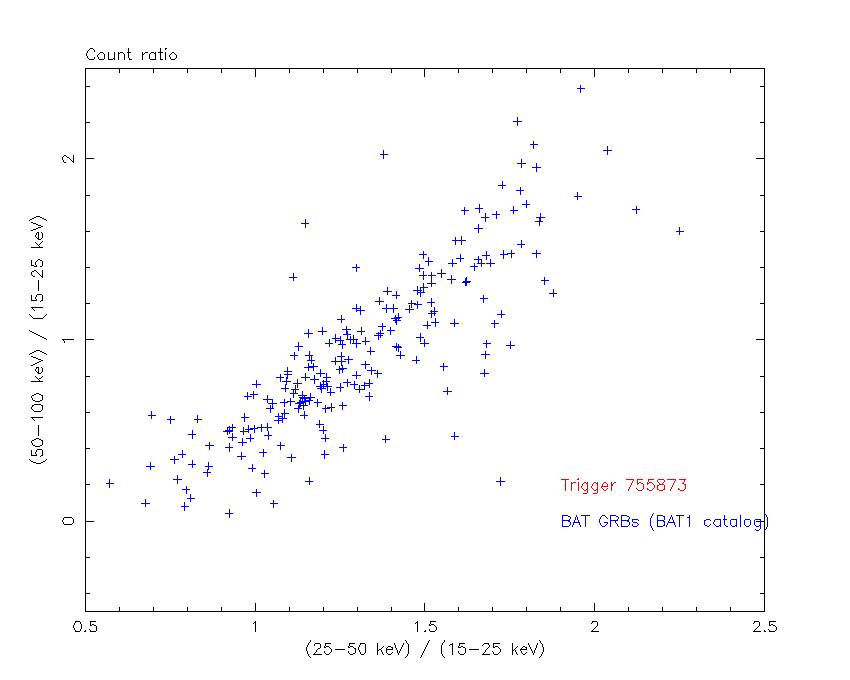
Count Ratio  (25-50 keV) / (15-25 keV) = -0.0108199
Count Ratio (50-100 keV) / (15-25 keV) = -0.290706
Mask shadow pattern
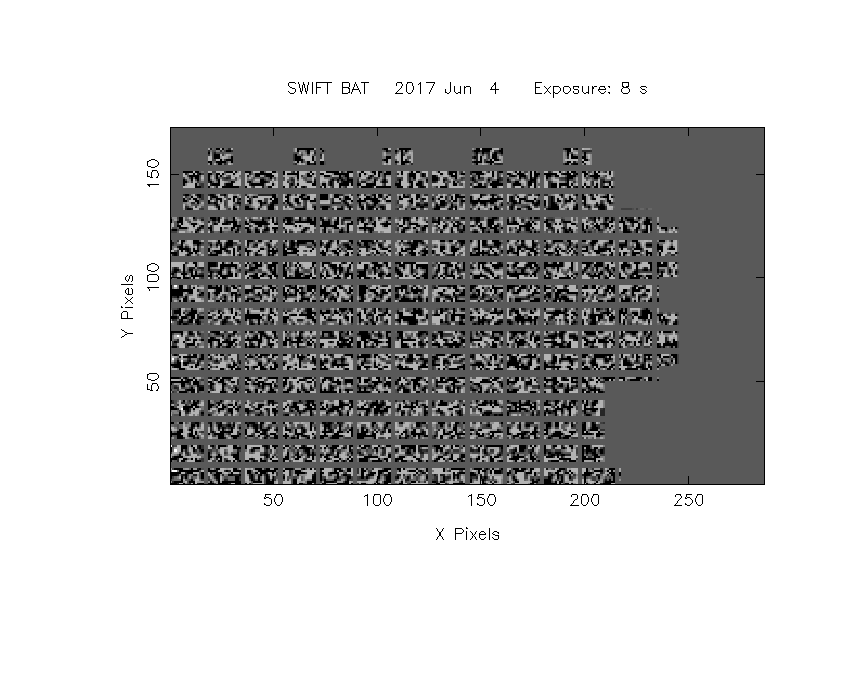
IMX = 7.412586521998601E-01, IMY = 2.620184635337902E-01
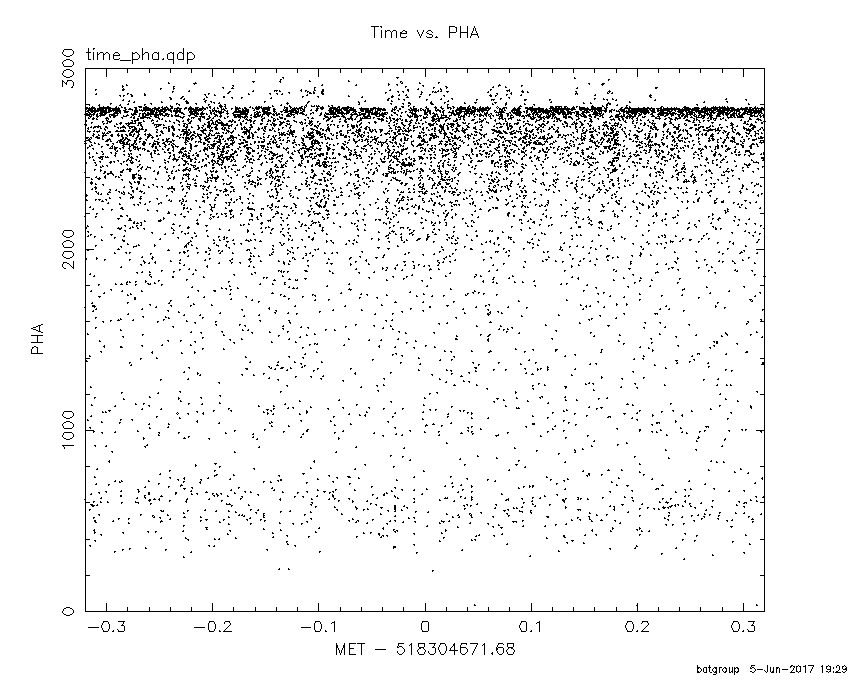
TIME vs. PHA plot around the trigger time
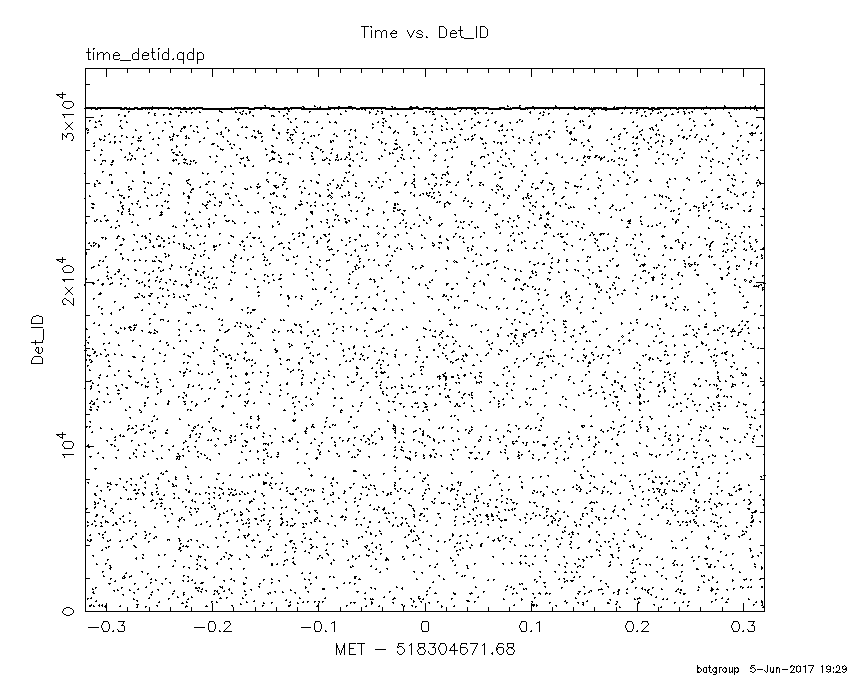
TIME vs. DetID plot around the trigger time
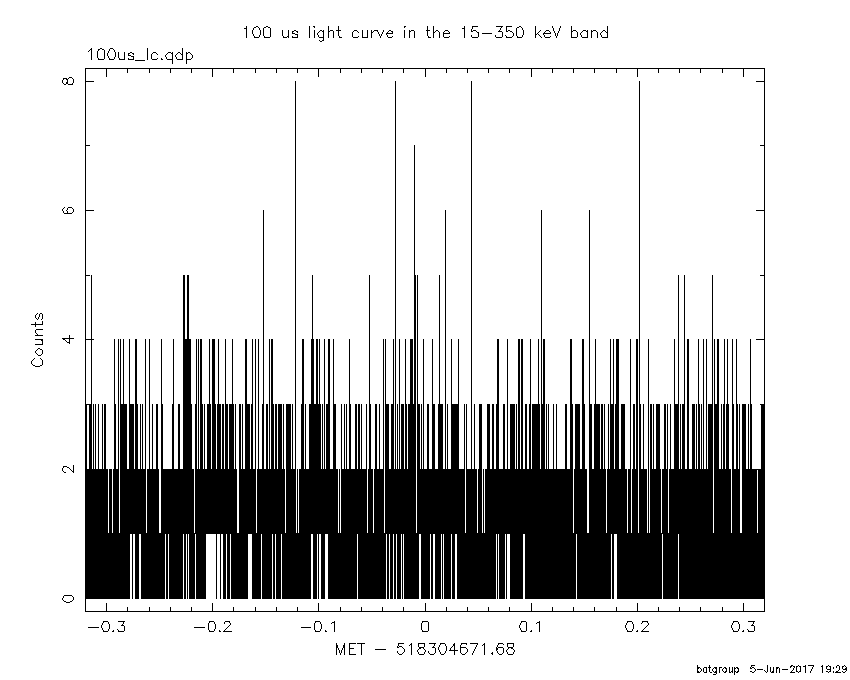
100 us light curve (15-350 keV)
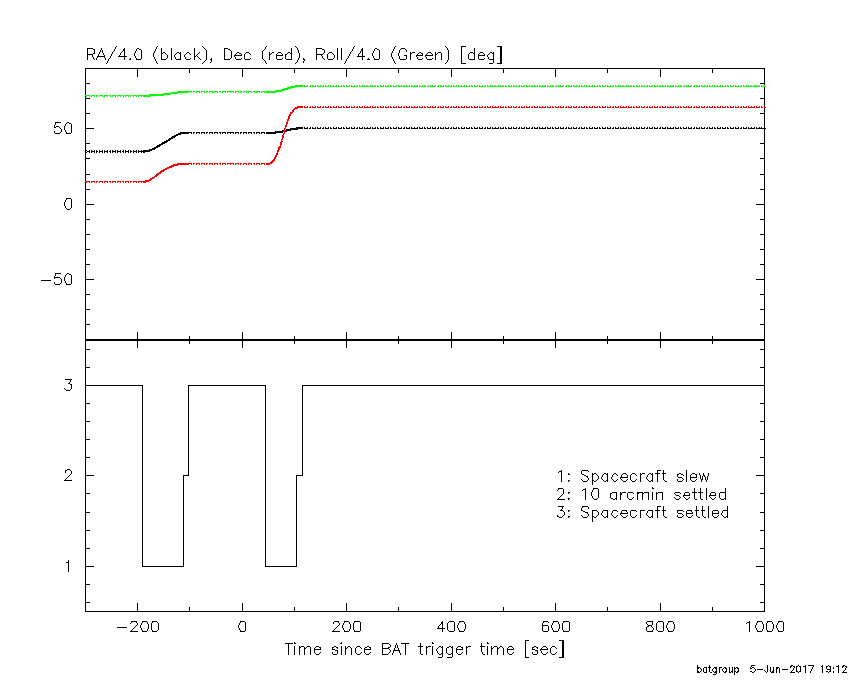
Spacecraft aspect plot
Bright source in the pre-burst/pre-slew/post-slew images
Pre-burst image of 15-350 keV band
Time interval of the image:
-113.179400 -54.961200
-53.680000 -23.680000

# RAcent  DECcent POSerr Theta    Phi  PeakCts   SNR AngSep     Name
#  [deg]    [deg]    ['] [deg]  [deg]                   [']
172.4126   2.2424    2.1  29.4 -170.8   0.7679   5.6 ------	UNKNOWN
156.4168 -21.5364    1.9  57.8 -170.6   5.0609   5.9 ------	UNKNOWN
238.8562  79.3736    2.9  56.7  -17.6   2.2402   4.1 ------	UNKNOWN
149.6512   0.2460    3.1  46.5 -145.4   1.2250   3.7 ------	UNKNOWN
Pre-slew background subtracted image of 15-350 keV band
Time interval of the image:
0.000000 8.192000

# RAcent  DECcent POSerr Theta    Phi  PeakCts   SNR AngSep     Name
#  [deg]    [deg]    ['] [deg]  [deg]                   [']
184.8451 -11.7571    2.1  38.7  159.8   0.3392   5.4 ------	UNKNOWN
Post-slew image of 15-350 keV band
Time interval of the image:
104.620590 962.339300

# RAcent  DECcent POSerr Theta    Phi  PeakCts   SNR AngSep     Name
#  [deg]    [deg]    ['] [deg]  [deg]                   [']
221.4628  41.0926    2.9  26.0  100.1   3.3746   4.0 ------	UNKNOWN
170.9667  31.1052    4.3  38.0 -178.7   2.3960   2.7 ------	UNKNOWN
 54.0117  71.9049    3.6  42.0  -57.3   7.0068   3.2 ------	UNKNOWN
129.5080  38.4602    3.5  48.0 -129.1  11.9673   3.3 ------	UNKNOWN
Plot creation:
Mon Jun  5 19:31:34 EDT 2017