Special notes of this burst
Image
Pre-slew 15.0-350.0 keV image (Event data)
#   RAcent    DECcent   POSerr    Theta     Phi              Peak Cts       SNR   Name
    7.3580     9.2245   0.0064    28.0316   132.9764         6.2914612     29.875 TRIG_00756284

Foreground time interval of the image:
-122.995  13.805 (delta_t = 136.800 [sec])
Background time interval of the image:
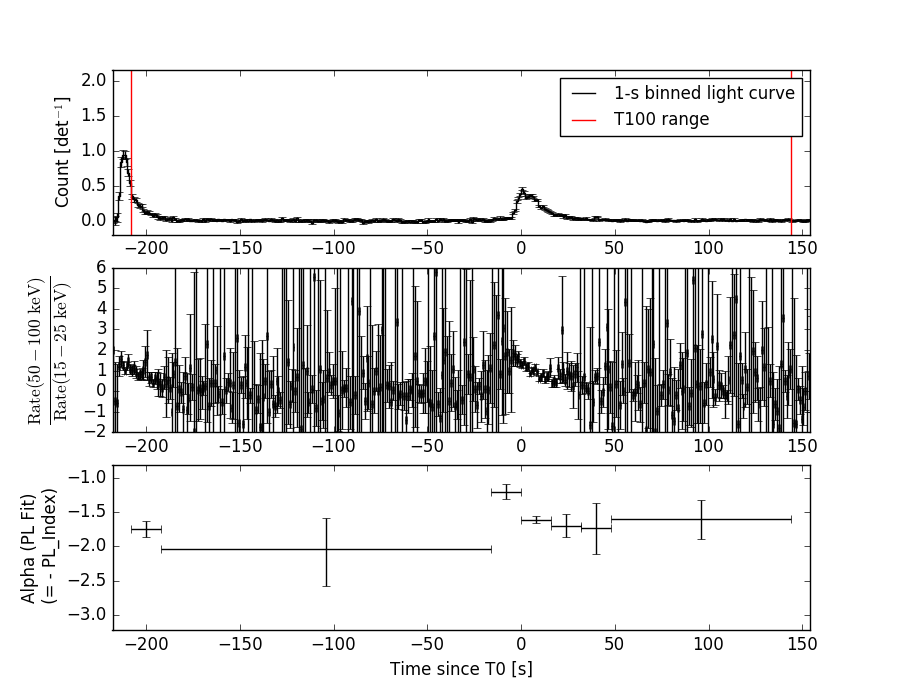
Lightcurves
Notes:
- 1) The mask-weighted light curves are using the flight position.
- 2) Multiple plots of different time binning/intervals are shown to cover all scenarios of short/long GRBs, rate/image triggers, and real/false positives.
- 3) For all the mask-weighted lightcurves, the y-axis units are counts/sec/det where a det is 0.4 x 0.4 = 0.16 sq cm.
- 4) The verticle lines correspond to following: green dotted lines are T50 interval, black dotted lines are T90 interval, blue solid line(s) is a spacecraft slew start time, and orange solid line(s) is a spacecraft slew end time.
- 5) Time of each bin is in the middle of the bin.
1 s binning
From T0-310 s to T0+310 s
From T100_start - 20 s to T100_end + 30 s
Full time interval

64 ms binning
Full time interval
From T100_start to T100_end
From T0-5 sec to T0+5 sec
16 ms binning
From T100_start-5 s to T100_start+5 s
Blue+Cyan dotted lines: Time interval of the scaled map
From 0.000000 to 1.024000
8 ms binning
From T100_start-3 s to T100_start+3 s

Blue+Cyan dotted lines: Time interval of the scaled map
From 0.000000 to 1.024000
2 ms binning
From T100_start-1 s to T100_start+1 s
Blue+Cyan dotted lines: Time interval of the scaled map
From 0.000000 to 1.024000
SN=5 or 10 sec. binning (whichever binning is satisfied first)
SN=5 or 10 sec. binning (T < 200 sec)
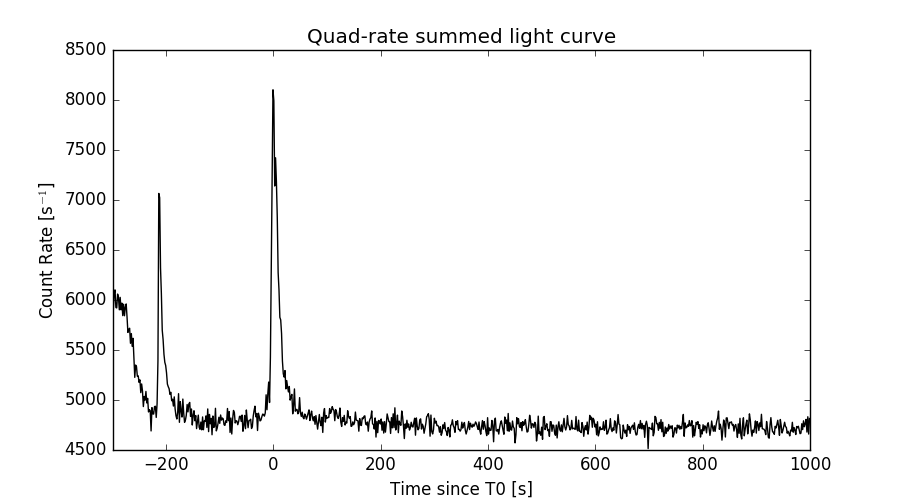
Quad-rate summed light curves (from T0-300s to T0+1000s)
Spectral Evolution
Spectra
Notes:
- 1) The fitting includes the systematic errors.
- 2) When the burst includes telescope slew time periods, the fitting uses an average response file made from multiple 5-s response files through out the slew time plus single time preiod for the non-slew times, and weighted by the total counts in the corresponding time period using addrmf. An average response file is needed becuase a spectral fit using the pre-slew DRM will introduce some errors in both a spectral shape and a normalization if the PHA file contains a lot of the slew/post-slew time interval.
- 3) For fits to more complicated models (e.g. a power-law over a cutoff power-law), the BAT team has decided to require a chi-square improvement of more than 6 for each extra dof.
Time averaged spectrum fit using the average DRM
Power-law model
Time interval is from -207.896 sec. to  144.104 sec.

Spectral model in power-law:
------------------------------------------------------------
Parameters  : value       lower 90%   higher 90%
Photon index: 1.62528     ( -0.0721692   0.072468 )
Norm@50keV  : 2.32298E-03    ( -8.958e-05   8.93247e-05 )
------------------------------------------------------------
#Fit statistic : Chi-Squared =          42.22 using 59 PHA bins.
# Reduced chi-squared =         0.7408 for     57 degrees of freedom
# Null hypothesis probability =   9.280700e-01

Photon flux (15-150 keV)    in 352 sec: 0.300910 ( -0.012181  0.01223 ) ph/cm2/s
Energy fluence (15-150 keV)             : 7.62576e-06 ( -3.11465e-07  3.12448e-07 ) ergs/cm2
Cutoff power-law model
Time interval is from -207.896 sec. to  144.104 sec.
Spectral model in the cutoff power-law:
------------------------------------------------------------
Parameters  : value       lower 90%   higher 90%
Photon index: 1.62335     ( -0.243878   0.111382 )
Epeak [keV] : 9996.03      ( -9995.7 -9995.7 )
Norm@50keV  : 2.32821E-03    ( -8.9223e-05   0.000848082 )
------------------------------------------------------------
#Fit statistic : Chi-Squared =          42.22 using 59 PHA bins.
# Reduced chi-squared =         0.7540 for     56 degrees of freedom
# Null hypothesis probability =   9.134945e-01

Photon flux (15-150 keV)    in 352 sec: 0.300692 ( -0.013345  0.012407 ) ph/cm2/s
Energy fluence (15-150 keV)             : 7.6189e-06 ( -3.55119e-07  3.18581e-07 ) ergs/cm2
Band function

Time interval is from -207.896 sec. to  144.104 sec.


Spectral model in the Band function:
------------------------------------------------------------
Parameters  : value       lower 90%   higher 90%
alpha       :    (     )
beta        :     (     )
Epeak [keV] :       (   )
Norm@50keV   :     (     )
------------------------------------------------------------

Photon flux (15-150 keV)    in  sec:  (    ) ph/cm2/s
Energy fluence (15-150 keV)             : 0 ( 0  0 ) ergs/cm2
Single BB
Spectral model blackbody:
------------------------------------------------------------
Parameters  : value    Lower 90%  Upper 90%
kT [keV]    : 14.4877  (  )
R^2/D10^2   : 3.57598E-02  (   )
(R is the radius in km and D10 is the distance to the source in units of 10 kpc)
------------------------------------------------------------
#Fit statistic : Chi-Squared =         224.50 using 59 PHA bins.
# Reduced chi-squared =         3.9386 for     57 degrees of freedom
# Null hypothesis probability =   9.822845e-22

Energy  Fluence     90% Error
[keV]   [erg/cm2]   [erg/cm2]
15- 25  5.559e-07   4.365e-08
25- 50  2.138e-06   1.056e-07
50-150  3.006e-06   2.306e-07
15-150  5.700e-06   2.429e-07
Thermal bremsstrahlung (OTTB)
Spectral model: thermal bremsstrahlung
------------------------------------------------------------
Parameters  : value         Lower 90%    Upper 90%
kT [keV]    : 179.451       (-34.7772      -179.004)
Norm        : 1.21014       (-0.0520357     0.0574796)
------------------------------------------------------------
#Fit statistic : Chi-Squared =          46.37 using 59 PHA bins.
# Reduced chi-squared =         0.8136 for     57 degrees of freedom
# Null hypothesis probability =   8.416296e-01

Energy  Fluence     90% Error
[keV]   [erg/cm2]   [erg/cm2]
15- 25  1.075e-06   6.600e-08
25- 50  2.041e-06   2.072e-07
50-150  4.317e-06   1.281e-06
15-150  7.432e-06   1.452e-06
Double BB
Spectral model: bbodyrad<1> + bbodyrad<2>
------------------------------------------------------------
Parameters  : value         Lower 90%    Upper 90%
kT1 [keV]   : 7.31013        (-0.847887      0.899953)
R1^2/D10^2  : 0.297594        (-0.0971898      0.162458)
kT2 [keV]   : 29.3227        (-4.16412      6.19915)
R2^2/D10^2  : 2.32851E-03    (-0.00110105   0.00169078)
------------------------------------------------------------
#Fit statistic : Chi-Squared =          45.32 using 59 PHA bins.
# Reduced chi-squared =         0.8239 for     55 degrees of freedom
# Null hypothesis probability =   8.210034e-01

Energy  Fluence     90% Error
[keV]   [erg/cm2]   [erg/cm2]
15- 25  1.050e-06   1.183e-07
25- 50  2.079e-06   1.734e-07
50-150  4.455e-06   7.836e-07
15-150  7.584e-06   8.096e-07
Peak spectrum fit
Power-law model
Time interval is from    7.604 sec. to    8.604 sec.

Spectral model in power-law:
------------------------------------------------------------
Parameters  : value       lower 90%   higher 90%
Photon index: 1.66607     ( -0.163981   0.167266 )
Norm@50keV  : 2.06408E-02    ( -0.00210146   0.00207279 )
------------------------------------------------------------
#Fit statistic : Chi-Squared =          57.95 using 59 PHA bins.
# Reduced chi-squared =          1.017 for     57 degrees of freedom
# Null hypothesis probability =   4.399693e-01

Photon flux (15-150 keV)    in 1 sec: 2.70974 ( -0.25239  0.25253 ) ph/cm2/s
Energy fluence (15-150 keV)             : 1.91695e-07 ( -2.06186e-08  2.08691e-08 ) ergs/cm2
Cutoff power-law model
Time interval is from    7.604 sec. to    8.604 sec.
Spectral model in the cutoff power-law:
------------------------------------------------------------
Parameters  : value       lower 90%   higher 90%
Photon index: 1.58305     ( -0.627121   0.717751 )
Epeak [keV] : 220.114      (   )
Norm@50keV  : 2.28991E-02    (     )
------------------------------------------------------------
#Fit statistic : Chi-Squared =          57.89 using 59 PHA bins.
# Reduced chi-squared =          1.034 for     56 degrees of freedom
# Null hypothesis probability =   4.053505e-01

Photon flux (15-150 keV)    in 1 sec: 2.70123 ( -0.25364  0.25808 ) ph/cm2/s
Energy fluence (15-150 keV)             : 1.90187e-07 ( -2.31049e-08  2.20201e-08 ) ergs/cm2
Band function

Time interval is from    7.604 sec. to    8.604 sec.


Spectral model in the Band function:
------------------------------------------------------------
Parameters  : value       lower 90%   higher 90%
alpha       :    (     )
beta        :     (     )
Epeak [keV] :       (   )
Norm@50keV   :     (     )
------------------------------------------------------------

Photon flux (15-150 keV)    in  sec:  (    ) ph/cm2/s
Energy fluence (15-150 keV)             : 0 ( 0  0 ) ergs/cm2
Single BB

Spectral model blackbody:
------------------------------------------------------------
Parameters  : value    Lower 90%  Upper 90%
kT [keV]    : 11.9112  (-1.48229  1.78556)
R^2/D10^2   : 0.668293  (-0.266583   0.421582)
(R is the radius in km and D10 is the distance to the source in units of 10 kpc)
------------------------------------------------------------
#Fit statistic : Chi-Squared =          93.68 using 59 PHA bins.
# Reduced chi-squared =          1.644 for     57 degrees of freedom
# Null hypothesis probability =   1.582049e-03

Energy  Fluence     90% Error
[keV]   [erg/cm2]   [erg/cm2]
15- 25  2.004e-08   3.445e-09
25- 50  6.252e-08   7.715e-09
50-150  5.307e-08   1.159e-08
15-150  1.356e-07   1.505e-08
Thermal bremsstrahlung (OTTB)
Spectral model: thermal bremsstrahlung
------------------------------------------------------------
Parameters  : value         Lower 90%    Upper 90%
kT [keV]    : 148.970       (-54.113      -147.594)
Norm        : 11.1444       (-1.14883     1.4665)
------------------------------------------------------------
#Fit statistic : Chi-Squared =          58.58 using 59 PHA bins.
# Reduced chi-squared =          1.028 for     57 degrees of freedom
# Null hypothesis probability =   4.170765e-01

Energy  Fluence     90% Error
[keV]   [erg/cm2]   [erg/cm2]
15- 25  2.864e-08   5.515e-09
25- 50  5.303e-08   1.581e-08
50-150  1.044e-07   5.448e-08
15-150  1.861e-07   7.243e-08
Double BB

Spectral model: bbodyrad<1> + bbodyrad<2>
------------------------------------------------------------
Parameters  : value         Lower 90%    Upper 90%
kT1 [keV]   : 6.95577        (-1.28661      1.40901)
R1^2/D10^2  : 3.55794        (-1.69016      3.83085)
kT2 [keV]   : 30.1867        (-7.96036      16.7878)
R2^2/D10^2  : 1.86783E-02    (-0.0137519   0.0354152)
------------------------------------------------------------
#Fit statistic : Chi-Squared =          54.06 using 59 PHA bins.
# Reduced chi-squared =         0.9828 for     55 degrees of freedom
# Null hypothesis probability =   5.107034e-01

Energy  Fluence     90% Error
[keV]   [erg/cm2]   [erg/cm2]
15- 25  3.013e-08   9.945e-09
25- 50  5.357e-08   1.602e-08
50-150  1.114e-07   5.735e-08
15-150  1.950e-07   7.053e-08
Pre-slew spectrum (Pre-slew PHA with pre-slew DRM)
Power-law model
Spectral model in power-law:
------------------------------------------------------------
Parameters  : value       lower 90%   higher 90%
Photon index: 1.46504     ( -0.0881133   0.0881966 )
Norm@50keV  : 3.07804E-03    ( -0.000148099   0.000147811 )
------------------------------------------------------------
#Fit statistic : Chi-Squared =          42.29 using 59 PHA bins.
# Reduced chi-squared =         0.7419 for     57 degrees of freedom
# Null hypothesis probability =   9.270420e-01

Photon flux (15-150 keV)    in 136.8 sec: 0.380761 ( -0.0189562  0.0190087 ) ph/cm2/s
Energy fluence (15-150 keV)             : 4.01845e-06 ( -2.11485e-07  2.12404e-07 ) ergs/cm2
Cutoff power-law model
Spectral model in the cutoff power-law:
------------------------------------------------------------
Parameters  : value       lower 90%   higher 90%
Photon index: 1.38174     ( -0.335087   0.162168 )
Epeak [keV] : 384.874      ( -384.874 -384.874 )
Norm@50keV  : 3.38020E-03    ( -0.00043435   0.00149246 )
------------------------------------------------------------
#Fit statistic : Chi-Squared =          42.09 using 59 PHA bins.
# Reduced chi-squared =         0.7516 for     56 degrees of freedom
# Null hypothesis probability =   9.158703e-01

Photon flux (15-150 keV)    in 136.8 sec: 0.378884 ( -0.020142  0.020068 ) ph/cm2/s
Energy fluence (15-150 keV)             : 3.99429e-06 ( -2.2992e-07  2.29619e-07 ) ergs/cm2
Band function
Spectral model in the Band function:
------------------------------------------------------------
Parameters  : value       lower 90%   higher 90%
alpha       :    (     )
beta        :     (     )
Epeak [keV] :       (   )
Norm@50keV   :     (     )
------------------------------------------------------------

Photon flux (15-150 keV)    in  sec:  (    ) ph/cm2/s
Energy fluence (15-150 keV)             : 0 ( 0  0 ) ergs/cm2
S(25-50 keV) vs. S(50-100 keV) plot
S(25-50 keV)  = 2.00e-06
S(50-100 keV) = 2.59e-06
T90 vs. Hardness ratio plot
T90                                   = 320 sec.
Hardness ratio (energy fluence ratio) = 1.295
Color vs. Color plot
Count Ratio  (25-50 keV) / (15-25 keV) = 1.29068
Count Ratio (50-100 keV) / (15-25 keV) = 0.919339
Mask shadow pattern
IMX = -3.629465970071011E-01, IMY = -3.895343691985889E-01
TIME vs. PHA plot around the trigger time

Blue+Cyan dotted lines: Time interval of the scaled map
From 0.000000 to 1.024000
TIME vs. DetID plot around the trigger time
Blue+Cyan dotted lines: Time interval of the scaled map
From 0.000000 to 1.024000
100 us light curve (15-350 keV)
Blue+Cyan dotted lines: Time interval of the scaled map
From 0.000000 to 1.024000
Spacecraft aspect plot
Bright source in the pre-burst/pre-slew/post-slew images
Pre-burst image of 15-350 keV band
Time interval of the image:
Pre-slew background subtracted image of 15-350 keV band
Time interval of the image:
-122.995400 13.804600

# RAcent  DECcent POSerr Theta    Phi  PeakCts   SNR AngSep     Name
#  [deg]    [deg]    ['] [deg]  [deg]                   [']
357.3081  15.8868    1.8  39.6  137.9   2.3065   6.3 ------	UNKNOWN
357.4795  25.7640    2.4  43.9  151.3   1.9051   4.8 ------	UNKNOWN
  7.3580   9.2245    0.4  28.0  133.0   6.2906  29.9 ------	UNKNOWN
 13.4773  25.3928    2.3  32.7  166.2   1.1081   5.0 ------	UNKNOWN
  2.0004  49.8441    1.9  57.4  177.7   6.0188   6.0 ------	UNKNOWN
 63.4691 -51.7358    3.5  56.8   -0.2   2.6704   3.3 ------	UNKNOWN
 69.5285 -23.8268    2.6  41.7  -32.3   1.2838   4.4 ------	UNKNOWN
 73.3284   4.4960    3.5  40.0  -76.6   2.2105   3.3 ------	UNKNOWN
 77.1245  -3.6513    3.4  43.5  -64.2   2.5482   3.4 ------	UNKNOWN
 61.9377  39.6879    3.0  48.1 -129.2   3.4264   3.9 ------	UNKNOWN
 62.7977  37.9781    2.8  47.2 -127.0   3.6046   4.1 ------	UNKNOWN
Post-slew image of 15-350 keV band
Time interval of the image:
62.404590 836.886000
900.104000 962.157600

# RAcent  DECcent POSerr Theta    Phi  PeakCts   SNR AngSep     Name
#  [deg]    [deg]    ['] [deg]  [deg]                   [']
326.2369  38.2280    7.0  46.9  156.1   2.6455   1.7    6.4	Cyg X-2
 13.5503 -13.5443    3.3  23.6    6.0   1.7877   3.5 ------	UNKNOWN
 29.5390 -40.4280    2.5  53.7    0.3   6.9802   4.6 ------	UNKNOWN
 15.4297  -2.3488    2.7  14.1  -14.0   2.0825   4.2 ------	UNKNOWN
 40.8430  48.1001    3.0  48.0 -129.1  10.9304   3.8 ------	UNKNOWN
 46.9500  26.2135    4.9  41.1  -98.4   6.5090   2.4 ------	UNKNOWN
 52.4685  -4.2975    3.4  46.9  -54.0   9.6062   3.4 ------	UNKNOWN
Plot creation:
Thu Jun 22 11:31:05 EDT 2017