Estimated redshift from machine learning (Ukwatta et al. 2016) - may take a few minutes to calcaulte
Image
Pre-slew 15-350 keV image (Event data; bkg subtracted)

#   RAcent  DECcent POSerr  Theta    Phi     Peak Cts     SNR  Name
  262.6324  -5.9687 0.0417    8.3 -172.7       0.4946     4.6  TRIG_00756953
------------------------------------------

Foreground time interval of the image:
  0.000  64.000 (delta_t =  64.000 [sec])
Background time interval of the image:
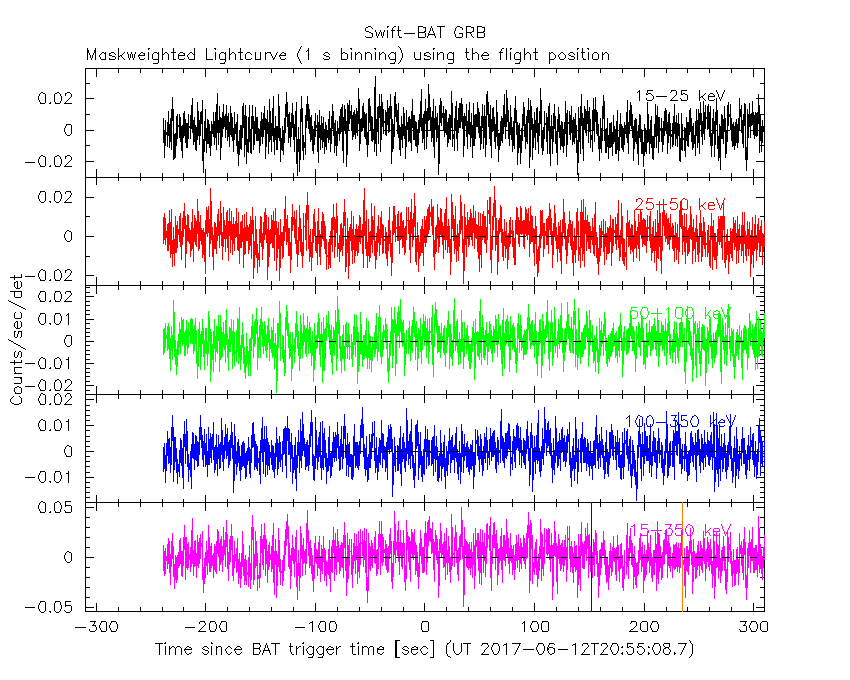
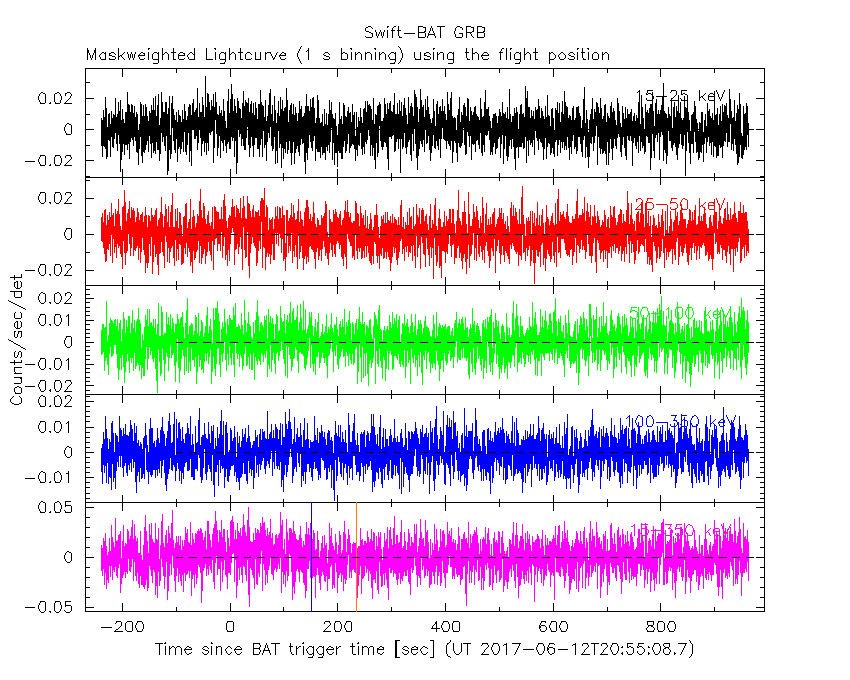
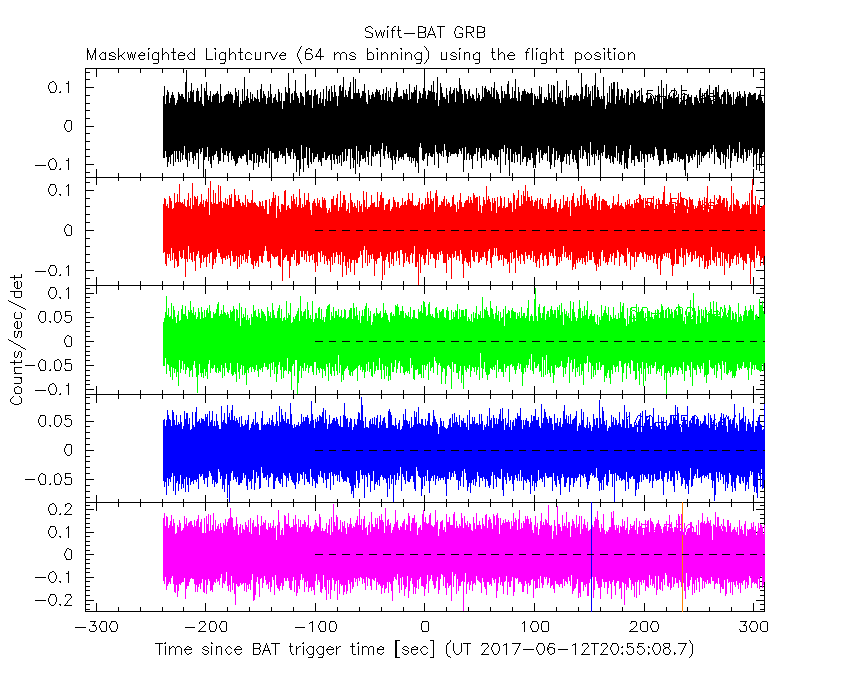
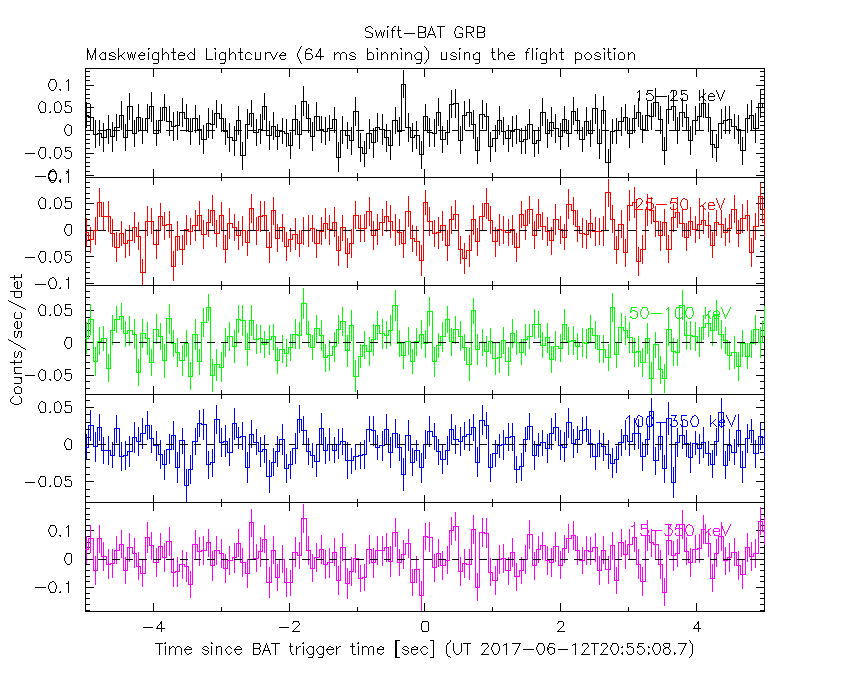
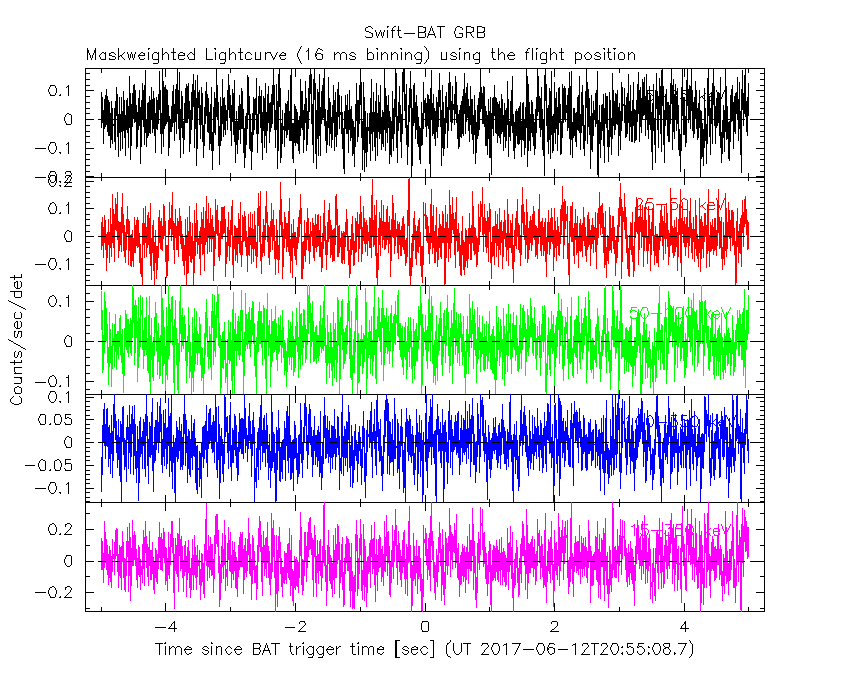
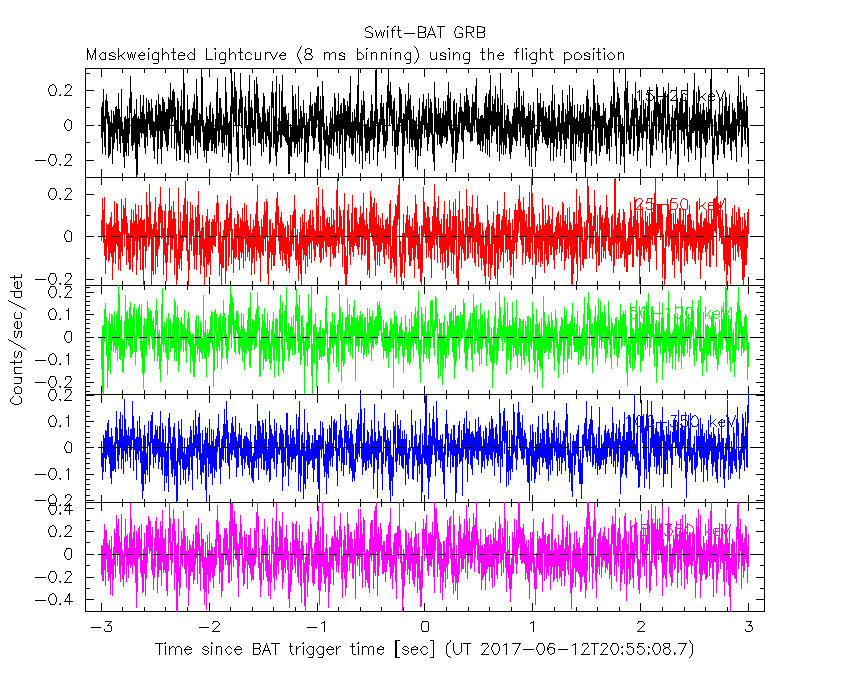
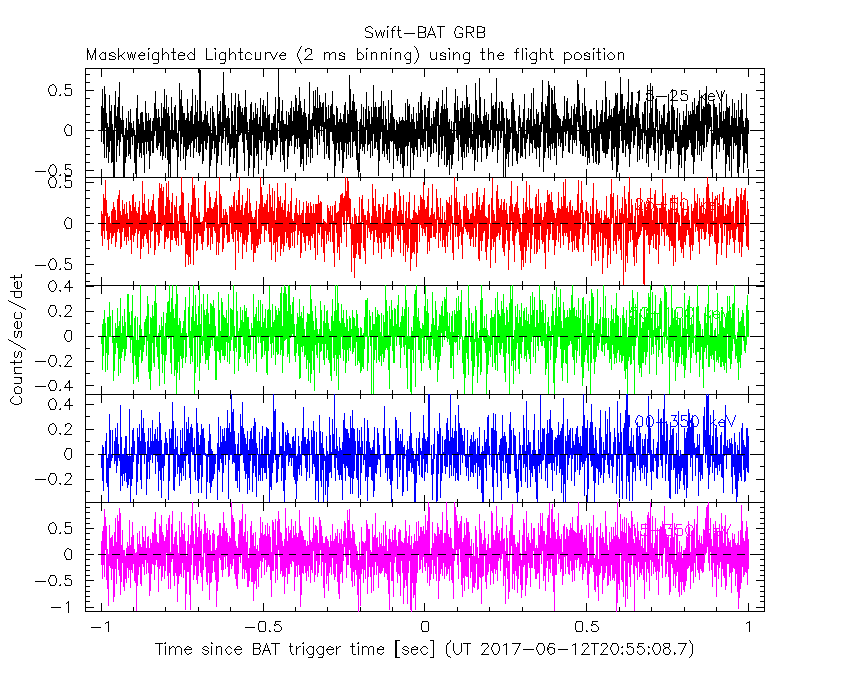
Lightcurves
Notes:
- 1) All plots contain as much data as has been downloaded to date.
- 2) The mask-weighted light curves are using the flight position.
- 3) Multiple plots of different time binning/intervals are shown to cover all scenarios of short/long GRBs, rate/image triggers, and real/false positives.
- 4) For all the mask-weighted lightcurves, the y-axis units are counts/sec/det where a det is 0.4 x 0.4 = 0.16 sq cm.
- 5) The verticle lines correspond to following: green dotted lines are T50 interval, black dotted lines are T90 interval, blue solid line(s) is a spacecraft slew start time, and orange solid line(s) is a spacecraft slew end time.
- 6) Time of each bin is in the middle of the bin.
1 s binning
From T0-310 s to T0+310 s
From T100_start - 20 s to T100_end + 30 s
Full time interval
64 ms binning
Full time interval
From T100_start to T100_end
From T0-5 sec to T0+5 sec
16 ms binning
From T100_start-5 s to T100_start+5 s
8 ms binning
From T100_start-3 s to T100_start+3 s
2 ms binning
From T100_start-1 s to T100_start+1 s
SN=5 or 10 sec. binning (whichever binning is satisfied first)

SN=5 or 10 sec. binning (T < 200 sec)

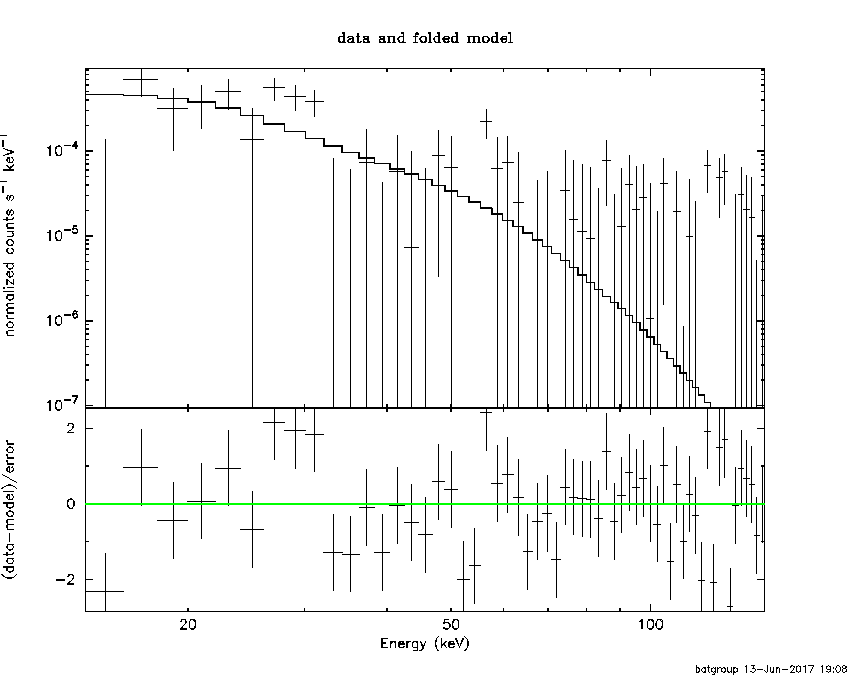
Spectra
Notes:
- 1) The fitting includes the systematic errors.
- 2) For long bursts, a spectral fit of the pre-slew DRM will introduce some errors in both a spectral shape and a normalization if the PHA file contains a lot of the slew/post-slew time interval.
- 3) For fits to more complicated models (e.g. a power-law over a cutoff power-law), the BAT team has decided to require a chi-square improvement of more than 6 for each extra dof.
- 4) For short bursts (T90<1sec), the specrtum is also fit with Blackbody, OTTB, and Double Blackbody.
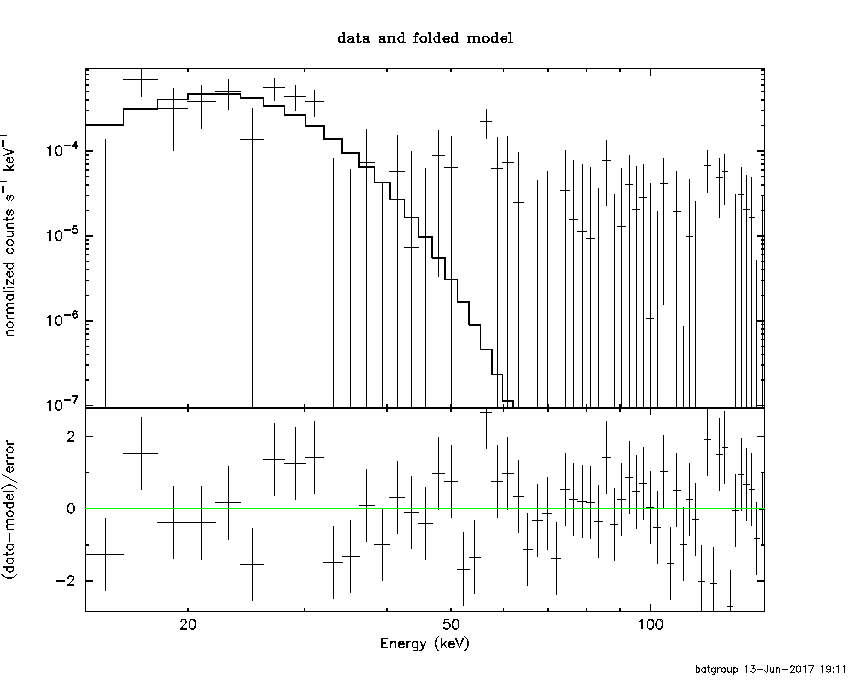
Time averaged spectrum fit using the pre-slew DRM
Power-law model

Time interval is from    0.000 sec. to   64.000 sec.

Spectral model in power-law:
------------------------------------------------------------
Parameters  : value       lower 90%   higher 90%
Photon index: 2.64755     ( -0.609242   0.734699 )
Norm@50keV  : 2.72202E-04    ( -0.000141529   0.000156033 )
------------------------------------------------------------
#Fit statistic : Chi-Squared =          82.14 using 59 PHA bins.
# Reduced chi-squared =          1.441 for     57 degrees of freedom
# Null hypothesis probability =   1.626808e-02

Photon flux (15-150 keV)    in 64 sec: 5.86780E-02 ( -0.0192675  0.0194073 ) ph/cm2/s
Energy fluence (15-150 keV)             : 1.81594e-07 ( -6.93907e-08  7.84384e-08 ) ergs/cm2
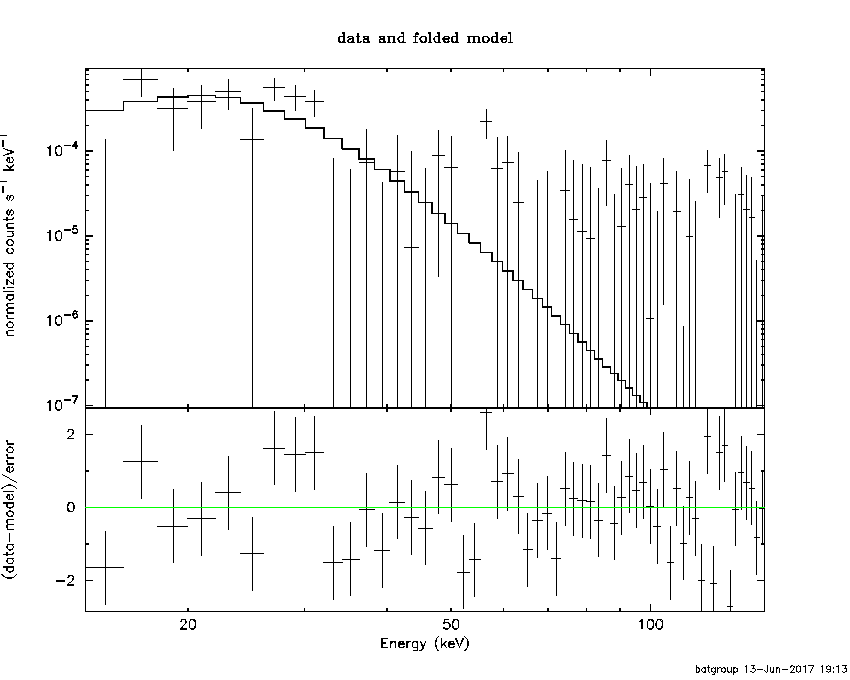
Cutoff power-law model

Time interval is from    0.000 sec. to   64.000 sec.
Spectral model in the cutoff power-law:
------------------------------------------------------------
Parameters  : value       lower 90%   higher 90%
Photon index: -9.96537     (     )
Epeak [keV] : 25.0048      (   )
Norm@50keV  : 5.21954E+05    (     )
------------------------------------------------------------
#Fit statistic : Chi-Squared =          71.75 using 59 PHA bins.
# Reduced chi-squared =          1.281 for     56 degrees of freedom
# Null hypothesis probability =   7.647009e-02

Photon flux (15-150 keV)    in 64 sec: 5.92780E-02 5.89613E-02 (    ) ph/cm2/s
Energy fluence (15-150 keV)             : 5.24253e-18 ( 0  0 ) ergs/cm2
Band function

Time interval is from    0.000 sec. to   64.000 sec.

Spectral model in the Band function:
------------------------------------------------------------
Parameters  : value       lower 90%   higher 90%
alpha       : 5.00000   ( -3.58553   -5 )
beta        : -6.40716    ( 6.40666   13.008 )
Epeak [keV] : 24.4522      ( -3.67641 4.01758 )
Norm@50keV   : 118.190    ( -33.5354   264.912 )
------------------------------------------------------------
#Fit statistic : Chi-Squared =          73.52 using 59 PHA bins.
# Reduced chi-squared =          1.337 for     55 degrees of freedom
# Null hypothesis probability =   4.830380e-02

Photon flux (15-150 keV)    in 64 sec:  (    ) ph/cm2/s
Energy fluence (15-150 keV)             : 0 ( 0  0 ) ergs/cm2
Single BB

Spectral model blackbody:
------------------------------------------------------------
Parameters  : value    Lower 90%  Upper 90%
kT [keV]    : 5.87939  (-1.21153  1.58431)
R^2/D10^2   : 0.265424  (-0.264865   0.475377)
(R is the radius in km and D10 is the distance to the source in units of 10 kpc)
------------------------------------------------------------
#Fit statistic : Chi-Squared =          75.97 using 59 PHA bins.
# Reduced chi-squared =          1.333 for     57 degrees of freedom
# Null hypothesis probability =   4.731982e-02

Energy  Fluence     90% Error
[keV]   [erg/cm2]   [erg/cm2]
15- 25  7.574e-08   4.490e-08
25- 50  7.224e-08   4.653e-08
50-150  6.082e-09   5.677e-09
15-150  1.541e-07   9.258e-08
Thermal bremsstrahlung (OTTB)

Spectral model: thermal bremsstrahlung
------------------------------------------------------------
Parameters  : value         Lower 90%    Upper 90%
kT [keV]    : 21.5467       (-9.12888      21.3886)
Norm        : 0.678964       (-0.346512     0.682414)
------------------------------------------------------------
#Fit statistic : Chi-Squared =          79.63 using 59 PHA bins.
# Reduced chi-squared =          1.397 for     57 degrees of freedom
# Null hypothesis probability =   2.554753e-02

Energy  Fluence     90% Error
[keV]   [erg/cm2]   [erg/cm2]
15- 25  7.160e-08   4.344e-08
25- 50  6.630e-08   4.147e-08
50-150  2.244e-08   1.970e-08
15-150  1.603e-07   1.049e-07
Double BB

Spectral model: bbodyrad<1> + bbodyrad<2>
------------------------------------------------------------
Parameters  : value         Lower 90%    Upper 90%
kT1 [keV]   : 5.85204        (-5.88938      28.0804)
R1^2/D10^2  : 0.261686        (-0.257837      -0.257837)
kT2 [keV]   : 5.86643        (-5.92181      -5.92181)
R2^2/D10^2  : 9.28710E-03    (-0.00613033   -0.00613033)
------------------------------------------------------------
#Fit statistic : Chi-Squared =          75.97 using 59 PHA bins.
# Reduced chi-squared =          1.381 for     55 degrees of freedom
# Null hypothesis probability =   3.202735e-02

Energy  Fluence     90% Error
[keV]   [erg/cm2]   [erg/cm2]
15- 25  7.609e-08   2.083e+00
25- 50  7.184e-08   1.762e+01
50-150  5.934e-09   4.346e+02
15-150  1.539e-07   4.074e+02
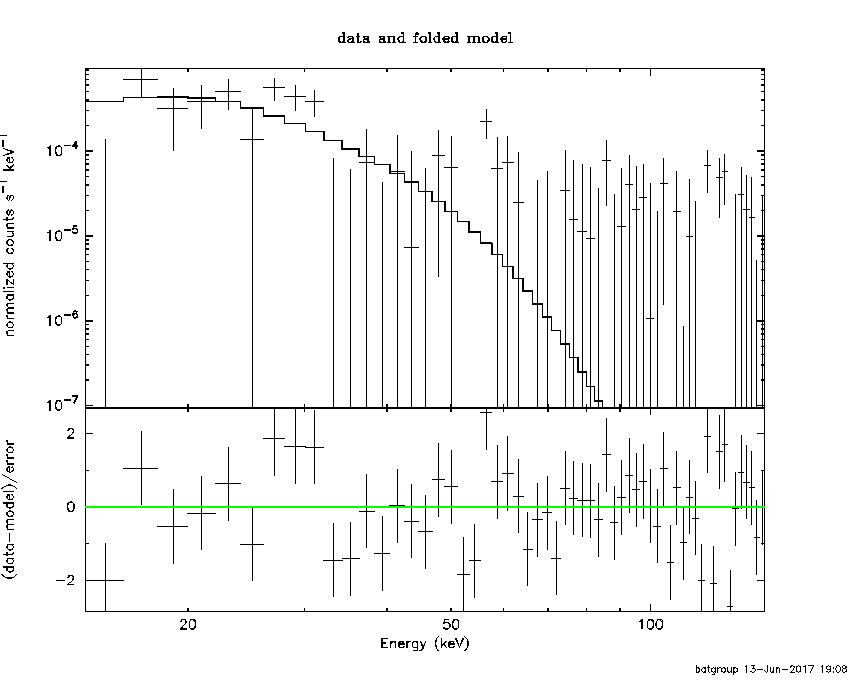
Peak spectrum fit
Power-law model

Time interval is from    0.000 sec. to   64.000 sec.

Spectral model in power-law:
------------------------------------------------------------
Parameters  : value       lower 90%   higher 90%
Photon index: 2.64755     ( -0.609242   0.734699 )
Norm@50keV  : 2.72202E-04    ( -0.000141529   0.000156033 )
------------------------------------------------------------
#Fit statistic : Chi-Squared =          82.14 using 59 PHA bins.
# Reduced chi-squared =          1.441 for     57 degrees of freedom
# Null hypothesis probability =   1.626808e-02

Photon flux (15-150 keV)    in 64 sec: 5.86780E-02 ( -0.0192675  0.0194073 ) ph/cm2/s
Energy fluence (15-150 keV)             : 1.81594e-07 ( -6.93907e-08  7.84384e-08 ) ergs/cm2
Cutoff power-law model

Time interval is from    0.000 sec. to   64.000 sec.
Spectral model in the cutoff power-law:
------------------------------------------------------------
Parameters  : value       lower 90%   higher 90%
Photon index: -9.96537     (     )
Epeak [keV] : 25.0048      (   )
Norm@50keV  : 5.21954E+05    (     )
------------------------------------------------------------
#Fit statistic : Chi-Squared =          71.75 using 59 PHA bins.
# Reduced chi-squared =          1.281 for     56 degrees of freedom
# Null hypothesis probability =   7.647009e-02

Photon flux (15-150 keV)    in 64 sec: 5.92780E-02 5.89613E-02 (    ) ph/cm2/s
Energy fluence (15-150 keV)             : 5.24253e-18 ( 0  0 ) ergs/cm2
Band function

Time interval is from    0.000 sec. to   64.000 sec.

Spectral model in the Band function:
------------------------------------------------------------
Parameters  : value       lower 90%   higher 90%
alpha       : 5.00000   ( -3.58553   -5 )
beta        : -6.40716    ( 6.40666   13.008 )
Epeak [keV] : 24.4522      ( -3.67641 4.01758 )
Norm@50keV   : 118.190    ( -33.5354   264.912 )
------------------------------------------------------------
#Fit statistic : Chi-Squared =          73.52 using 59 PHA bins.
# Reduced chi-squared =          1.337 for     55 degrees of freedom
# Null hypothesis probability =   4.830380e-02

Photon flux (15-150 keV)    in 64 sec:  (    ) ph/cm2/s
Energy fluence (15-150 keV)             : 0 ( 0  0 ) ergs/cm2
Single BB

Spectral model blackbody:
------------------------------------------------------------
Parameters  : value    Lower 90%  Upper 90%
kT [keV]    : 5.87939  (-1.21153  1.58431)
R^2/D10^2   : 0.265424  (-0.264865   0.475377)
(R is the radius in km and D10 is the distance to the source in units of 10 kpc)
------------------------------------------------------------
#Fit statistic : Chi-Squared =          75.97 using 59 PHA bins.
# Reduced chi-squared =          1.333 for     57 degrees of freedom
# Null hypothesis probability =   4.731982e-02

Energy  Fluence     90% Error
[keV]   [erg/cm2]   [erg/cm2]
15- 25  7.574e-08   4.496e-08
25- 50  7.224e-08   4.605e-08
50-150  6.082e-09   5.165e-09
15-150  1.541e-07   9.542e-08
Thermal bremsstrahlung (OTTB)
Spectral model: thermal bremsstrahlung
------------------------------------------------------------
Parameters  : value         Lower 90%    Upper 90%
kT [keV]    : 21.5467       (-9.12888      21.3886)
Norm        : 0.678964       (-0.346512     0.682414)
------------------------------------------------------------
#Fit statistic : Chi-Squared =          79.63 using 59 PHA bins.
# Reduced chi-squared =          1.397 for     57 degrees of freedom
# Null hypothesis probability =   2.554753e-02

Energy  Fluence     90% Error
[keV]   [erg/cm2]   [erg/cm2]
15- 25  7.160e-08   4.389e-08
25- 50  6.630e-08   4.269e-08
50-150  2.244e-08   2.086e-08
15-150  1.603e-07   1.016e-07
Double BB
Spectral model: bbodyrad<1> + bbodyrad<2>
------------------------------------------------------------
Parameters  : value         Lower 90%    Upper 90%
kT1 [keV]   : 5.85204        (-5.88938      28.0804)
R1^2/D10^2  : 0.261686        (-0.257837      -0.257837)
kT2 [keV]   : 5.86643        (-5.92181      -5.92181)
R2^2/D10^2  : 9.28710E-03    (-0.00613033   -0.00613033)
------------------------------------------------------------
#Fit statistic : Chi-Squared =          75.97 using 59 PHA bins.
# Reduced chi-squared =          1.381 for     55 degrees of freedom
# Null hypothesis probability =   3.202735e-02

Energy  Fluence     90% Error
[keV]   [erg/cm2]   [erg/cm2]
15- 25  7.609e-08   1.804e+00
25- 50  7.184e-08   1.781e+01
50-150  5.934e-09   4.570e+02
15-150  1.539e-07   4.288e+02
Pre-slew spectrum (Pre-slew PHA with pre-slew DRM)
Power-law model
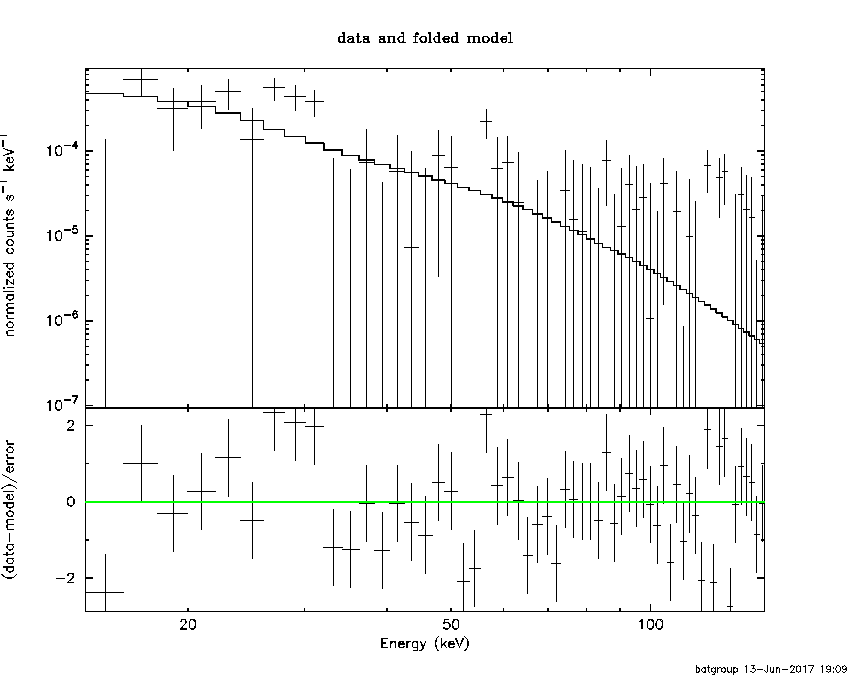
Spectral model in power-law:
------------------------------------------------------------
Parameters  : value       lower 90%   higher 90%
Photon index: 2.64755     ( -0.609242   0.734699 )
Norm@50keV  : 2.72202E-04    ( -0.000141529   0.000156033 )
------------------------------------------------------------
#Fit statistic : Chi-Squared =          82.14 using 59 PHA bins.
# Reduced chi-squared =          1.441 for     57 degrees of freedom
# Null hypothesis probability =   1.626808e-02

Photon flux (15-150 keV)    in 64 sec: 5.86780E-02 ( -0.0192675  0.0194073 ) ph/cm2/s
Energy fluence (15-150 keV)             : 1.81594e-07 ( -6.93907e-08  7.84384e-08 ) ergs/cm2
Cutoff power-law model
Spectral model in the cutoff power-law:
------------------------------------------------------------
Parameters  : value       lower 90%   higher 90%
Photon index: -9.96537     (     )
Epeak [keV] : 25.0048      (   )
Norm@50keV  : 5.21954E+05    (     )
------------------------------------------------------------
#Fit statistic : Chi-Squared =          71.75 using 59 PHA bins.
# Reduced chi-squared =          1.281 for     56 degrees of freedom
# Null hypothesis probability =   7.647009e-02

Photon flux (15-150 keV)    in 64 sec: 5.92780E-02 5.89613E-02 (    ) ph/cm2/s
Energy fluence (15-150 keV)             : 5.24253e-18 ( 0  0 ) ergs/cm2
Band function
Spectral model in the Band function:
------------------------------------------------------------
Parameters  : value       lower 90%   higher 90%
alpha       : 5.00000   ( -3.58553   -5 )
beta        : -6.40716    ( 6.40666   13.008 )
Epeak [keV] : 24.4522      ( -3.67641 4.01758 )
Norm@50keV   : 118.190    ( -33.5354   264.912 )
------------------------------------------------------------
#Fit statistic : Chi-Squared =          73.52 using 59 PHA bins.
# Reduced chi-squared =          1.337 for     55 degrees of freedom
# Null hypothesis probability =   4.830380e-02

Photon flux (15-150 keV)    in 64 sec:  (    ) ph/cm2/s
Energy fluence (15-150 keV)             : 0 ( 0  0 ) ergs/cm2
S(25-50 keV) vs. S(50-100 keV) plot

S(25-50 keV)  = 6.09e-08
S(50-100 keV) = 3.87e-08
T90 vs. Hardness ratio plot

T90                                   = 64 sec.
Hardness ratio (energy fluence ratio) = 0.635468
Color vs. Color plot

Count Ratio  (25-50 keV) / (15-25 keV) = 0.805759
Count Ratio (50-100 keV) / (15-25 keV) = 0.149357
Mask shadow pattern

IMX = -1.450755282596851E-01, IMY = 1.863643768045014E-02
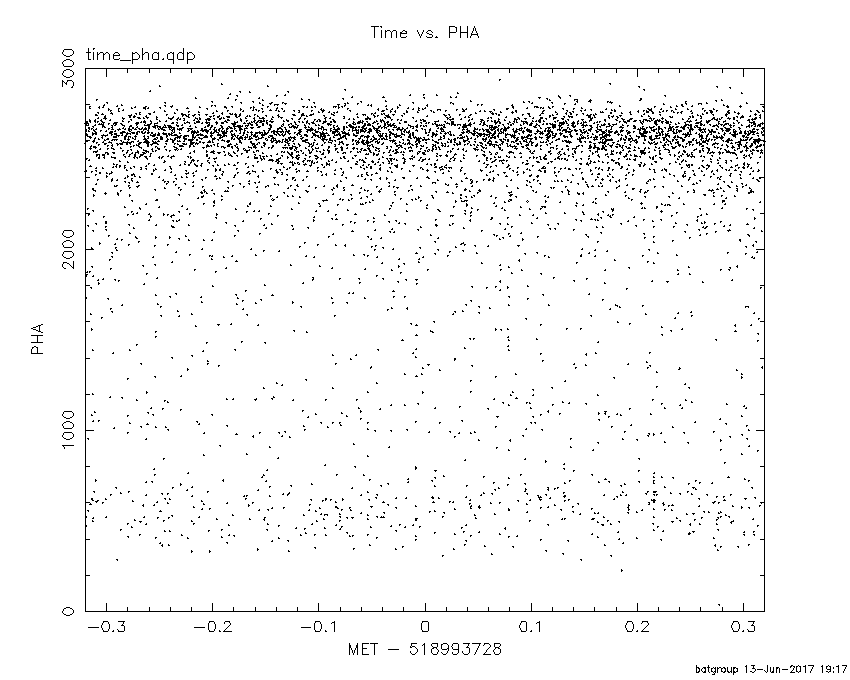
TIME vs. PHA plot around the trigger time
TIME vs. DetID plot around the trigger time

100 us light curve (15-350 keV)

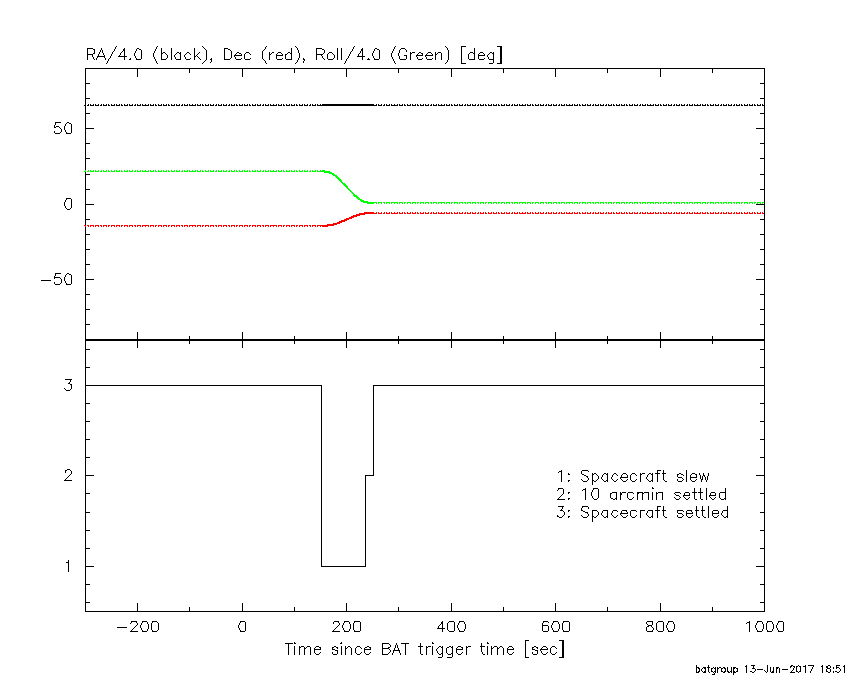
Spacecraft aspect plot
Bright source in the pre-burst/pre-slew/post-slew images
Pre-burst image of 15-350 keV band
Time interval of the image:
Pre-slew background subtracted image of 15-350 keV band
Time interval of the image:
0.000000 64.000000

# RAcent  DECcent POSerr Theta    Phi  PeakCts   SNR AngSep     Name
#  [deg]    [deg]    ['] [deg]  [deg]                   [']
244.9772 -15.6480    0.4  16.6   86.4   4.2112  31.1    0.5	Sco X-1
254.3393  35.3363   11.7  50.1  175.2   0.3433   1.0    5.8	Her X-1
255.9941 -37.8340    0.7  24.2   15.2   1.9328  15.9    0.7	4U 1700-377
256.6156 -36.5727    0.0  22.8   14.7  -0.0269  -0.2   12.5	GX 349+2
263.1594 -24.6342    3.6  10.4   -2.1   0.3860   3.2   10.6	GX 1+4
264.9226 -44.4293    5.8  30.3   -0.7   0.2791   2.0    7.8	4U 1735-44
268.4531  -1.3846    5.6  14.4 -149.9  -0.2399  -2.0    6.5	SW J1753.5-0127
270.2347 -25.1423    4.6  13.3  -30.6   0.3022   2.5    4.6	GX 5-1
270.1399 -25.7524    4.6  13.8  -28.8   0.3183   2.7    8.8	GRS 1758-258
274.0598 -14.1784   10.6  11.6  -85.6  -0.1439  -1.1    9.1	GX 17+2
275.8628 -30.2271    5.4  20.4  -32.9   0.2879   2.2    9.0	H1820-303
284.9283 -24.7991    4.8  23.9  -57.0   0.3459   2.4    9.4	HT1900.1-2455
288.9677  10.8068    0.0  36.6 -128.4   0.2453   1.1   13.0	GRS 1915+105
262.9869 -33.8371   84.9  19.6    1.1   0.0166   0.1    0.2	GX 354-0
221.3906 -15.8333    2.1  39.2   85.7   2.3423   5.4 ------	UNKNOWN
259.8994 -25.0547    1.3  11.0   13.7   1.0548   9.1 ------	UNKNOWN
276.5783 -71.9235    2.6  58.3   -1.9   3.1661   4.5 ------	UNKNOWN
263.3587  36.8453    2.1  51.1 -175.3   1.7136   5.5 ------	UNKNOWN
271.6495  24.5399    1.9  39.9 -163.0   1.0992   6.0 ------	UNKNOWN
293.3560  29.5424    3.2  53.2 -142.3   2.6752   3.6 ------	UNKNOWN
Post-slew image of 15-350 keV band
Time interval of the image:
235.300600 963.089800

# RAcent  DECcent POSerr Theta    Phi  PeakCts   SNR AngSep     Name
#  [deg]    [deg]    ['] [deg]  [deg]                   [']
244.9823 -15.6426    0.2  20.0  145.5  46.6115  57.9    0.2	Sco X-1
255.9878 -37.8899    1.6  32.5   96.0  10.9687   7.4    2.7	4U 1700-377
256.5297 -36.2817   24.4  30.8   95.8  -0.6561  -0.5    9.6	GX 349+2
263.0797 -24.7786    2.0  18.8   85.1   5.1510   5.9    4.3	GX 1+4
264.6701 -44.5967   70.2  38.7   83.8   0.4815   0.2    9.3	4U 1735-44
268.2098  -1.5916    0.0   7.0  -42.7  -0.6501  -0.8   12.6	SW J1753.5-0127
270.2082 -25.1692    2.5  20.5   66.4   3.5986   4.6    6.8	GX 5-1
270.1353 -25.8901    0.0  21.1   67.3   1.8089   2.2   12.6	GRS 1758-258
273.9539 -14.0289    3.6  13.6   33.1   2.5939   3.2    3.1	GX 17+2
275.7606 -30.4545   10.1  27.4   61.1   1.2429   1.1   10.0	H1820-303
285.1931 -24.9340  481.3  28.6   39.8  -0.0219  -0.0    8.6	HT1900.1-2455
288.8130  11.0819   58.5  31.0  -37.3   0.2299   0.2    8.2	GRS 1915+105
263.0678 -33.9297    5.0  28.0   85.5   2.7328   2.3    6.9	GX 354-0
259.9082 -25.0241    0.9  19.3   93.9  11.3093  12.5 ------	UNKNOWN
302.5061 -20.0337    3.1  41.0   19.8   4.7029   3.7 ------	UNKNOWN
306.2228   7.9336    2.6  45.5  -21.3   5.9117   4.5 ------	UNKNOWN
286.4434  31.2261    3.4  43.5  -64.1  15.9786   3.4 ------	UNKNOWN
259.2393  35.0252    3.9  41.1  -98.4  15.4233   3.0 ------	UNKNOWN
239.6508  33.7752    3.5  45.4 -121.3  16.3145   3.3 ------	UNKNOWN
Plot creation:
Tue Jun 13 19:18:39 EDT 2017