Special notes of this burst
Image
Pre-slew 15.0-350.0 keV image (Event data)
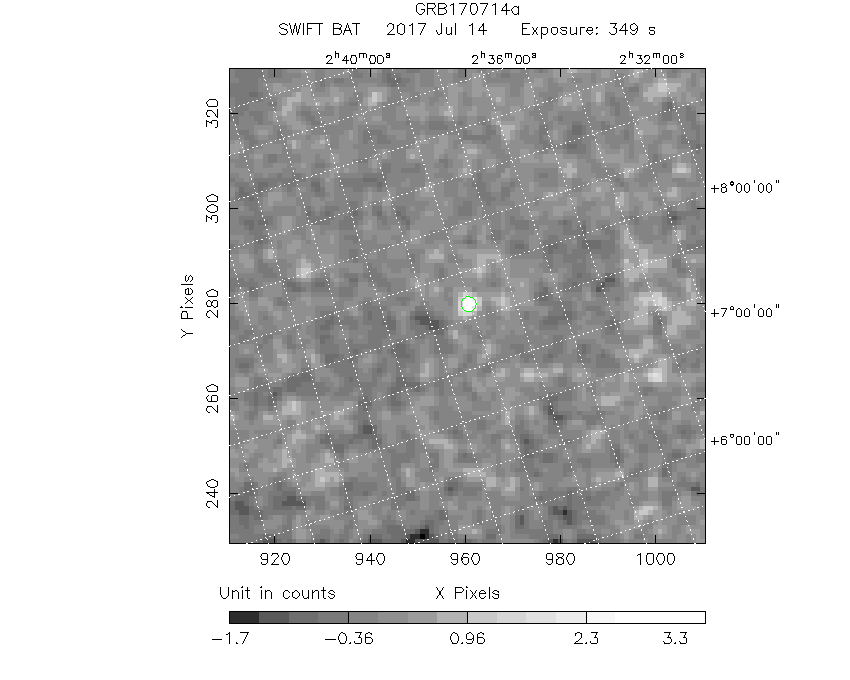
#   RAcent    DECcent   POSerr    Theta     Phi              Peak Cts       SNR   Name
   34.3208     1.9621   0.0193    24.0888   112.4001         3.5461153      9.983 TRIG_00762535

Foreground time interval of the image:
-11.899 336.701 (delta_t = 348.600 [sec])
Background time interval of the image:
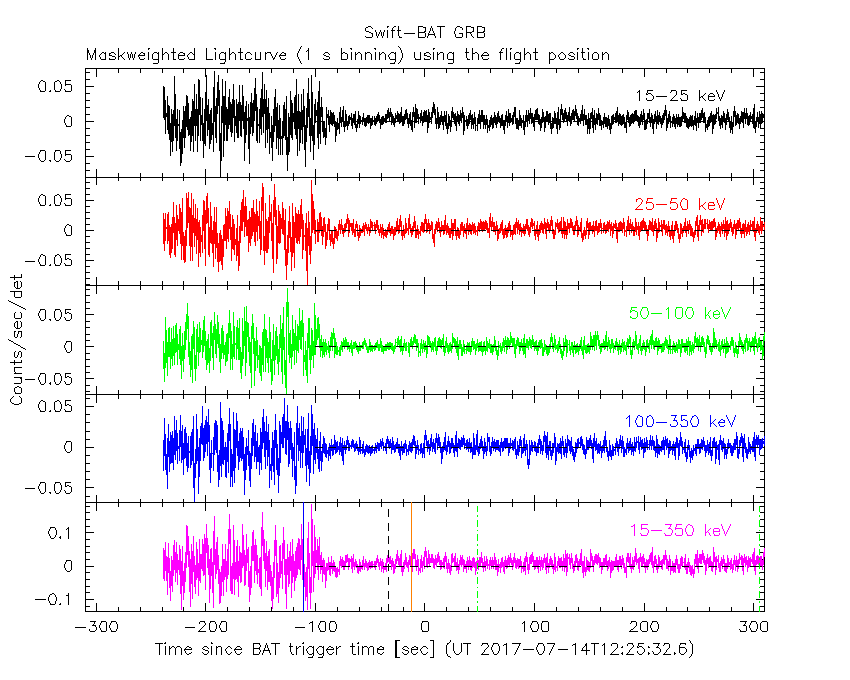
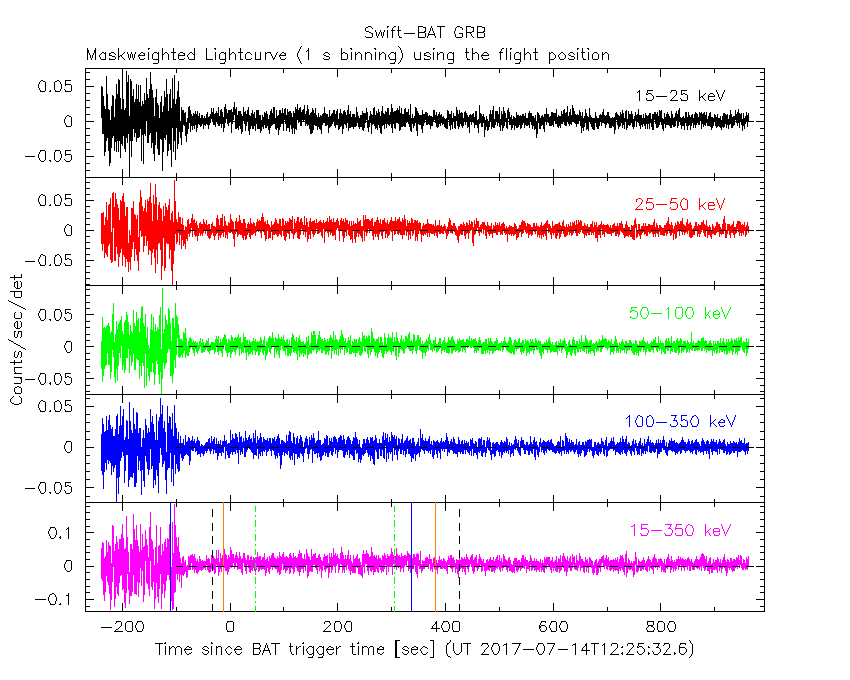
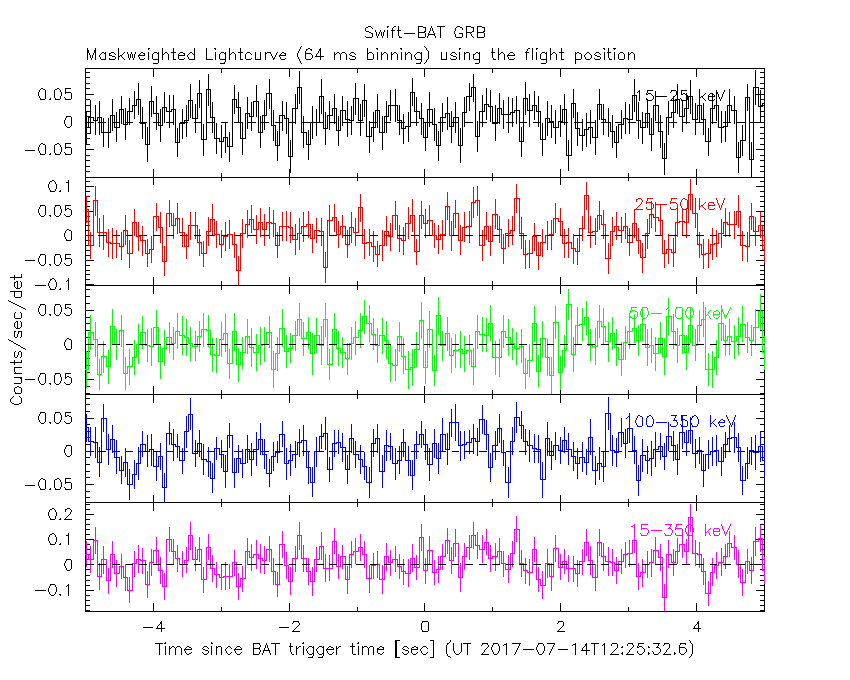
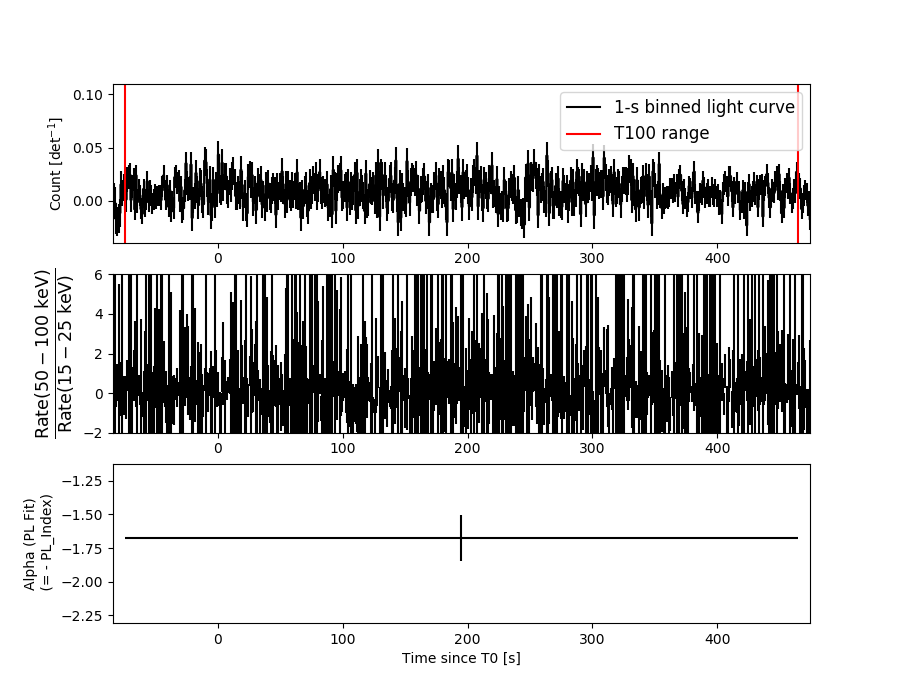
Lightcurves
Notes:
- 1) The mask-weighted light curves are using the flight position.
- 2) Multiple plots of different time binning/intervals are shown to cover all scenarios of short/long GRBs, rate/image triggers, and real/false positives.
- 3) For all the mask-weighted lightcurves, the y-axis units are counts/sec/det where a det is 0.4 x 0.4 = 0.16 sq cm.
- 4) The verticle lines correspond to following: green dotted lines are T50 interval, black dotted lines are T90 interval, blue solid line(s) is a spacecraft slew start time, and orange solid line(s) is a spacecraft slew end time.
- 5) Time of each bin is in the middle of the bin.
1 s binning
From T0-310 s to T0+310 s
From T100_start - 20 s to T100_end + 30 s

Full time interval
64 ms binning
Full time interval

From T100_start to T100_end

From T0-5 sec to T0+5 sec
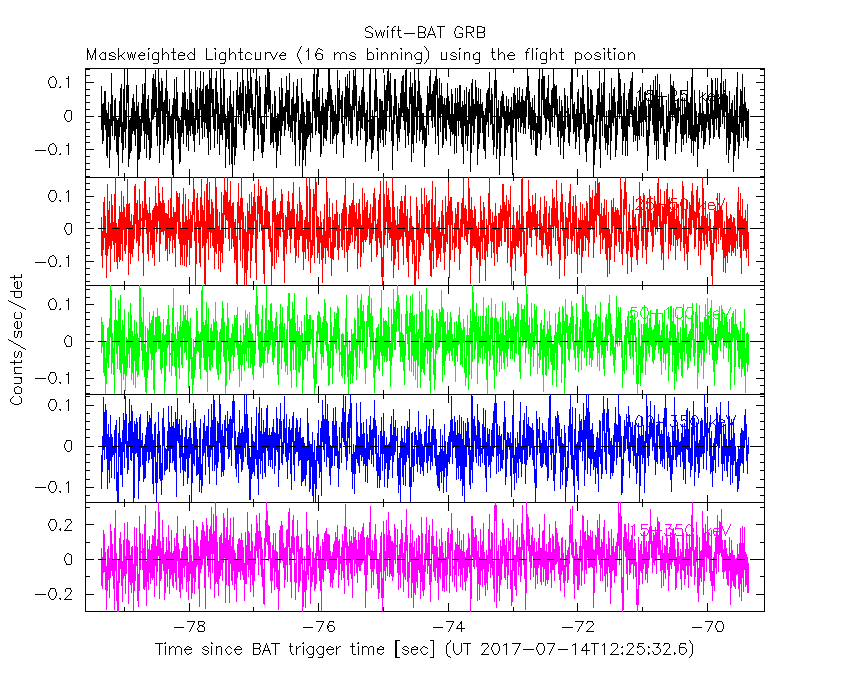
16 ms binning
From T100_start-5 s to T100_start+5 s
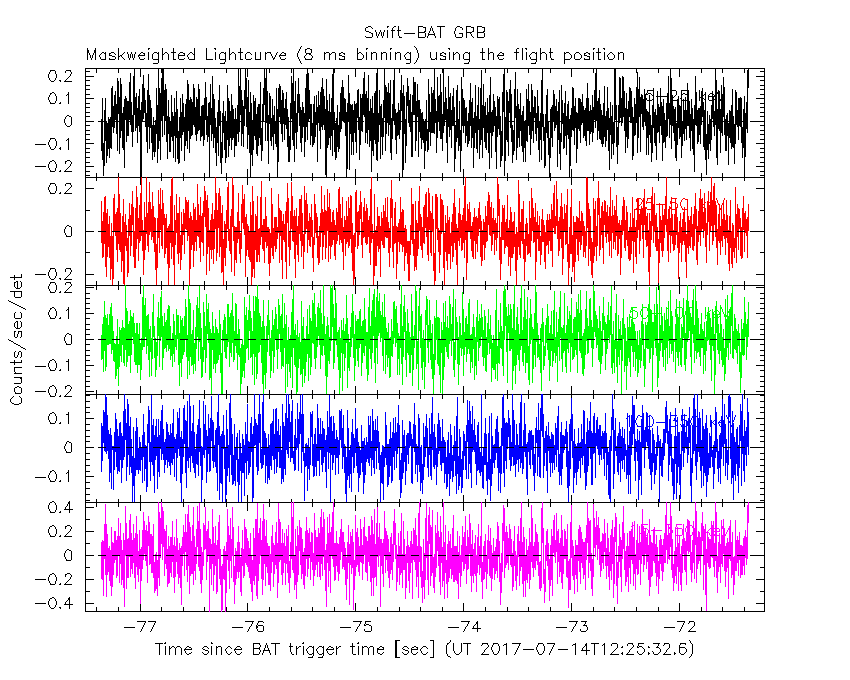
8 ms binning
From T100_start-3 s to T100_start+3 s
2 ms binning
From T100_start-1 s to T100_start+1 s

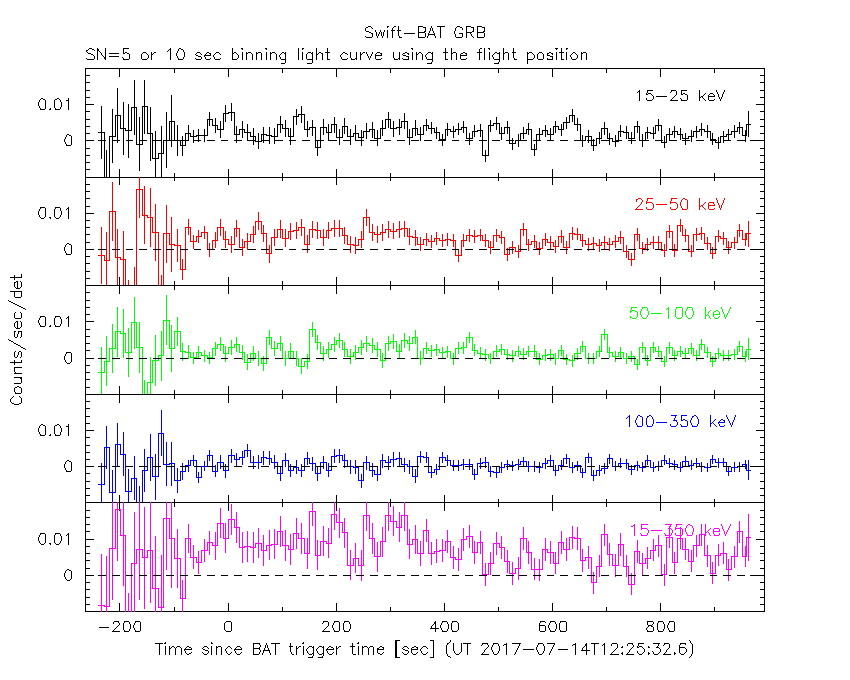
SN=5 or 10 sec. binning (whichever binning is satisfied first)
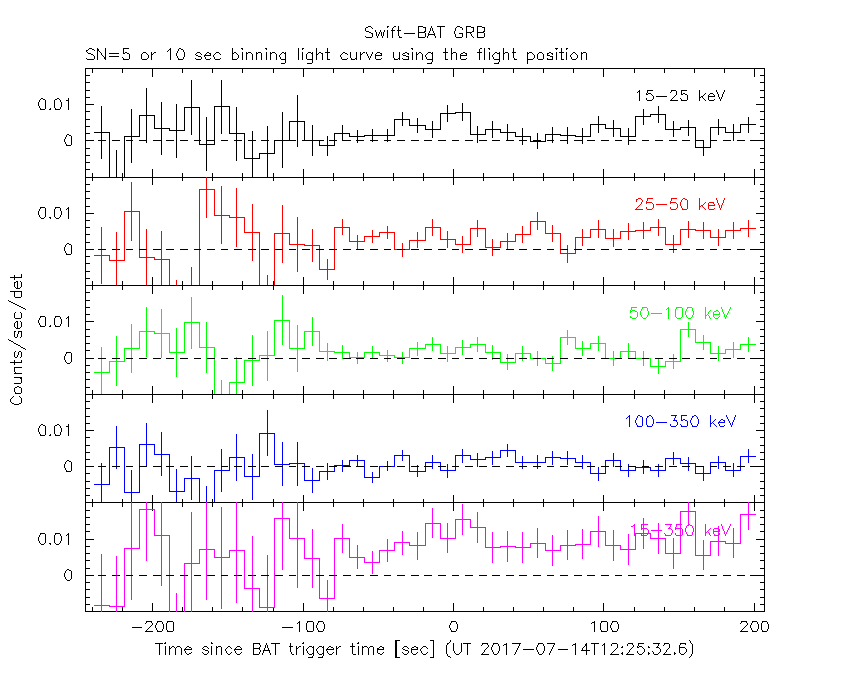
SN=5 or 10 sec. binning (T < 200 sec)
Quad-rate summed light curves (from T0-300s to T0+1000s)

Spectral Evolution
Spectra
Notes:
- 1) The fitting includes the systematic errors.
- 2) When the burst includes telescope slew time periods, the fitting uses an average response file made from multiple 5-s response files through out the slew time plus single time preiod for the non-slew times, and weighted by the total counts in the corresponding time period using addrmf. An average response file is needed becuase a spectral fit using the pre-slew DRM will introduce some errors in both a spectral shape and a normalization if the PHA file contains a lot of the slew/post-slew time interval.
- 3) For fits to more complicated models (e.g. a power-law over a cutoff power-law), the BAT team has decided to require a chi-square improvement of more than 6 for each extra dof.
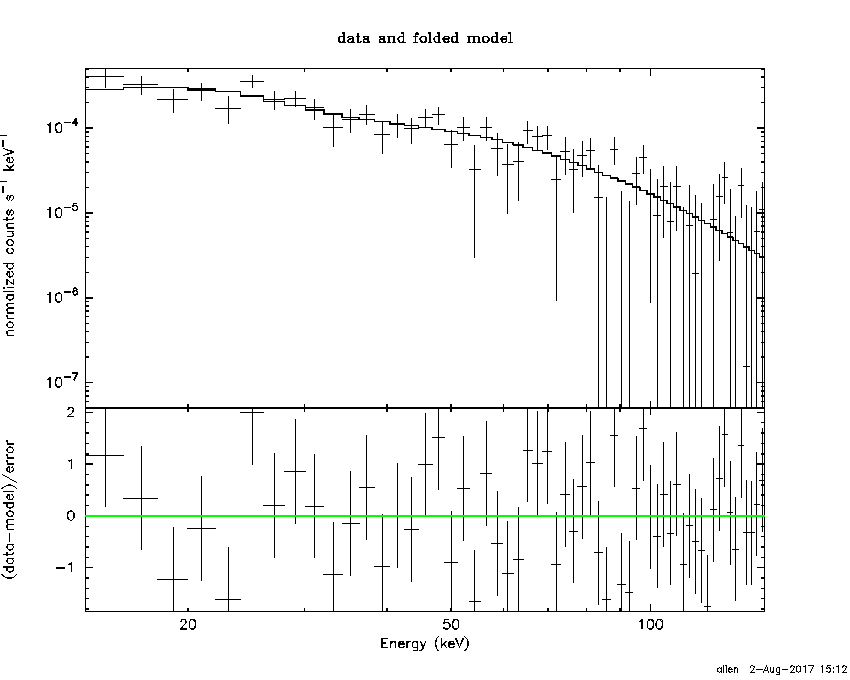
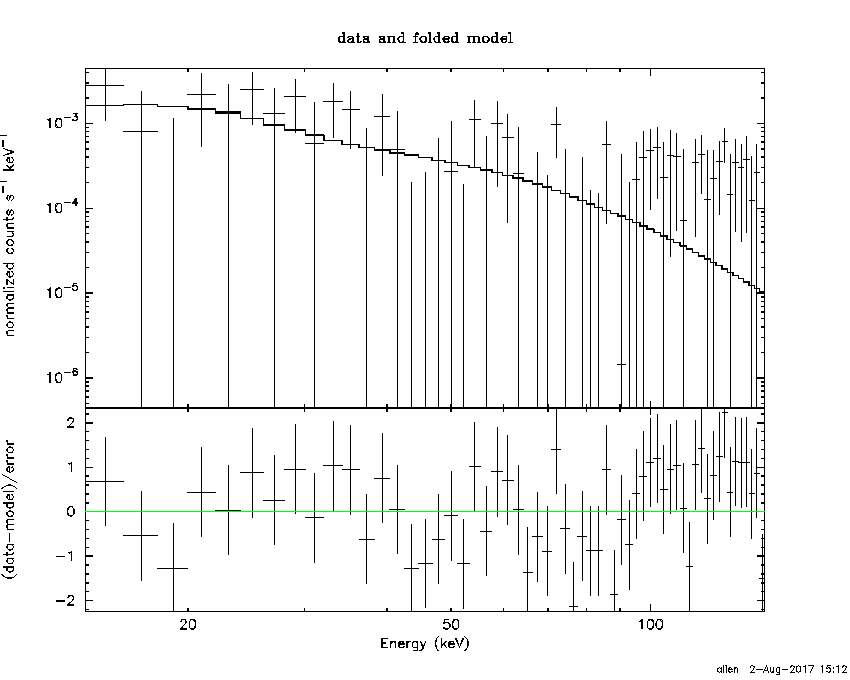
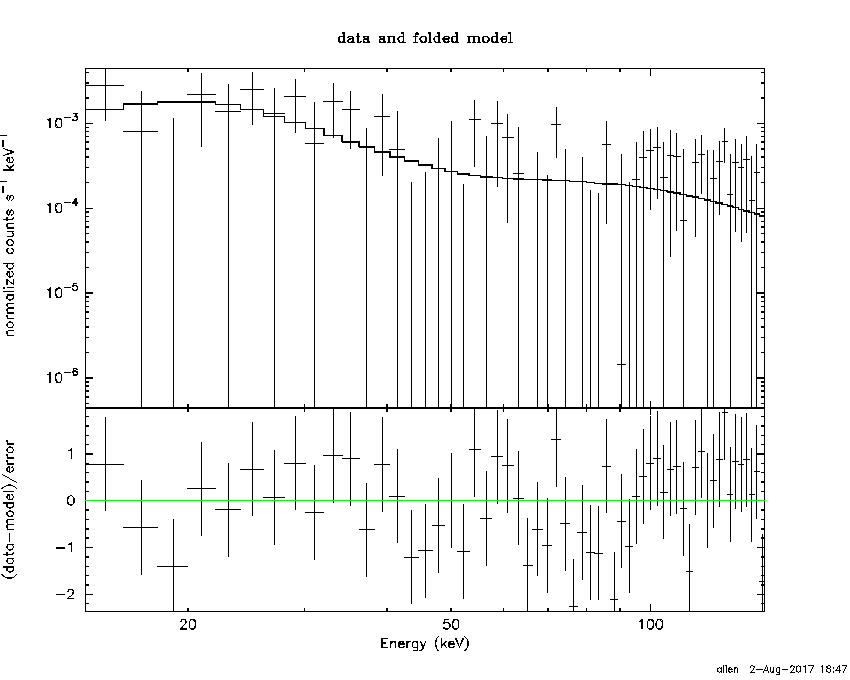
Time averaged spectrum fit using the average DRM
Power-law model

Time interval is from  -74.360 sec. to  464.232 sec.

Spectral model in power-law:
------------------------------------------------------------
Parameters  : value       lower 90%   higher 90%
Photon index: 1.67345     ( -0.167627   0.172309 )
Norm@50keV  : 5.73229E-04    ( -5.81432e-05   5.72335e-05 )
------------------------------------------------------------
#Fit statistic : Chi-Squared =          54.20 using 59 PHA bins.
# Reduced chi-squared =         0.9509 for     57 degrees of freedom
# Null hypothesis probability =   5.806704e-01

Photon flux (15-150 keV)    in 538.6 sec: 7.54419E-02 ( -0.0068863  0.0068932 ) ph/cm2/s
Energy fluence (15-150 keV)             : 2.86534e-06 ( -3.06777e-07  3.11945e-07 ) ergs/cm2
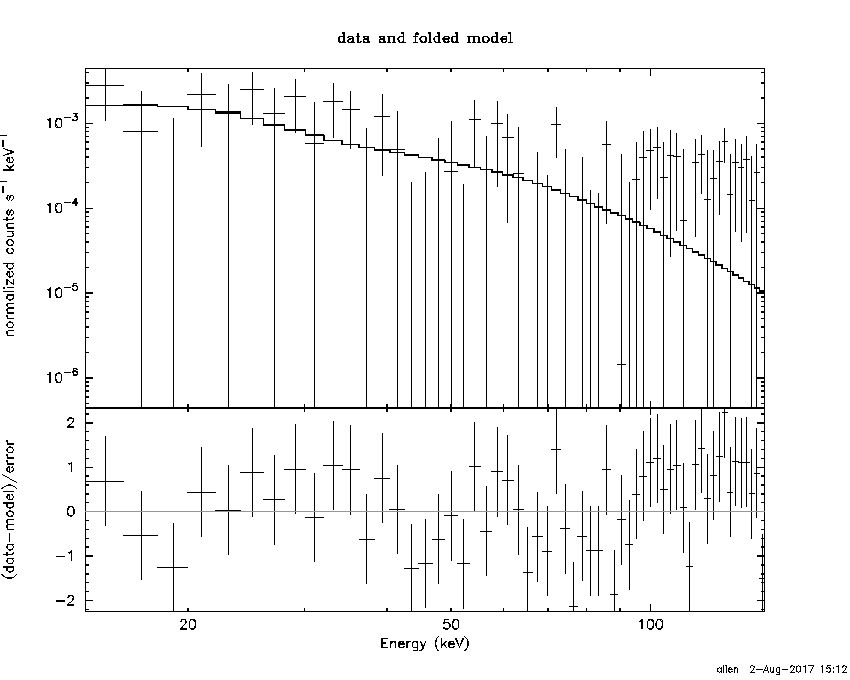
Cutoff power-law model
Time interval is from  -74.360 sec. to  464.232 sec.
Spectral model in the cutoff power-law:
------------------------------------------------------------
Parameters  : value       lower 90%   higher 90%
Photon index: 1.49455     ( -0.719334   0.34264 )
Epeak [keV] : 132.203      ( -107.404 -132.402 )
Norm@50keV  : 7.13889E-04    ( -0.000306589   0.000985055 )
------------------------------------------------------------
#Fit statistic : Chi-Squared =          53.98 using 59 PHA bins.
# Reduced chi-squared =         0.9640 for     56 degrees of freedom
# Null hypothesis probability =   5.516383e-01

Photon flux (15-150 keV)    in 538.6 sec: 7.47746E-02 ( -0.0073027  0.0072512 ) ph/cm2/s
Energy fluence (15-150 keV)             : 2.81499e-06 ( -3.55037e-07  3.47846e-07 ) ergs/cm2
Band function

Time interval is from  -74.360 sec. to  464.232 sec.


Spectral model in the Band function:
------------------------------------------------------------
Parameters  : value       lower 90%   higher 90%
alpha       :    (     )
beta        :     (     )
Epeak [keV] :       (   )
Norm@50keV   :     (     )
------------------------------------------------------------

Photon flux (15-150 keV)    in  sec:  (    ) ph/cm2/s
Energy fluence (15-150 keV)             : 0 ( 0  0 ) ergs/cm2
Single BB
Spectral model blackbody:
------------------------------------------------------------
Parameters  : value    Lower 90%  Upper 90%
kT [keV]    : 12.7106  (-1.4604  1.67975)
R^2/D10^2   : 1.46572E-02  (-0.00528677   0.0081549)
(R is the radius in km and D10 is the distance to the source in units of 10 kpc)
------------------------------------------------------------
#Fit statistic : Chi-Squared =          82.49 using 59 PHA bins.
# Reduced chi-squared =          1.447 for     57 degrees of freedom
# Null hypothesis probability =   1.526917e-02

Energy  Fluence     90% Error
[keV]   [erg/cm2]   [erg/cm2]
15- 25  2.705e-07   4.643e-08
25- 50  9.090e-07   1.142e-07
50-150  9.161e-07   1.917e-07
15-150  2.096e-06   2.542e-07
Thermal bremsstrahlung (OTTB)

Spectral model: thermal bremsstrahlung
------------------------------------------------------------
Parameters  : value         Lower 90%    Upper 90%
kT [keV]    : 144.069       (-51.0994      -142.981)
Norm        : 0.311100       (-0.031871     0.040511)
------------------------------------------------------------
#Fit statistic : Chi-Squared =          54.29 using 59 PHA bins.
# Reduced chi-squared =         0.9525 for     57 degrees of freedom
# Null hypothesis probability =   5.772377e-01

Energy  Fluence     90% Error
[keV]   [erg/cm2]   [erg/cm2]
15- 25  4.318e-07   6.113e-08
25- 50  7.956e-07   1.363e-07
50-150  1.544e-06   7.881e-07
15-150  2.771e-06   9.428e-07
Double BB
Spectral model: bbodyrad<1> + bbodyrad<2>
------------------------------------------------------------
Parameters  : value         Lower 90%    Upper 90%
kT1 [keV]   : 6.02569        (-1.98616      2.27047)
R1^2/D10^2  : 0.139698        (-0.0907635      0.52482)
kT2 [keV]   : 22.0972        (-5.40317      12.7327)
R2^2/D10^2  : 1.57836E-03    (-0.00126927   0.00312654)
------------------------------------------------------------
#Fit statistic : Chi-Squared =          55.67 using 59 PHA bins.
# Reduced chi-squared =          1.012 for     55 degrees of freedom
# Null hypothesis probability =   4.495762e-01

Energy  Fluence     90% Error
[keV]   [erg/cm2]   [erg/cm2]
15- 25  4.419e-07   2.083e-07
25- 50  7.741e-07   2.852e-07
50-150  1.517e-06   8.228e-07
15-150  2.733e-06   1.220e-06
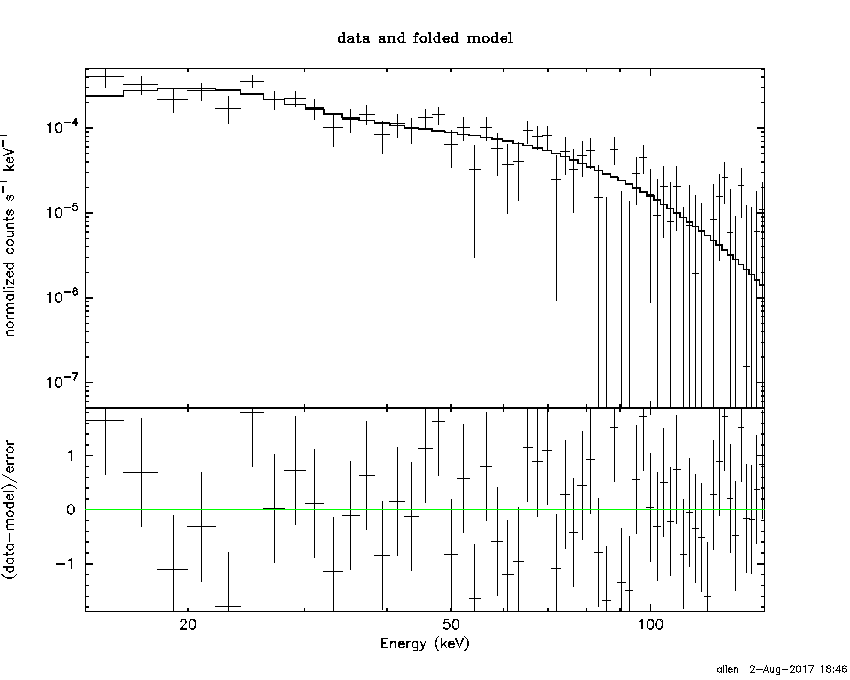
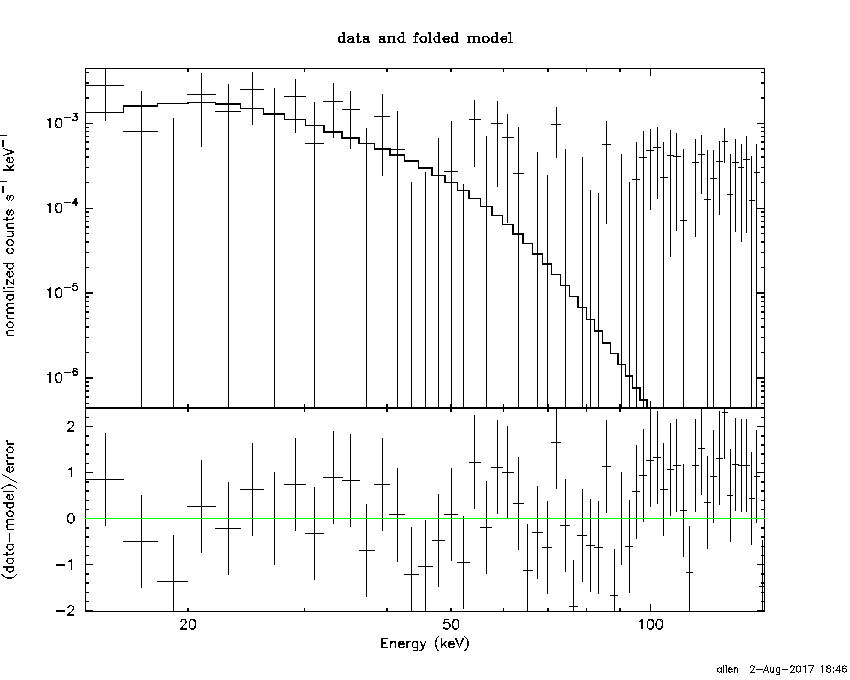
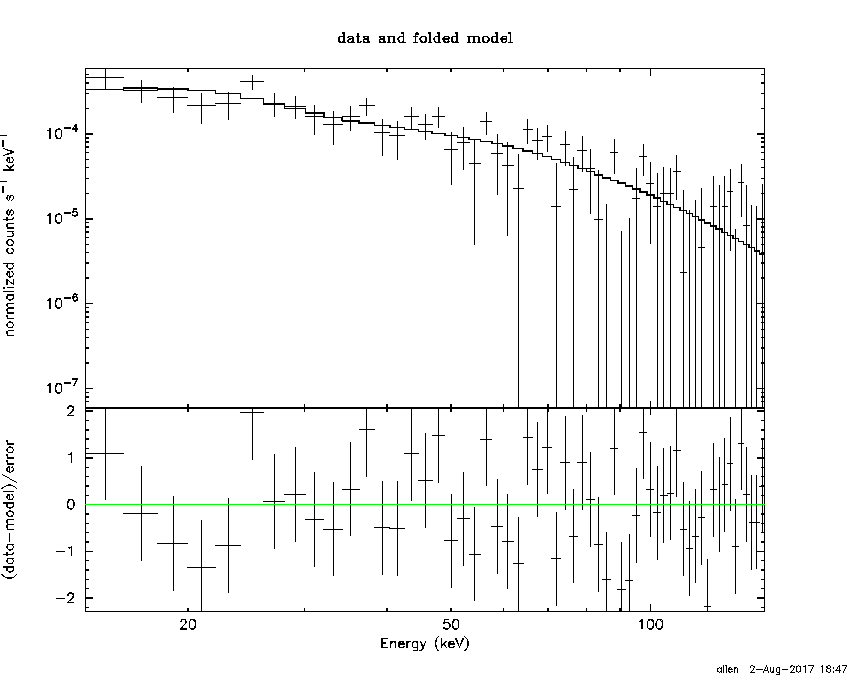
Peak spectrum fit
Power-law model
Time interval is from    0.220 sec. to    1.220 sec.

Spectral model in power-law:
------------------------------------------------------------
Parameters  : value       lower 90%   higher 90%
Photon index: 1.96655     ( -1.46268   1.46531 )
Norm@50keV  : 2.28019E-03    ( -0.00227899   0.00151047 )
------------------------------------------------------------
#Fit statistic : Chi-Squared =          55.77 using 59 PHA bins.
# Reduced chi-squared =         0.9785 for     57 degrees of freedom
# Null hypothesis probability =   5.211329e-01

Photon flux (15-150 keV)    in 1 sec: 0.336889 ( -0.167646  0.167631 ) ph/cm2/s
Energy fluence (15-150 keV)             : 2.09889e-08 ( -1.28744e-08  1.53825e-08 ) ergs/cm2
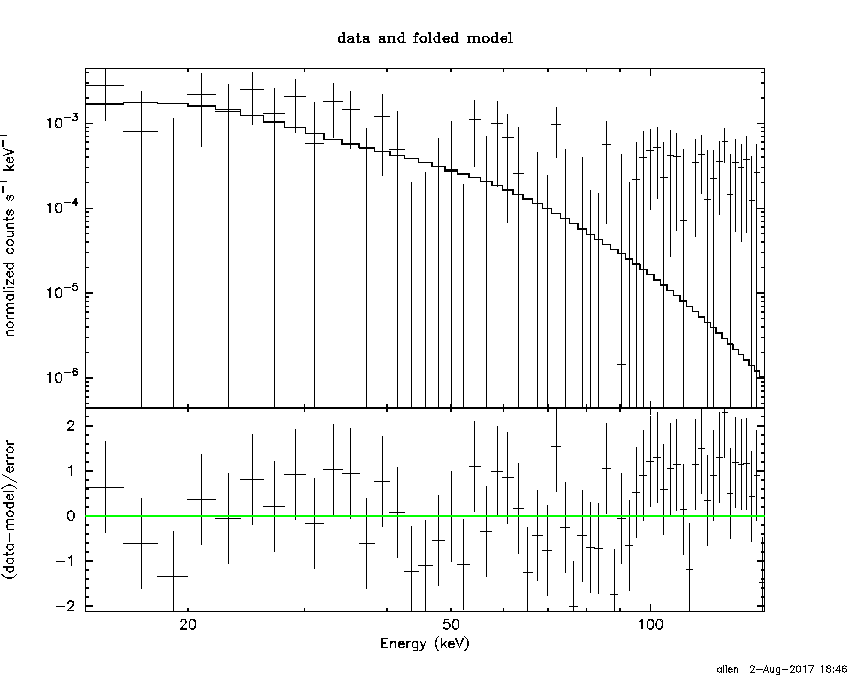
Cutoff power-law model
Time interval is from    0.220 sec. to    1.220 sec.
Spectral model in the cutoff power-law:
------------------------------------------------------------
Parameters  : value       lower 90%   higher 90%
Photon index: 1.95594     (     )
Epeak [keV] : 9999.36      (   )
Norm@50keV  : 2.29139E-03    (     )
------------------------------------------------------------
#Fit statistic : Chi-Squared =          55.78 using 59 PHA bins.
# Reduced chi-squared =         0.9960 for     56 degrees of freedom
# Null hypothesis probability =   4.833302e-01

Photon flux (15-150 keV)    in 1 sec: 0.250353 (    ) ph/cm2/s
Energy fluence (15-150 keV)             : 1.69348e-08 ( -1.68792e-08  1.48478e-08 ) ergs/cm2
Band function

Time interval is from    0.220 sec. to    1.220 sec.


Spectral model in the Band function:
------------------------------------------------------------
Parameters  : value       lower 90%   higher 90%
alpha       :    (     )
beta        :     (     )
Epeak [keV] :       (   )
Norm@50keV   :     (     )
------------------------------------------------------------

Photon flux (15-150 keV)    in  sec:  (    ) ph/cm2/s
Energy fluence (15-150 keV)             : 0 ( 0  0 ) ergs/cm2
Single BB
Spectral model blackbody:
------------------------------------------------------------
Parameters  : value    Lower 90%  Upper 90%
kT [keV]    : 7.22894  (-2.6124  4.06953)
R^2/D10^2   : 0.578242  (-0.578729   2.92696)
(R is the radius in km and D10 is the distance to the source in units of 10 kpc)
------------------------------------------------------------
#Fit statistic : Chi-Squared =          55.52 using 59 PHA bins.
# Reduced chi-squared =         0.9741 for     57 degrees of freedom
# Null hypothesis probability =   5.306627e-01

Energy  Fluence     90% Error
[keV]   [erg/cm2]   [erg/cm2]
15- 25  5.013e-09   3.253e-09
25- 50  7.302e-09   5.260e-09
50-150  1.357e-09   1.220e-09
15-150  1.367e-08   9.700e-09
Thermal bremsstrahlung (OTTB)
Spectral model: thermal bremsstrahlung
------------------------------------------------------------
Parameters  : value         Lower 90%    Upper 90%
kT [keV]    : 38.3967       (-38.4425      -38.4425)
Norm        : 2.16944       (-2.1672     4.36691)
------------------------------------------------------------
#Fit statistic : Chi-Squared =          56.30 using 59 PHA bins.
# Reduced chi-squared =         0.9876 for     57 degrees of freedom
# Null hypothesis probability =   5.014634e-01

Energy  Fluence     90% Error
[keV]   [erg/cm2]   [erg/cm2]
15- 25  4.911e-09   3.203e-09
25- 50  6.346e-09   4.336e-09
50-150  4.692e-09   4.547e-09
15-150  1.595e-08   1.175e-08
Double BB
------------------------------------------------------------
Parameters  : value         Lower 90%    Upper 90%
kT1 [keV]   : 200.000        (-200      -200)
R1^2/D10^2  : 8.14351E-05        (-5.56082e-05      5.46794e-05)
kT2 [keV]   : 6.32038        (-2.39534      3.34405)
R2^2/D10^2  : 0.889609    (-0.756156   5.57541)
------------------------------------------------------------
#Fit statistic : Chi-Squared =          55.52 using 59 PHA bins.
#Fit statistic : Chi-Squared =          49.75 using 59 PHA bins.
# Reduced chi-squared =          1.010 for     55 degrees of freedom
# Reduced chi-squared =         0.9046 for     55 degrees of freedom
# Null hypothesis probability =   4.549107e-01
# Null hypothesis probability =   6.747520e-01

Energy  Fluence     90% Error
[keV]   [erg/cm2]   [erg/cm2]
15- 25  5.013e-09   2.928e-01
25- 50  7.302e-09   2.699e+00
50-150  1.357e-09   6.065e+01
15-150  1.367e-08   6.955e+01
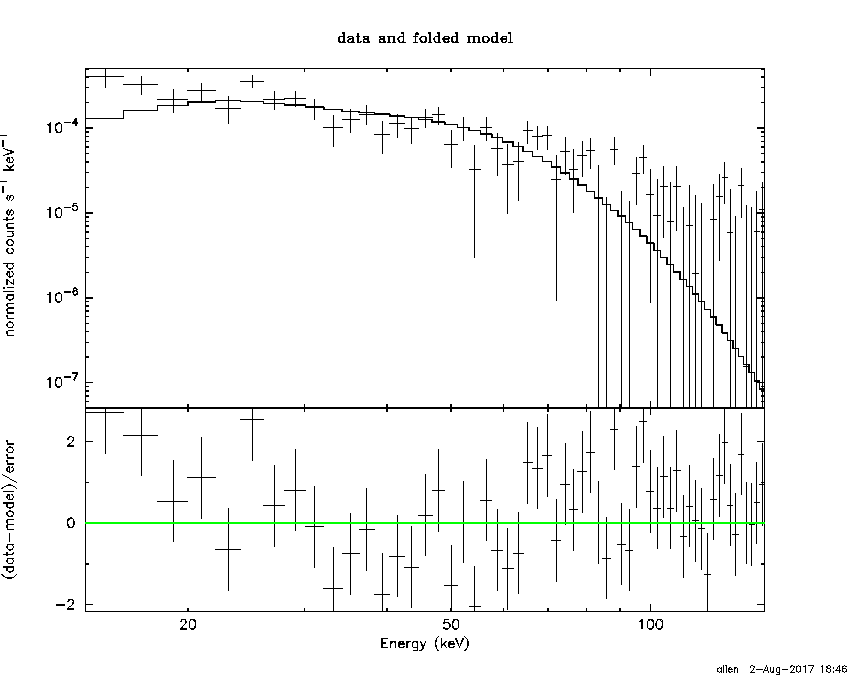
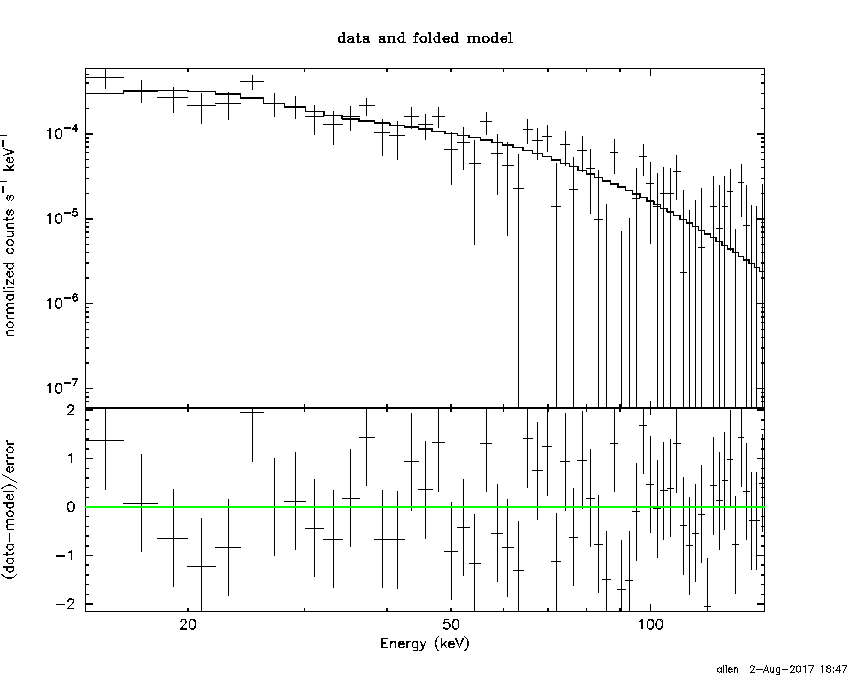
Pre-slew spectrum (Pre-slew PHA with pre-slew DRM)
Power-law model
Spectral model in power-law:
------------------------------------------------------------
Parameters  : value       lower 90%   higher 90%
Photon index: 1.70218     ( -0.197964   0.205422 )
Norm@50keV  : 6.24663E-04    ( -7.78085e-05   7.63359e-05 )
------------------------------------------------------------
#Fit statistic : Chi-Squared =          54.60 using 59 PHA bins.
# Reduced chi-squared =         0.9579 for     57 degrees of freedom
# Null hypothesis probability =   5.655944e-01

Photon flux (15-150 keV)    in 348.6 sec: 8.30254E-02 ( -0.00910845  0.00911317 ) ph/cm2/s
Energy fluence (15-150 keV)             : 2.01585e-06 ( -2.61851e-07  2.66872e-07 ) ergs/cm2
Cutoff power-law model
Spectral model in the cutoff power-law:
------------------------------------------------------------
Parameters  : value       lower 90%   higher 90%
Photon index: 1.26684     ( -0.970525   0.605324 )
Epeak [keV] : 77.0118      ( -56.0416 -77.0118 )
Norm@50keV  : 1.07496E-03    ( -0.000343986   0.00250327 )
------------------------------------------------------------
#Fit statistic : Chi-Squared =          53.79 using 59 PHA bins.
# Reduced chi-squared =         0.9605 for     56 degrees of freedom
# Null hypothesis probability =   5.591152e-01

Photon flux (15-150 keV)    in 348.6 sec: 8.13810E-02 ( -0.0096378  0.0096003 ) ph/cm2/s
Energy fluence (15-150 keV)             : 1.93164e-06 ( -3.01595e-07  3.08257e-07 ) ergs/cm2
Band function

Spectral model in the Band function:
------------------------------------------------------------
Parameters  : value       lower 90%   higher 90%
alpha       :    (     )
beta        :     (     )
Epeak [keV] :       (   )
Norm@50keV   :     (     )
------------------------------------------------------------

Photon flux (15-150 keV)    in  sec:  (    ) ph/cm2/s
Energy fluence (15-150 keV)             : 0 ( 0  0 ) ergs/cm2
S(25-50 keV) vs. S(50-100 keV) plot

S(25-50 keV)  = 7.65e-07
S(50-100 keV) = 9.64e-07
T90 vs. Hardness ratio plot
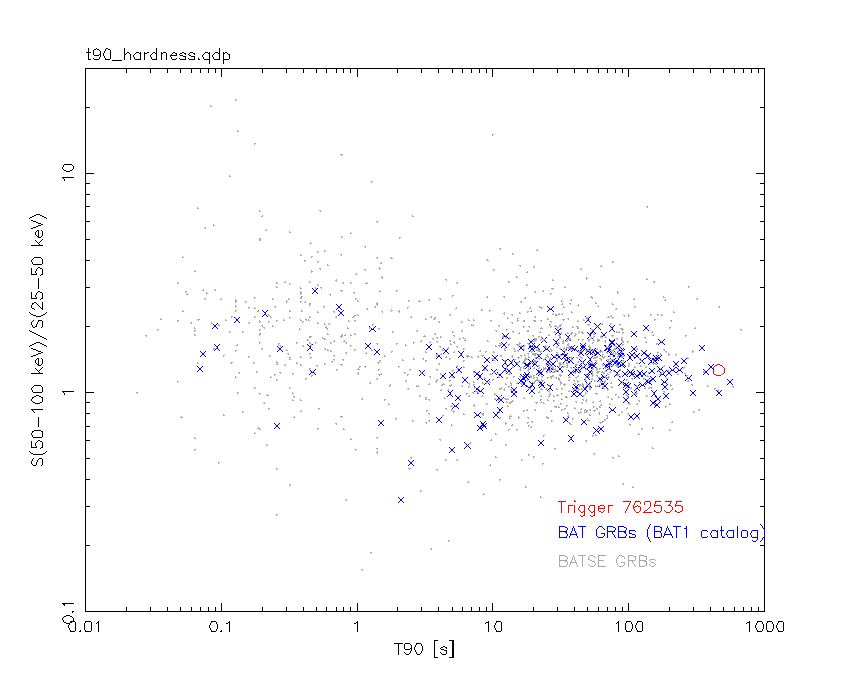
T90                                   = 459.216000020504 sec.
Hardness ratio (energy fluence ratio) = 1.26013
Color vs. Color plot

Count Ratio  (25-50 keV) / (15-25 keV) = 1.27093
Count Ratio (50-100 keV) / (15-25 keV) = 0.78147
Mask shadow pattern
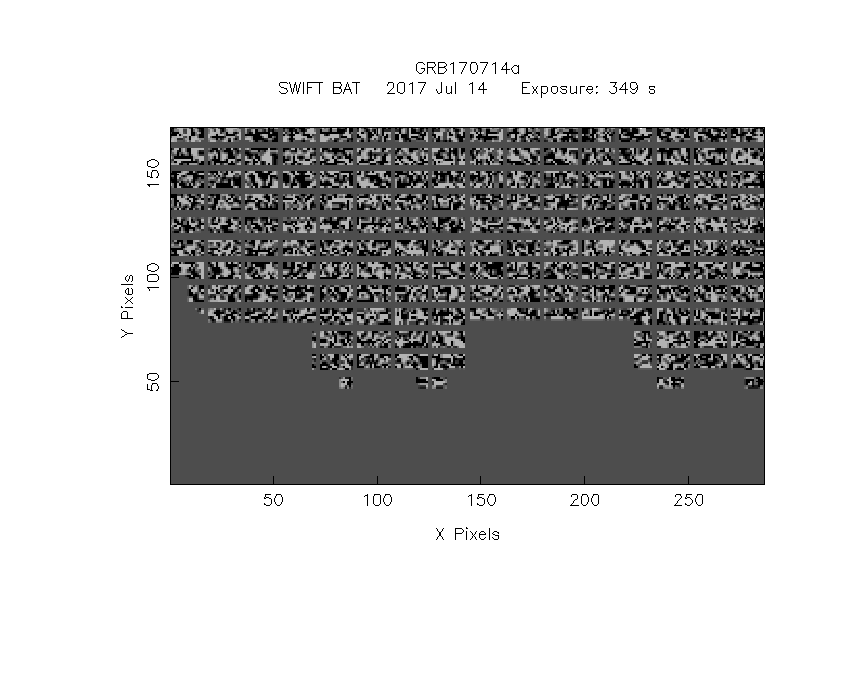
IMX = -1.703726376191623E-01, IMY = -4.133521449098388E-01
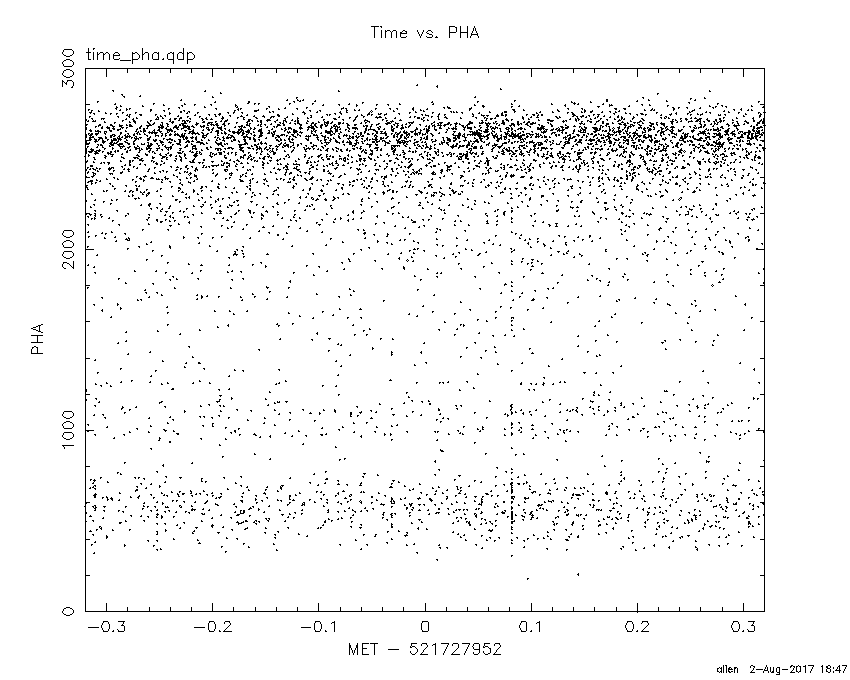
TIME vs. PHA plot around the trigger time
TIME vs. DetID plot around the trigger time
100 us light curve (15-350 keV)

Spacecraft aspect plot

Bright source in the pre-burst/pre-slew/post-slew images
Pre-burst image of 15-350 keV band
Time interval of the image:
Pre-slew background subtracted image of 15-350 keV band
Time interval of the image:
-11.899400 336.700600

# RAcent  DECcent POSerr Theta    Phi  PeakCts   SNR AngSep     Name
#  [deg]    [deg]    ['] [deg]  [deg]                   [']
 83.6275  22.0153    0.4  33.1 -115.8  14.2201  26.0    0.3	Crab
 22.6830   1.6110    3.5  35.7  110.3   2.2994   3.3 ------	UNKNOWN
 34.3208   1.9621    1.2  24.1  112.4   3.5460  10.0 ------	UNKNOWN
 28.5291  51.0376    2.8  56.9  175.7   7.8687   4.1 ------	UNKNOWN
 63.4137 -22.9184    2.2  23.4    5.8   1.4616   5.3 ------	UNKNOWN
 32.2354  52.5679    2.7  56.9  179.0   8.4796   4.3 ------	UNKNOWN
 86.8140 -53.2844    3.3  58.3   -2.0   6.3450   3.5 ------	UNKNOWN
 97.9820 -45.7051    2.3  57.5  -14.3   7.2418   5.0 ------	UNKNOWN
 89.7906  38.3120    2.6  48.0 -129.0   6.8270   4.4 ------	UNKNOWN
Post-slew image of 15-350 keV band
Time interval of the image:
382.100590 963.120400

# RAcent  DECcent POSerr Theta    Phi  PeakCts   SNR AngSep     Name
#  [deg]    [deg]    ['] [deg]  [deg]                   [']
358.6768   0.8028    3.2  35.7  110.4   3.4049   3.6   92.9	UNKNOWN
355.3696  23.0613    2.2  43.3  144.2   5.1609   5.1 ------	UNKNOWN
 34.3029   1.9818    1.2   0.0  116.1   3.4265   9.3 ------	UNKNOWN
 70.9902   2.7012    3.7  36.6  -70.1   2.9467   3.1 ------	UNKNOWN
Plot creation:
Wed Aug  2 18:48:06 EDT 2017