Estimated redshift from machine learning (Ukwatta et al. 2016) - may take a few minute to calcaulte
Image
Pre-slew 15.0-350.0 keV image (Event data)
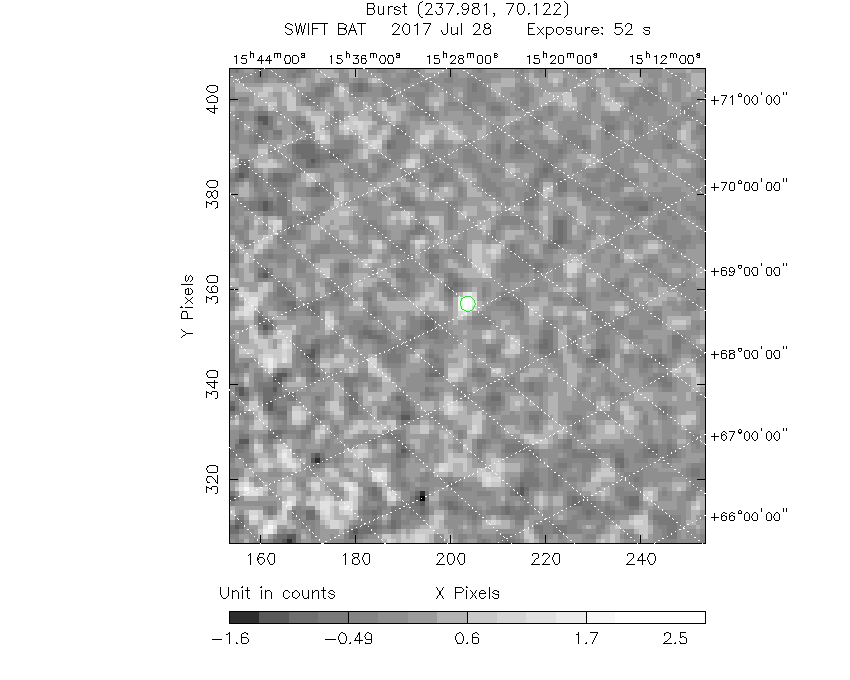
#   RAcent    DECcent   POSerr    Theta     Phi              Peak Cts       SNR   Name
  238.0188    70.1111   0.0213    55.2709    10.0366         3.1859843      9.038 TRIG_00765130

Foreground time interval of the image:
 -0.040  52.392 (delta_t =  52.432 [sec])
Background time interval of the image:
-239.880  -0.040 (delta_t = 239.840 [sec])
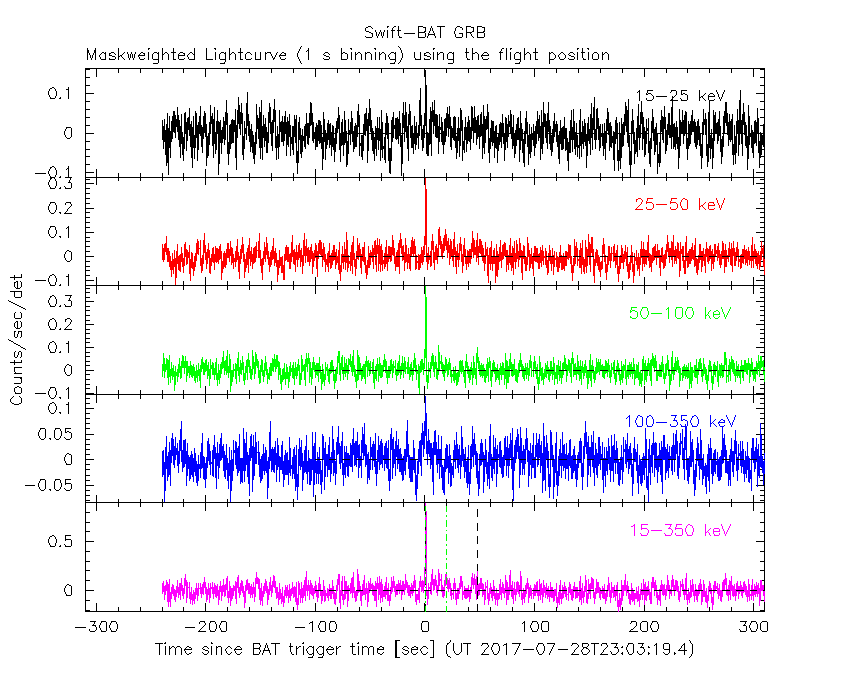
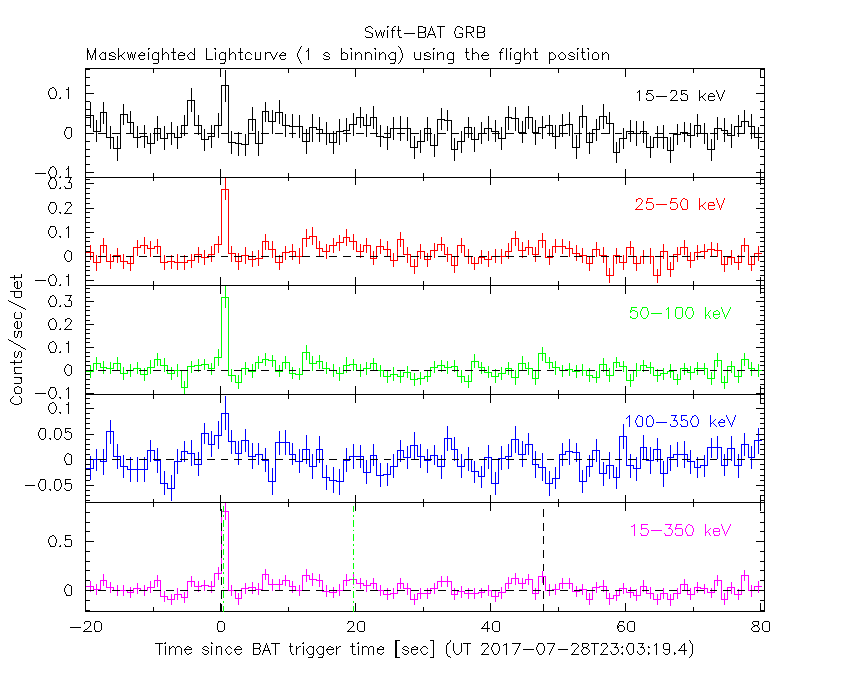
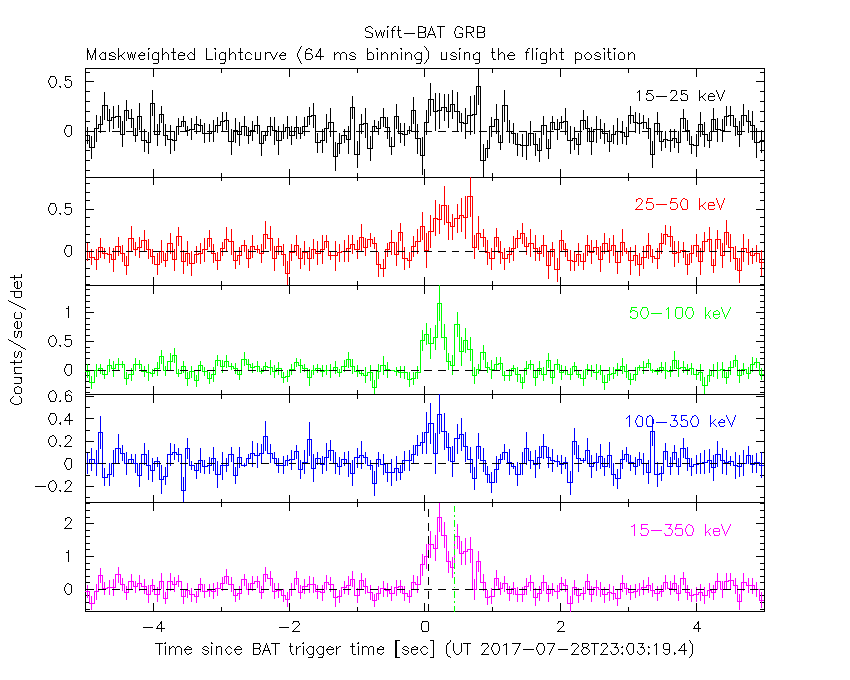
Lightcurves
Notes:
- 1) The mask-weighted light curves are using the flight position.
- 2) Multiple plots of different time binning/intervals are shown to cover all scenarios of short/long GRBs, rate/image triggers, and real/false positives.
- 3) For all the mask-weighted lightcurves, the y-axis units are counts/sec/det where a det is 0.4 x 0.4 = 0.16 sq cm.
- 4) The verticle lines correspond to following: green dotted lines are T50 interval, black dotted lines are T90 interval, blue solid line(s) is a spacecraft slew start time, and orange solid line(s) is a spacecraft slew end time.
- 5) Time of each bin is in the middle of the bin.
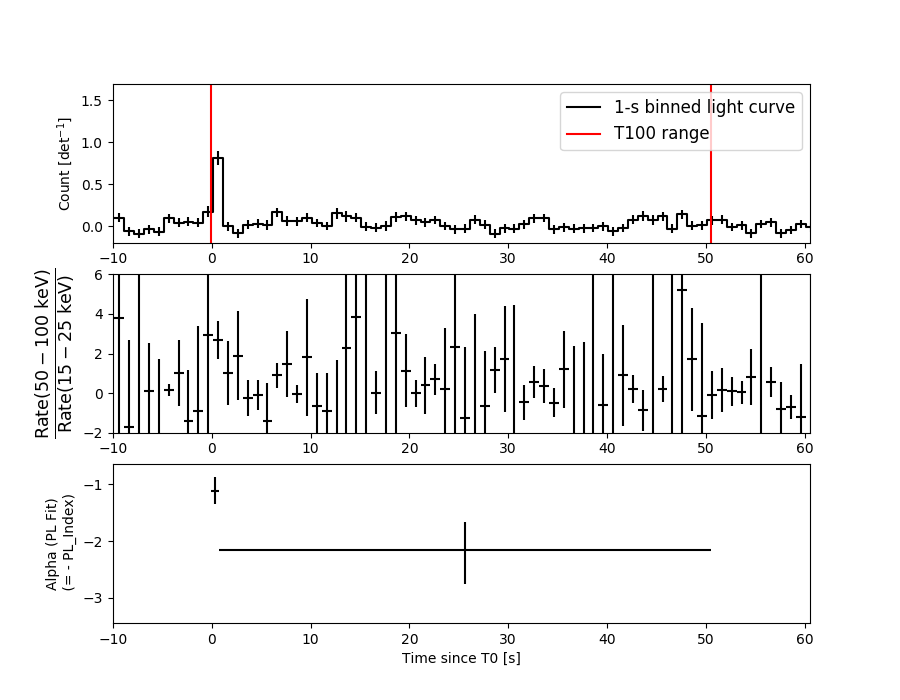
1 s binning
From T0-310 s to T0+310 s
From T100_start - 20 s to T100_end + 30 s
Full time interval

64 ms binning
Full time interval

From T100_start to T100_end

From T0-5 sec to T0+5 sec
16 ms binning
From T100_start-5 s to T100_start+5 s

Blue+Cyan dotted lines: Time interval of the scaled map
From 0.000000 to 0.256000
8 ms binning
From T100_start-3 s to T100_start+3 s
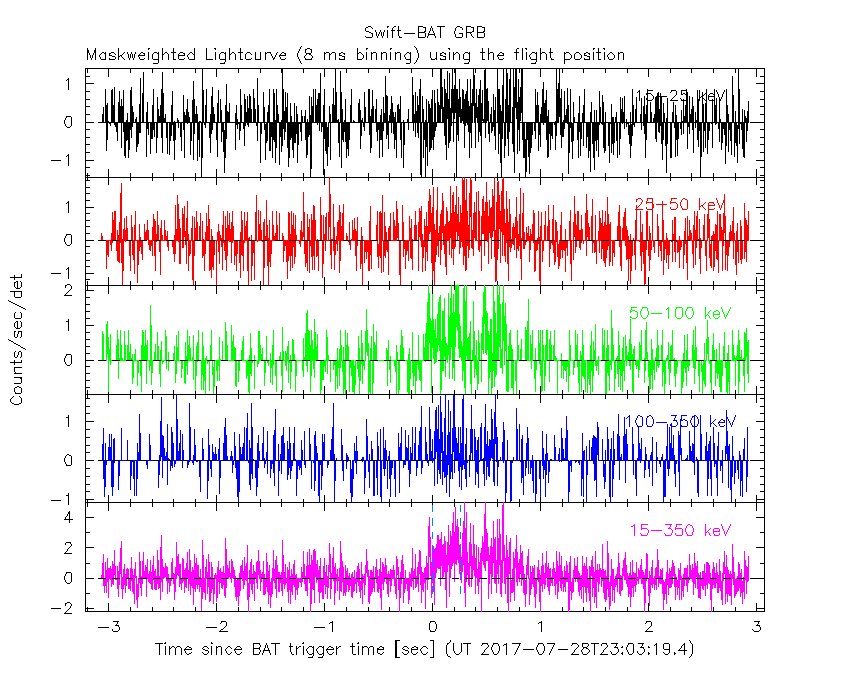
Blue+Cyan dotted lines: Time interval of the scaled map
From 0.000000 to 0.256000
2 ms binning
From T100_start-1 s to T100_start+1 s
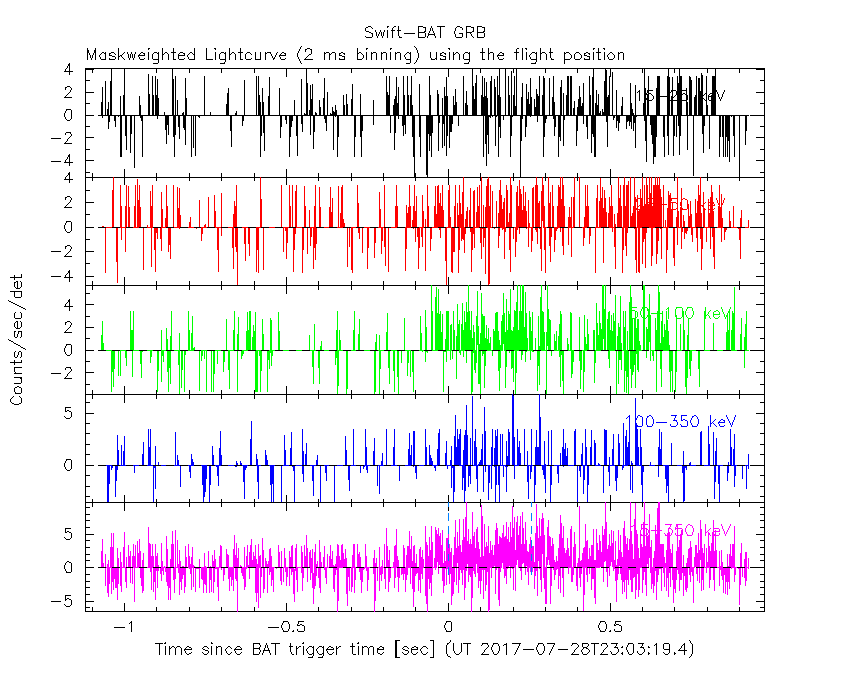
Blue+Cyan dotted lines: Time interval of the scaled map
From 0.000000 to 0.256000
SN=5 or 10 sec. binning (whichever binning is satisfied first)

SN=5 or 10 sec. binning (T < 200 sec)

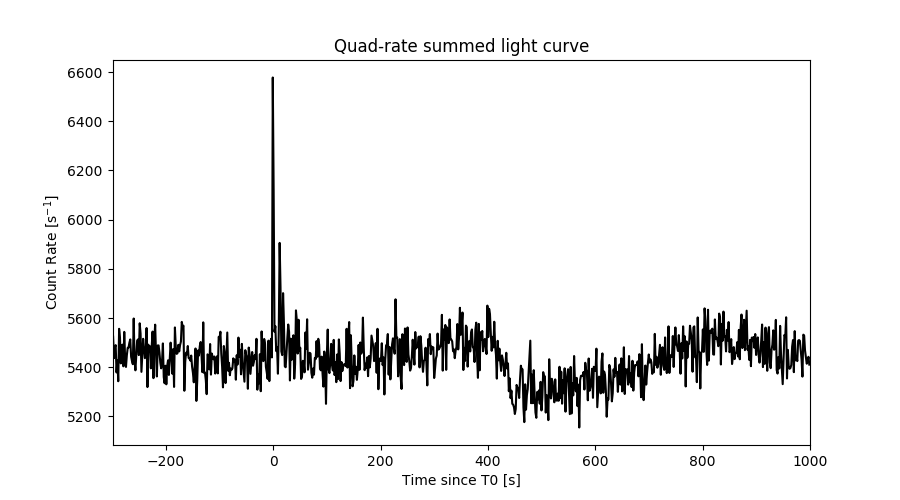
Quad-rate summed light curves (from T0-300s to T0+1000s)
Spectral Evolution
Spectra
Notes:
- 1) The fitting includes the systematic errors.
- 2) When the burst includes telescope slew time periods, the fitting uses an average response file made from multiple 5-s response files through out the slew time plus single time preiod for the non-slew times, and weighted by the total counts in the corresponding time period using addrmf. An average response file is needed becuase a spectral fit using the pre-slew DRM will introduce some errors in both a spectral shape and a normalization if the PHA file contains a lot of the slew/post-slew time interval.
- 3) For fits to more complicated models (e.g. a power-law over a cutoff power-law), the BAT team has decided to require a chi-square improvement of more than 6 for each extra dof.
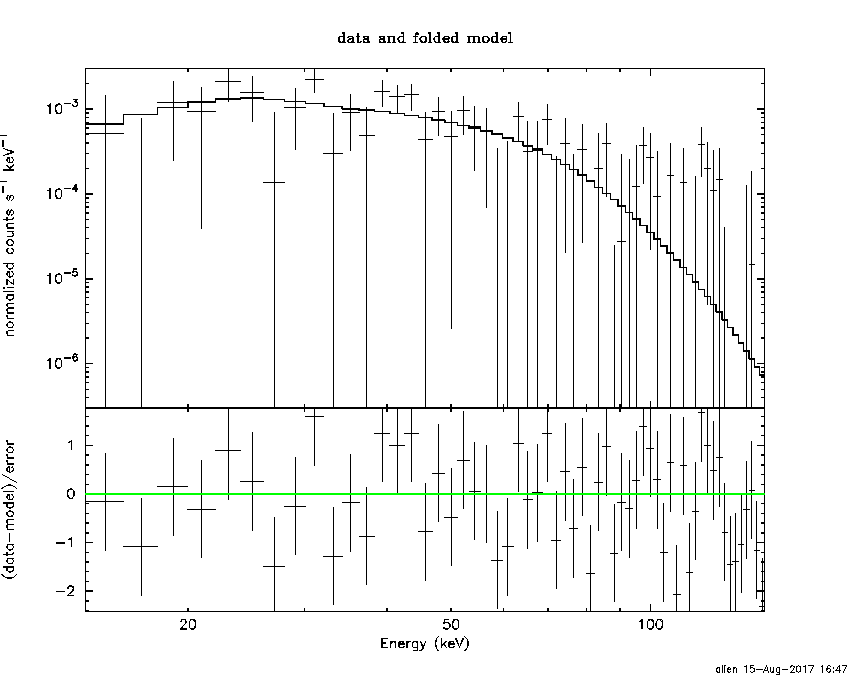
Time averaged spectrum fit using the average DRM
Power-law model

Time interval is from   -0.072 sec. to   50.552 sec.

Spectral model in power-law:
------------------------------------------------------------
Parameters  : value       lower 90%   higher 90%
Photon index: 1.87136     ( -0.352328   0.374857 )
Norm@50keV  : 3.55924E-03    ( -0.000951901   0.000938537 )
------------------------------------------------------------
#Fit statistic : Chi-Squared =          70.26 using 59 PHA bins.
# Reduced chi-squared =          1.233 for     57 degrees of freedom
# Null hypothesis probability =   1.115003e-01

Photon flux (15-150 keV)    in 50.62 sec: 0.505134 ( -0.126857  0.127768 ) ph/cm2/s
Energy fluence (15-150 keV)             : 1.65414e-06 ( -4.34695e-07  4.43409e-07 ) ergs/cm2
Cutoff power-law model

Time interval is from   -0.072 sec. to   50.552 sec.
Spectral model in the cutoff power-law:
------------------------------------------------------------
Parameters  : value       lower 90%   higher 90%
Photon index: -3.43613     ( -5.39705   3.38188 )
Epeak [keV] : 46.4729      ( -6.63383 9.98502 )
Norm@50keV  : 2.24565    ( -2.1831   1805.98 )
------------------------------------------------------------
#Fit statistic : Chi-Squared =          56.75 using 59 PHA bins.
# Reduced chi-squared =          1.013 for     56 degrees of freedom
# Null hypothesis probability =   4.467302e-01

Photon flux (15-150 keV)    in 50.62 sec: 0.447189 ( -0.120636  0.127005 ) ph/cm2/s
Energy fluence (15-150 keV)             : 1.44013e-06 ( -3.72697e-07  4.11146e-07 ) ergs/cm2
Band function

Time interval is from   -0.072 sec. to   50.552 sec.


Spectral model in the Band function:
------------------------------------------------------------
Parameters  : value       lower 90%   higher 90%
alpha       :    (     )
beta        :     (     )
Epeak [keV] :       (   )
Norm@50keV   :     (     )
------------------------------------------------------------

Photon flux (15-150 keV)    in  sec:  (    ) ph/cm2/s
Energy fluence (15-150 keV)             : 0 ( 0  0 ) ergs/cm2
Single BB
Spectral model blackbody:
------------------------------------------------------------
Parameters  : value    Lower 90%  Upper 90%
kT [keV]    : 12.2969  (-2.09887  2.54261)
R^2/D10^2   : 0.130419  (-0.0680706   0.13336)
(R is the radius in km and D10 is the distance to the source in units of 10 kpc)
------------------------------------------------------------
#Fit statistic : Chi-Squared =          57.40 using 59 PHA bins.
# Reduced chi-squared =          1.007 for     57 degrees of freedom
# Null hypothesis probability =   4.601111e-01

Energy  Fluence     90% Error
[keV]   [erg/cm2]   [erg/cm2]
15- 25  2.115e-07   8.502e-08
25- 50  6.847e-07   2.434e-07
50-150  6.326e-07   3.416e-07
15-150  1.529e-06   5.075e-07
Thermal bremsstrahlung (OTTB)

Spectral model: thermal bremsstrahlung
------------------------------------------------------------
Parameters  : value         Lower 90%    Upper 90%
kT [keV]    : 76.4316       (-32.37      83.3594)
Norm        : 2.54789       (-0.7296     0.951546)
------------------------------------------------------------
#Fit statistic : Chi-Squared =          65.78 using 59 PHA bins.
# Reduced chi-squared =          1.154 for     57 degrees of freedom
# Null hypothesis probability =   1.989789e-01

Energy  Fluence     90% Error
[keV]   [erg/cm2]   [erg/cm2]
15- 25  3.336e-07   1.196e-07
25- 50  5.430e-07   2.595e-07
50-150  7.429e-07   5.819e-07
15-150  1.620e-06   8.587e-07
Double BB

Spectral model: bbodyrad<1> + bbodyrad<2>
------------------------------------------------------------
Parameters  : value         Lower 90%    Upper 90%
kT1 [keV]   : 9.56080E-03        (0.822496      -0.0095608)
R1^2/D10^2  : 9.16137E+23        (-9.16137e+23      -9.16137e+23)
kT2 [keV]   : 12.2968        (-2.09887      2.54261)
R2^2/D10^2  : 0.130424    (-0.0680706   0.13336)
------------------------------------------------------------
#Fit statistic : Chi-Squared =          57.40 using 59 PHA bins.
# Reduced chi-squared =          1.044 for     55 degrees of freedom
# Null hypothesis probability =   3.861768e-01

Energy  Fluence     90% Error
[keV]   [erg/cm2]   [erg/cm2]
15- 25  0.000e+00   0.000e+00
25- 50  0.000e+00   0.000e+00
50-150  0.000e+00   0.000e+00
15-150  0.000e+00   0.000e+00
Peak spectrum fit
Power-law model
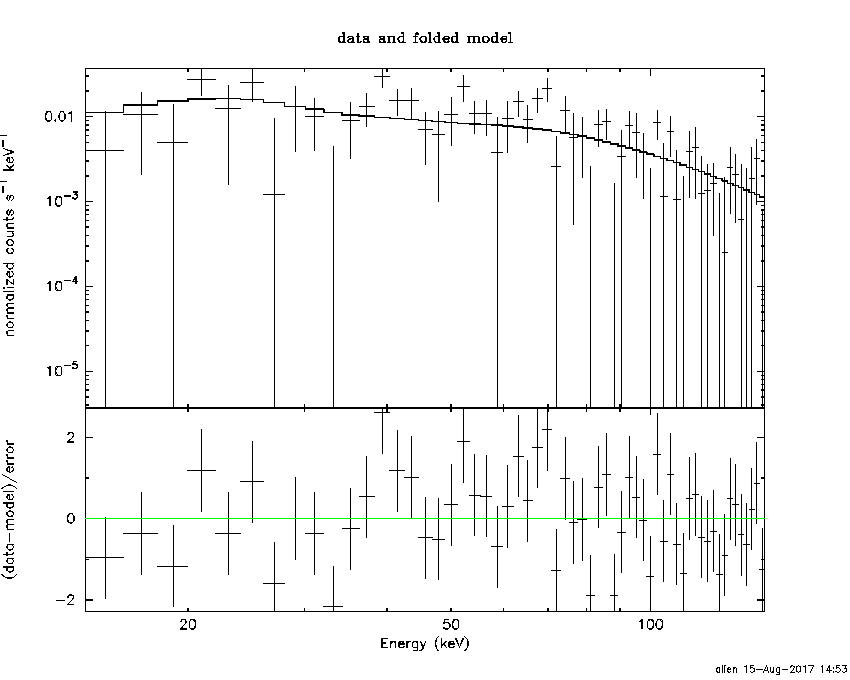
Time interval is from   -0.092 sec. to    0.908 sec.

Spectral model in power-law:
------------------------------------------------------------
Parameters  : value       lower 90%   higher 90%
Photon index: 1.16950     ( -0.241263   0.233349 )
Norm@50keV  : 6.66306E-02    ( -0.0105309   0.0104566 )
------------------------------------------------------------
#Fit statistic : Chi-Squared =          66.19 using 59 PHA bins.
# Reduced chi-squared =          1.161 for     57 degrees of freedom
# Null hypothesis probability =   1.895037e-01

Photon flux (15-150 keV)    in 1 sec: 0.188389 ( -0.027334  0.138299 ) ph/cm2/s
Energy fluence (15-150 keV)             : 6.82025e-07 ( -1.06002e-07  1.06073e-07 ) ergs/cm2
Cutoff power-law model

Time interval is from   -0.092 sec. to    0.908 sec.
Spectral model in the cutoff power-law:
------------------------------------------------------------
Parameters  : value       lower 90%   higher 90%
Photon index: -0.488726     ( -1.77094   1.23757 )
Epeak [keV] : 91.7061      ( -19.852 86.6182 )
Norm@50keV  : 0.327372    ( -0.327374   1.25055 )
------------------------------------------------------------
#Fit statistic : Chi-Squared =          60.51 using 59 PHA bins.
# Reduced chi-squared =          1.081 for     56 degrees of freedom
# Null hypothesis probability =   3.162605e-01

Photon flux (15-150 keV)    in 1 sec: 7.37137 ( -1.31472  1.33946 ) ph/cm2/s
Energy fluence (15-150 keV)             : 6.70363e-07 ( -1.12073e-07  1.10294e-07 ) ergs/cm2
Band function

Time interval is from   -0.092 sec. to    0.908 sec.


Spectral model in the Band function:
------------------------------------------------------------
Parameters  : value       lower 90%   higher 90%
alpha       :    (     )
beta        :     (     )
Epeak [keV] :       (   )
Norm@50keV   :     (     )
------------------------------------------------------------

Photon flux (15-150 keV)    in  sec:  (    ) ph/cm2/s
Energy fluence (15-150 keV)             : 0 ( 0  0 ) ergs/cm2
Single BB

Spectral model blackbody:
------------------------------------------------------------
Parameters  : value    Lower 90%  Upper 90%
kT [keV]    : 20.9215  (-3.04368  3.76106)
R^2/D10^2   : 0.340890  (-0.147503   0.239227)
(R is the radius in km and D10 is the distance to the source in units of 10 kpc)
------------------------------------------------------------
#Fit statistic : Chi-Squared =          61.52 using 59 PHA bins.
# Reduced chi-squared =          1.079 for     57 degrees of freedom
# Null hypothesis probability =   3.176214e-01

Energy  Fluence     90% Error
[keV]   [erg/cm2]   [erg/cm2]
15- 25  2.824e-08   8.340e-09
25- 50  1.448e-07   3.629e-08
50-150  4.722e-07   1.203e-07
15-150  6.452e-07   1.350e-07
Thermal bremsstrahlung (OTTB)

Spectral model: thermal bremsstrahlung
------------------------------------------------------------
Parameters  : value         Lower 90%    Upper 90%
kT [keV]    : 200.000       (-39.8514      -200)
Norm        : 33.8646       (-5.31869     5.31869)
------------------------------------------------------------
#Fit statistic : Chi-Squared =          72.60 using 59 PHA bins.
# Reduced chi-squared =          1.274 for     57 degrees of freedom
# Null hypothesis probability =   7.969255e-02

Energy  Fluence     90% Error
[keV]   [erg/cm2]   [erg/cm2]
15- 25  8.433e-08   4.971e-08
25- 50  1.622e-07   9.075e-08
50-150  3.558e-07   2.006e-07
15-150  6.023e-07   3.407e-07
Double BB
R1^2/D10^2  : 4.27793E-04        (-0.000427793      0.504975)
kT2 [keV]   : 18.0623        (-3.73008      5.35254)
R2^2/D10^2  : 0.492112    (-0.492112   8.5954)
------------------------------------------------------------
#Fit statistic : Chi-Squared =          60.78 using 59 PHA bins.
#Fit statistic : Chi-Squared =          60.34 using 59 PHA bins.
#Fit statistic : Chi-Squared =          60.28 using 59 PHA bins.
# Reduced chi-squared =          1.105 for     55 degrees of freedom
# Reduced chi-squared =          1.097 for     55 degrees of freedom
# Reduced chi-squared =          1.096 for     55 degrees of freedom
# Null hypothesis probability =   2.756071e-01
# Null hypothesis probability =   2.889989e-01
# Null hypothesis probability =   2.906488e-01

Energy  Fluence     90% Error
[keV]   [erg/cm2]   [erg/cm2]
15- 25  4.171e-08   1.962e-08
25- 50  1.418e-07   5.037e-08
50-150  4.777e-07   1.398e-07
15-150  6.613e-07   2.038e-07
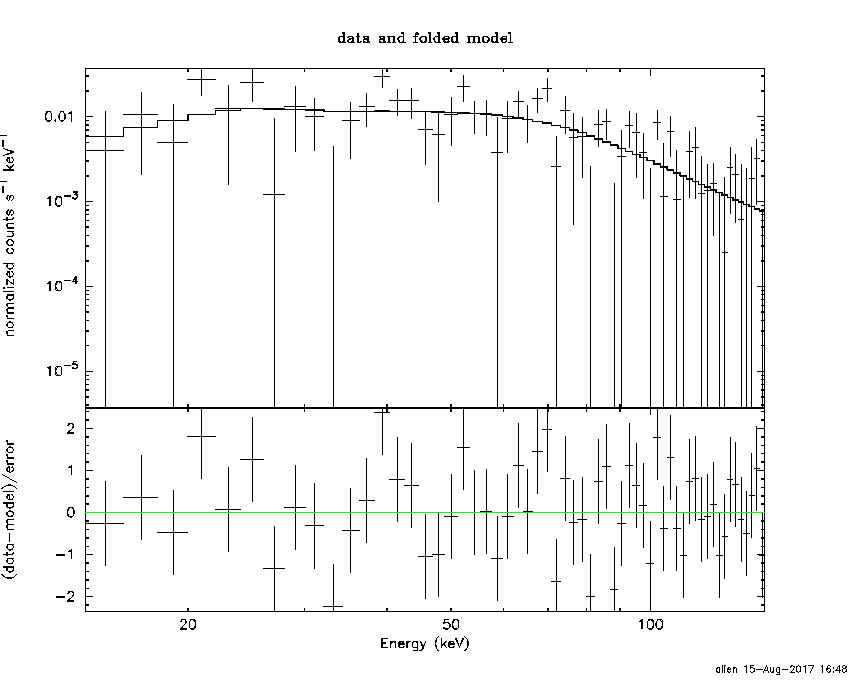
Pre-slew spectrum (Pre-slew PHA with pre-slew DRM)
Power-law model

Spectral model in power-law:
------------------------------------------------------------
Parameters  : value       lower 90%   higher 90%
Photon index: 1.87136     ( -0.352328   0.374857 )
Norm@50keV  : 3.55924E-03    ( -0.000951901   0.000938537 )
------------------------------------------------------------
#Fit statistic : Chi-Squared =          70.26 using 59 PHA bins.
# Reduced chi-squared =          1.233 for     57 degrees of freedom
# Null hypothesis probability =   1.115003e-01

Photon flux (15-150 keV)    in 50.62 sec: 0.504981 ( -0.126872  0.127747 ) ph/cm2/s
Energy fluence (15-150 keV)             : 1.65436e-06 ( -4.33824e-07  4.43856e-07 ) ergs/cm2
Cutoff power-law model

Spectral model in the cutoff power-law:
------------------------------------------------------------
Parameters  : value       lower 90%   higher 90%
Photon index: -3.17450     ( -5.374   3.41716 )
Epeak [keV] : 46.6864      ( -6.61576 9.96788 )
Norm@50keV  : 1.63515    ( -1.66348   1796.41 )
------------------------------------------------------------
#Fit statistic : Chi-Squared =          56.74 using 59 PHA bins.
# Reduced chi-squared =          1.013 for     56 degrees of freedom
# Null hypothesis probability =   4.470874e-01

Photon flux (15-150 keV)    in 50.62 sec: 0.447163 ( -0.120633  0.126985 ) ph/cm2/s
Energy fluence (15-150 keV)             : 1.44053e-06 ( -3.72791e-07  4.1151e-07 ) ergs/cm2
Band function

Spectral model in the Band function:
------------------------------------------------------------
Parameters  : value       lower 90%   higher 90%
alpha       :    (     )
beta        :     (     )
Epeak [keV] :       (   )
Norm@50keV   :     (     )
------------------------------------------------------------

Photon flux (15-150 keV)    in  sec:  (    ) ph/cm2/s
Energy fluence (15-150 keV)             : 0 ( 0  0 ) ergs/cm2
S(25-50 keV) vs. S(50-100 keV) plot
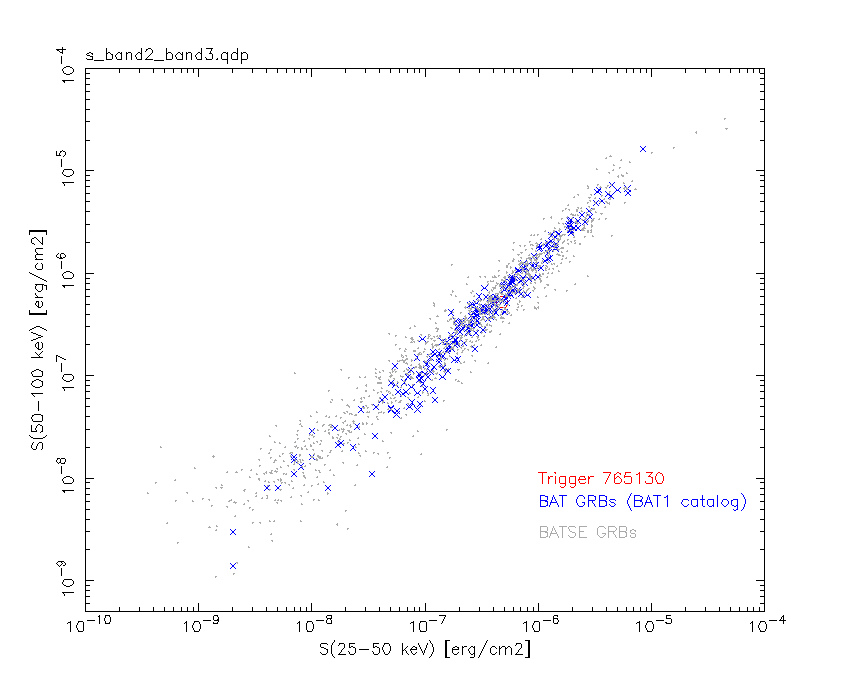
S(25-50 keV)  = 4.79e-07
S(50-100 keV) = 5.21e-07
T90 vs. Hardness ratio plot
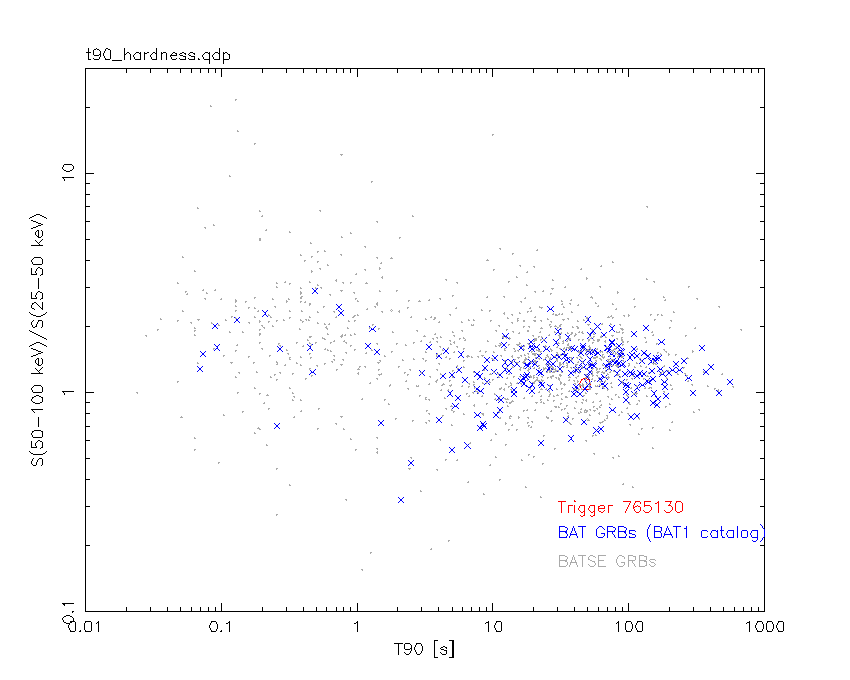
T90                                   = 47.6800000071526 sec.
Hardness ratio (energy fluence ratio) = 1.08768
Color vs. Color plot
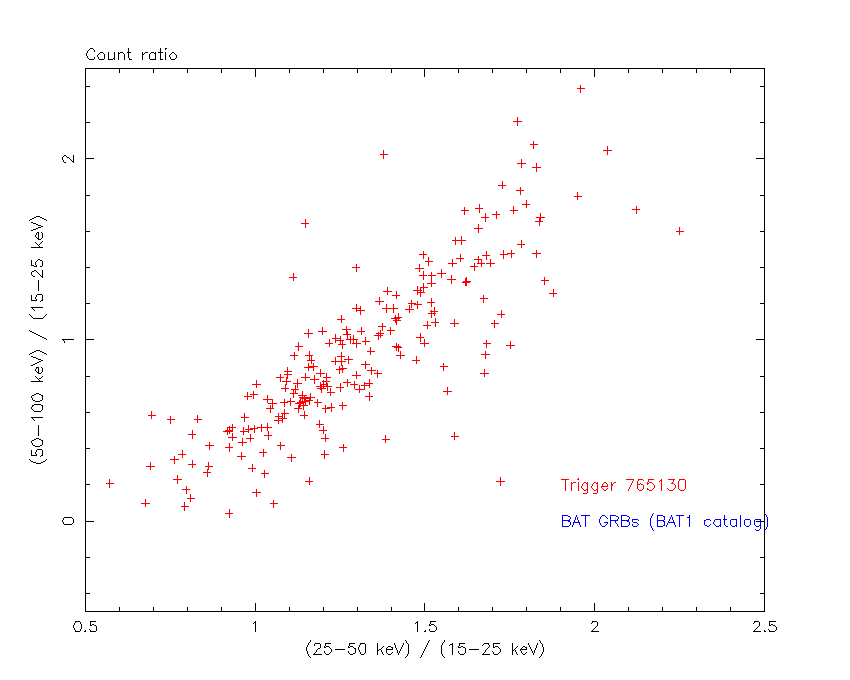
Count Ratio  (25-50 keV) / (15-25 keV) = 2.79576
Count Ratio (50-100 keV) / (15-25 keV) = 1.3515
Mask shadow pattern

IMX = 1.420540216816482E+00, IMY = -2.514151513748106E-01
TIME vs. PHA plot around the trigger time

Blue+Cyan dotted lines: Time interval of the scaled map
From 0.000000 to 0.256000
TIME vs. DetID plot around the trigger time

Blue+Cyan dotted lines: Time interval of the scaled map
From 0.000000 to 0.256000
100 us light curve (15-350 keV)

Blue+Cyan dotted lines: Time interval of the scaled map
From 0.000000 to 0.256000
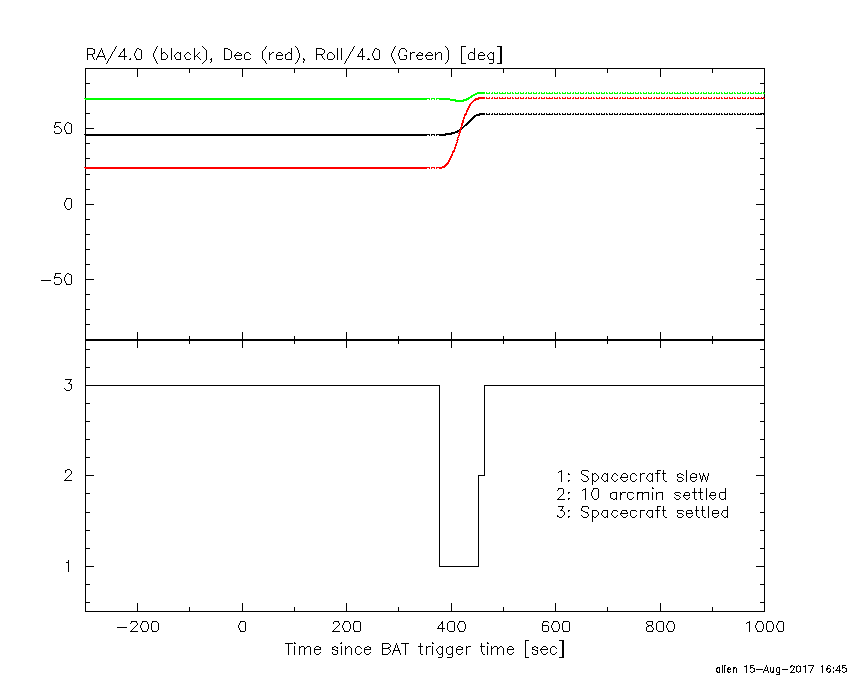
Spacecraft aspect plot
Bright source in the pre-burst/pre-slew/post-slew images
Pre-burst image of 15-350 keV band
Time interval of the image:
-239.880000 -0.072000

# RAcent  DECcent POSerr Theta    Phi  PeakCts   SNR AngSep     Name
#  [deg]    [deg]    ['] [deg]  [deg]                   [']
196.2002  14.9679    2.2  14.6  117.9   1.1267   5.3 ------	UNKNOWN
224.4736  67.8034    2.5  50.0    9.1   2.0579   4.6 ------	UNKNOWN
165.5516  -2.7667    3.2  32.6 -153.0   0.8709   3.6 ------	UNKNOWN
162.1775  46.8872    2.4  28.7  -41.8   1.2298   4.9 ------	UNKNOWN
161.3406 -24.9434    2.5  54.0 -163.6   3.0255   4.7 ------	UNKNOWN
Pre-slew background subtracted image of 15-350 keV band
Time interval of the image:
-0.072000 50.552000

# RAcent  DECcent POSerr Theta    Phi  PeakCts   SNR AngSep     Name
#  [deg]    [deg]    ['] [deg]  [deg]                   [']
237.9847  70.1172    1.8  55.3   10.0   2.8139   6.6 ------	UNKNOWN
212.7808  64.9968    2.1  44.7    7.2   0.7622   5.6 ------	UNKNOWN
175.0341  49.3327    2.2  26.1  -23.2   0.4515   5.3 ------	UNKNOWN
162.7955   6.5672    2.2  27.1 -136.7   0.4576   5.2 ------	UNKNOWN
157.3265  38.3635    2.4  26.8  -61.4   0.4978   4.9 ------	UNKNOWN
Post-slew image of 15-350 keV band
Time interval of the image:
452.720600 962.150000

# RAcent  DECcent POSerr Theta    Phi  PeakCts   SNR AngSep     Name
#  [deg]    [deg]    ['] [deg]  [deg]                   [']
254.4588  35.3643    9.3  35.9  132.4   0.8320   1.2    1.3	Her X-1
299.3344  59.3203    2.2  26.9   57.8   2.4471   5.2 ------	UNKNOWN
177.3180  34.3641    4.1  48.1 -129.1   4.8454   2.8 ------	UNKNOWN
Plot creation:
Tue Aug 15 16:54:35 EDT 2017