Special notes of this burst
Image
Pre-slew 15.0-350.0 keV image (Event data)

#   RAcent    DECcent   POSerr    Theta     Phi              Peak Cts       SNR   Name
  201.0572    -5.5278   0.0358    30.2204   -34.6047         2.9155052      5.372 TRIG_00767563

Foreground time interval of the image:
 -9.164  72.901 (delta_t =  82.065 [sec])
Background time interval of the image:
-13.699  -9.164 (delta_t =   4.535 [sec])
Lightcurves
Notes:
- 1) The mask-weighted light curves are using the flight position.
- 2) Multiple plots of different time binning/intervals are shown to cover all scenarios of short/long GRBs, rate/image triggers, and real/false positives.
- 3) For all the mask-weighted lightcurves, the y-axis units are counts/sec/det where a det is 0.4 x 0.4 = 0.16 sq cm.
- 4) The verticle lines correspond to following: green dotted lines are T50 interval, black dotted lines are T90 interval, blue solid line(s) is a spacecraft slew start time, and orange solid line(s) is a spacecraft slew end time.
- 5) Time of each bin is in the middle of the bin.
1 s binning
From T0-310 s to T0+310 s
From T100_start - 20 s to T100_end + 30 s

Full time interval

64 ms binning
Full time interval

From T100_start to T100_end

From T0-5 sec to T0+5 sec

16 ms binning
From T100_start-5 s to T100_start+5 s

Blue+Cyan dotted lines: Time interval of the scaled map
From 0.000000 to 64.000000
8 ms binning
From T100_start-3 s to T100_start+3 s

Blue+Cyan dotted lines: Time interval of the scaled map
From 0.000000 to 64.000000
2 ms binning
From T100_start-1 s to T100_start+1 s

Blue+Cyan dotted lines: Time interval of the scaled map
From 0.000000 to 64.000000
SN=5 or 10 sec. binning (whichever binning is satisfied first)

SN=5 or 10 sec. binning (T < 200 sec)

Quad-rate summed light curves (from T0-300s to T0+1000s)

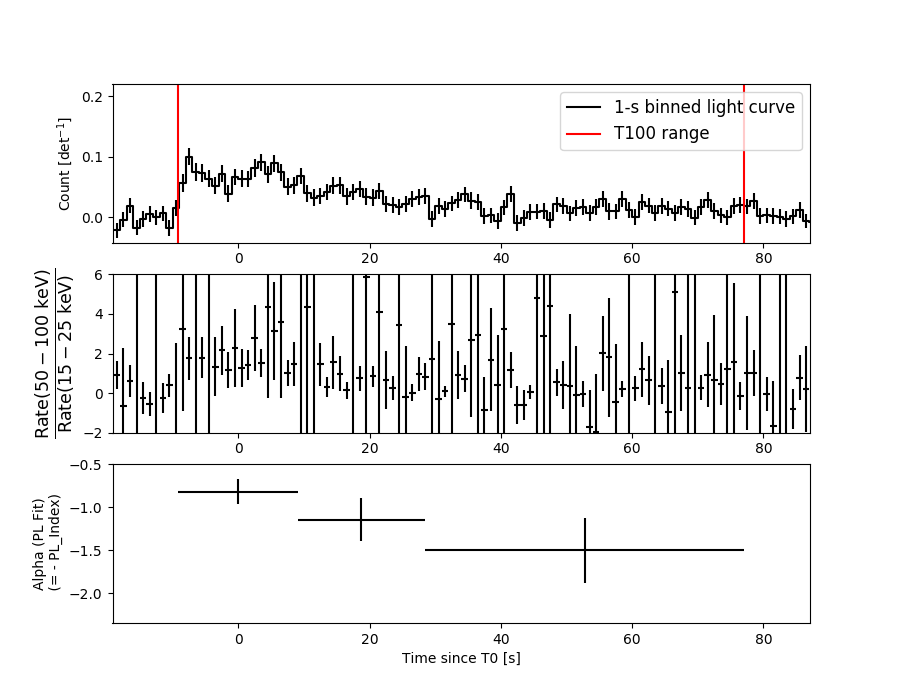
Spectral Evolution
Spectra
Notes:
- 1) The fitting includes the systematic errors.
- 2) When the burst includes telescope slew time periods, the fitting uses an average response file made from multiple 5-s response files through out the slew time plus single time preiod for the non-slew times, and weighted by the total counts in the corresponding time period using addrmf. An average response file is needed becuase a spectral fit using the pre-slew DRM will introduce some errors in both a spectral shape and a normalization if the PHA file contains a lot of the slew/post-slew time interval.
- 3) For fits to more complicated models (e.g. a power-law over a cutoff power-law), the BAT team has decided to require a chi-square improvement of more than 6 for each extra dof.
Time averaged spectrum fit using the average DRM
Power-law model

Time interval is from   -9.164 sec. to   77.088 sec.

Spectral model in power-law:
------------------------------------------------------------
Parameters  : value       lower 90%   higher 90%
Photon index: 1.09685     ( -0.140896   0.13747 )
Norm@50keV  : 2.10070E-03    ( -0.000161205   0.000160688 )
------------------------------------------------------------
#Fit statistic : Chi-Squared =          57.76 using 59 PHA bins.
# Reduced chi-squared =          1.013 for     57 degrees of freedom
# Null hypothesis probability =   4.470168e-01

Photon flux (15-150 keV)    in 86.25 sec: 0.243593 ( -0.019501  0.019592 ) ph/cm2/s
Energy fluence (15-150 keV)             : 1.89644e-06 ( -1.5287e-07  1.53633e-07 ) ergs/cm2
Cutoff power-law model
Time interval is from   -9.164 sec. to   77.088 sec.
Spectral model in the cutoff power-law:
------------------------------------------------------------
Parameters  : value       lower 90%   higher 90%
Photon index: 1.09688     ( -0.143751   0.137715 )
Epeak [keV] : 9999.31      ( -9999.36 -9999.36 )
Norm@50keV  : 2.10073E-03    ( -0.000159623   0.00140929 )
------------------------------------------------------------
#Fit statistic : Chi-Squared =          57.78 using 59 PHA bins.
# Reduced chi-squared =          1.032 for     56 degrees of freedom
# Null hypothesis probability =   4.093181e-01

Photon flux (15-150 keV)    in 86.25 sec: 0.243586 ( -0.019474  0.019424 ) ph/cm2/s
Energy fluence (15-150 keV)             : 1.8964e-06 ( -1.60518e-07  1.52591e-07 ) ergs/cm2
Band function

Time interval is from   -9.164 sec. to   77.088 sec.


Spectral model in the Band function:
------------------------------------------------------------
Parameters  : value       lower 90%   higher 90%
alpha       :    (     )
beta        :     (     )
Epeak [keV] :       (   )
Norm@50keV   :     (     )
------------------------------------------------------------

Photon flux (15-150 keV)    in  sec:  (    ) ph/cm2/s
Energy fluence (15-150 keV)             : 0 ( 0  0 ) ergs/cm2
Single BB
Spectral model blackbody:
------------------------------------------------------------
Parameters  : value    Lower 90%  Upper 90%
kT [keV]    : 21.9673  (-2.36158  2.7786)
R^2/D10^2   : 8.32027E-03  (-0.00262848   0.00370626)
(R is the radius in km and D10 is the distance to the source in units of 10 kpc)
------------------------------------------------------------
#Fit statistic : Chi-Squared =          95.43 using 59 PHA bins.
# Reduced chi-squared =          1.674 for     57 degrees of freedom
# Null hypothesis probability =   1.075627e-03

Energy  Fluence     90% Error
[keV]   [erg/cm2]   [erg/cm2]
15- 25  6.413e-08   1.127e-08
25- 50  3.388e-07   4.054e-08
50-150  1.222e-06   1.410e-07
15-150  1.625e-06   1.565e-07
Thermal bremsstrahlung (OTTB)

Spectral model: thermal bremsstrahlung
------------------------------------------------------------
Parameters  : value         Lower 90%    Upper 90%
kT [keV]    : 200.000       (-13.9991      -200)
Norm        : 1.02614       (-0.0798687     0.0798687)
------------------------------------------------------------
#Fit statistic : Chi-Squared =          89.56 using 59 PHA bins.
# Reduced chi-squared =          1.571 for     57 degrees of freedom
# Null hypothesis probability =   3.810459e-03

Energy  Fluence     90% Error
[keV]   [erg/cm2]   [erg/cm2]
15- 25  2.205e-07   1.928e-08
25- 50  4.241e-07   5.964e-08
50-150  9.301e-07   3.719e-07
15-150  1.575e-06   3.860e-07
Double BB
Spectral model: bbodyrad<1> + bbodyrad<2>
------------------------------------------------------------
Parameters  : value         Lower 90%    Upper 90%
kT1 [keV]   : 8.16187        (-2.01336      2.45737)
R1^2/D10^2  : 0.123310        (-0.0689847      0.196628)
kT2 [keV]   : 37.1629        (-8.26724      18.6702)
R2^2/D10^2  : 1.40432E-03    (-0.00095048   0.00169556)
------------------------------------------------------------
#Fit statistic : Chi-Squared =          56.58 using 59 PHA bins.
# Reduced chi-squared =          1.029 for     55 degrees of freedom
# Null hypothesis probability =   4.159071e-01

Energy  Fluence     90% Error
[keV]   [erg/cm2]   [erg/cm2]
15- 25  1.527e-07   6.512e-08
25- 50  3.871e-07   1.417e-07
50-150  1.385e-06   6.370e-07
15-150  1.925e-06   6.580e-07
Peak spectrum fit
Power-law model
Time interval is from    2.788 sec. to    3.788 sec.

Spectral model in power-law:
------------------------------------------------------------
Parameters  : value       lower 90%   higher 90%
Photon index: 1.10304     ( -0.431817   0.402716 )
Norm@50keV  : 6.88971E-03    ( -0.00155979   0.00155524 )
------------------------------------------------------------
#Fit statistic : Chi-Squared =          48.77 using 59 PHA bins.
# Reduced chi-squared =         0.8557 for     57 degrees of freedom
# Null hypothesis probability =   7.726664e-01

Photon flux (15-150 keV)    in 1 sec: 0.799397 ( -0.1861  0.187447 ) ph/cm2/s
Energy fluence (15-150 keV)             : 7.19714e-08 ( -1.76876e-08  1.79514e-08 ) ergs/cm2
Cutoff power-law model

Time interval is from    2.788 sec. to    3.788 sec.
Spectral model in the cutoff power-law:
------------------------------------------------------------
Parameters  : value       lower 90%   higher 90%
Photon index: 1.10122     ( -0.436953   0.403234 )
Epeak [keV] : 9999.36      ( -9999.36 -9999.36 )
Norm@50keV  : 6.92462E-03    ( -0.00155517   0.0445772 )
------------------------------------------------------------
#Fit statistic : Chi-Squared =          48.78 using 59 PHA bins.
# Reduced chi-squared =         0.8710 for     56 degrees of freedom
# Null hypothesis probability =   7.423804e-01

Photon flux (15-150 keV)    in 1 sec: 0.800033 ( -0.190593  0.185921 ) ph/cm2/s
Energy fluence (15-150 keV)             : 7.21141e-08 ( -1.99358e-08  1.56345e-08 ) ergs/cm2
Band function

Time interval is from    2.788 sec. to    3.788 sec.


Spectral model in the Band function:
------------------------------------------------------------
Parameters  : value       lower 90%   higher 90%
alpha       :    (     )
beta        :     (     )
Epeak [keV] :       (   )
Norm@50keV   :     (     )
------------------------------------------------------------

Photon flux (15-150 keV)    in  sec:  (    ) ph/cm2/s
Energy fluence (15-150 keV)             : 0 ( 0  0 ) ergs/cm2
Single BB

Spectral model blackbody:
------------------------------------------------------------
Parameters  : value    Lower 90%  Upper 90%
kT [keV]    : 19.0132  (-5.13554  8.78675)
R^2/D10^2   : 4.34132E-02  (-0.0305155   0.0802836)
(R is the radius in km and D10 is the distance to the source in units of 10 kpc)
------------------------------------------------------------
#Fit statistic : Chi-Squared =          52.91 using 59 PHA bins.
# Reduced chi-squared =         0.9283 for     57 degrees of freedom
# Null hypothesis probability =   6.291891e-01

Energy  Fluence     90% Error
[keV]   [erg/cm2]   [erg/cm2]
15- 25  3.084e-09   1.470e-09
25- 50  1.484e-08   7.384e-09
50-150  3.943e-08   2.021e-08
15-150  5.736e-08   2.541e-08
Thermal bremsstrahlung (OTTB)

Spectral model: thermal bremsstrahlung
------------------------------------------------------------
Parameters  : value         Lower 90%    Upper 90%
kT [keV]    : 200.000       (-79.6338      -200)
Norm        : 3.30469       (-0.767106     0.767106)
------------------------------------------------------------
#Fit statistic : Chi-Squared =          52.10 using 59 PHA bins.
# Reduced chi-squared =         0.9141 for     57 degrees of freedom
# Null hypothesis probability =   6.588581e-01

Energy  Fluence     90% Error
[keV]   [erg/cm2]   [erg/cm2]
15- 25  8.229e-09   4.965e-09
25- 50  1.583e-08   9.350e-09
50-150  3.472e-08   2.009e-08
15-150  5.878e-08   3.509e-08
Double BB

Spectral model: bbodyrad<1> + bbodyrad<2>
------------------------------------------------------------
Parameters  : value         Lower 90%    Upper 90%
kT1 [keV]   : 12.0830        (-7.59162      4.93586)
R1^2/D10^2  : 0.151639        (-0.112237      2.81539)
kT2 [keV]   : 199.363        (-178.456      -199.363)
R2^2/D10^2  : 1.37695E-04    (-7.06116e-05   0.0279533)
------------------------------------------------------------
#Fit statistic : Chi-Squared =          48.06 using 59 PHA bins.
# Reduced chi-squared =         0.8738 for     55 degrees of freedom
# Null hypothesis probability =   7.349389e-01

Energy  Fluence     90% Error
[keV]   [erg/cm2]   [erg/cm2]
15- 25  4.861e-09   2.920e-09
25- 50  1.636e-08   1.036e-08
50-150  4.957e-08   1.581e-08
15-150  7.079e-08   2.695e-08
Pre-slew spectrum (Pre-slew PHA with pre-slew DRM)
Power-law model

Spectral model in power-law:
------------------------------------------------------------
Parameters  : value       lower 90%   higher 90%
Photon index: 1.07757     ( -0.139831   0.136237 )
Norm@50keV  : 2.17034E-03    ( -0.000165895   0.000165266 )
------------------------------------------------------------
#Fit statistic : Chi-Squared =          56.40 using 59 PHA bins.
# Reduced chi-squared =         0.9895 for     57 degrees of freedom
# Null hypothesis probability =   4.974029e-01

Photon flux (15-150 keV)    in 82.06 sec: 0.251224 ( -0.0199742  0.0200701 ) ph/cm2/s
Energy fluence (15-150 keV)             : 1.87561e-06 ( -1.49812e-07  1.50546e-07 ) ergs/cm2
Cutoff power-law model
Spectral model in the cutoff power-law:
------------------------------------------------------------
Parameters  : value       lower 90%   higher 90%
Photon index: 1.07223     ( -0.470419   0.195392 )
Epeak [keV] : 9998.53      ( -9998.53 -9998.53 )
Norm@50keV  : 2.18234E-03    ( -0.00016419   0.00149505 )
------------------------------------------------------------
#Fit statistic : Chi-Squared =          56.40 using 59 PHA bins.
# Reduced chi-squared =          1.007 for     56 degrees of freedom
# Null hypothesis probability =   4.598005e-01

Photon flux (15-150 keV)    in 82.06 sec: 0.250999 ( -0.020742  0.020113 ) ph/cm2/s
Energy fluence (15-150 keV)             : 1.87839e-06 ( -1.60682e-07  1.47659e-07 ) ergs/cm2
Band function
Spectral model in the Band function:
------------------------------------------------------------
Parameters  : value       lower 90%   higher 90%
alpha       :    (     )
beta        :     (     )
Epeak [keV] :       (   )
Norm@50keV   :     (     )
------------------------------------------------------------

Photon flux (15-150 keV)    in  sec:  (    ) ph/cm2/s
Energy fluence (15-150 keV)             : 0 ( 0  0 ) ergs/cm2
S(25-50 keV) vs. S(50-100 keV) plot
S(25-50 keV)  = 3.73e-07
S(50-100 keV) = 6.99e-07
T90 vs. Hardness ratio plot

T90                                   = 72.5439999103546 sec.
Hardness ratio (energy fluence ratio) = 1.87399
Color vs. Color plot

Count Ratio  (25-50 keV) / (15-25 keV) = 1.51754
Count Ratio (50-100 keV) / (15-25 keV) = 1.48252
Mask shadow pattern

IMX = 4.794411180400238E-01, IMY = 3.308027243575003E-01
TIME vs. PHA plot around the trigger time
Blue+Cyan dotted lines: Time interval of the scaled map
From 0.000000 to 64.000000
TIME vs. DetID plot around the trigger time

Blue+Cyan dotted lines: Time interval of the scaled map
From 0.000000 to 64.000000
100 us light curve (15-350 keV)

Blue+Cyan dotted lines: Time interval of the scaled map
From 0.000000 to 64.000000
Spacecraft aspect plot

Bright source in the pre-burst/pre-slew/post-slew images
Pre-burst image of 15-350 keV band
Time interval of the image:
-13.699400 -9.164000

# RAcent  DECcent POSerr Theta    Phi  PeakCts   SNR AngSep     Name
#  [deg]    [deg]    ['] [deg]  [deg]                   [']
170.3957 -60.4365    6.8  35.8 -166.1   0.0515   1.7   11.4	Cen X-3
186.3768 -62.8628    6.2  31.5 -178.2  -0.0486  -1.9    9.5	GX 301-2
245.0258 -15.7103    2.2  37.2   50.2   0.2491   5.3    5.0	Sco X-1
255.8270 -37.9894    0.0  37.2   90.8   0.1237   1.8   11.5	4U 1700-377
256.4503 -36.4163  135.8  38.0   88.5   0.0064   0.1    0.8	GX 349+2
241.9964   4.9323    2.2  50.2   26.3   0.4497   5.1 ------	UNKNOWN
225.3251  14.7067    2.9  51.8    1.8   0.2451   3.9 ------	UNKNOWN
Pre-slew background subtracted image of 15-350 keV band
Time interval of the image:
-9.164000 72.900590

# RAcent  DECcent POSerr Theta    Phi  PeakCts   SNR AngSep     Name
#  [deg]    [deg]    ['] [deg]  [deg]                   [']
170.3381 -60.6068   88.0  35.9 -166.3  -0.0724  -0.1    1.2	Cen X-3
186.3656 -62.8590    5.3  31.5 -178.2   1.0283   2.2    9.6	GX 301-2
245.0858 -15.7677    4.0  37.2   50.4  -2.4583  -2.9    9.8	Sco X-1
255.8270 -37.9894    0.0  37.2   90.8  -2.2140  -1.7   11.5	4U 1700-377
256.5915 -36.2810    0.0  38.1   88.3  -1.3225  -0.9   11.4	GX 349+2
201.0572  -5.5278    2.1  30.2  -34.6   2.9160   5.4 ------	UNKNOWN
Post-slew image of 15-350 keV band
Time interval of the image:
123.100600 963.067600

# RAcent  DECcent POSerr Theta    Phi  PeakCts   SNR AngSep     Name
#  [deg]    [deg]    ['] [deg]  [deg]                   [']
178.2392 -59.5333    2.9  56.8  173.7  10.1587   4.1 ------	UNKNOWN
206.7792   8.8063    2.6  15.4    1.9   1.5291   4.4 ------	UNKNOWN
164.9981 -56.1727    2.5  58.2 -177.2  13.5841   4.5 ------	UNKNOWN
159.5206  -0.6190    3.2  41.8 -104.7   5.8514   3.6 ------	UNKNOWN
Plot creation:
Mon Sep 11 16:36:55 EDT 2017